. 2020 Jan;26(1):143-150.
doi: 10.1038/s41591-019-0711-0. Epub 2019 Dec 23.

Autism risk in offspring can be assessed through quantification of male sperm mosaicism

Affiliations

Autism risk in offspring can be assessed through quantification of male sperm mosaicism

Martin W Breuss et al. Nat Med. 2020 Jan.

Abstract

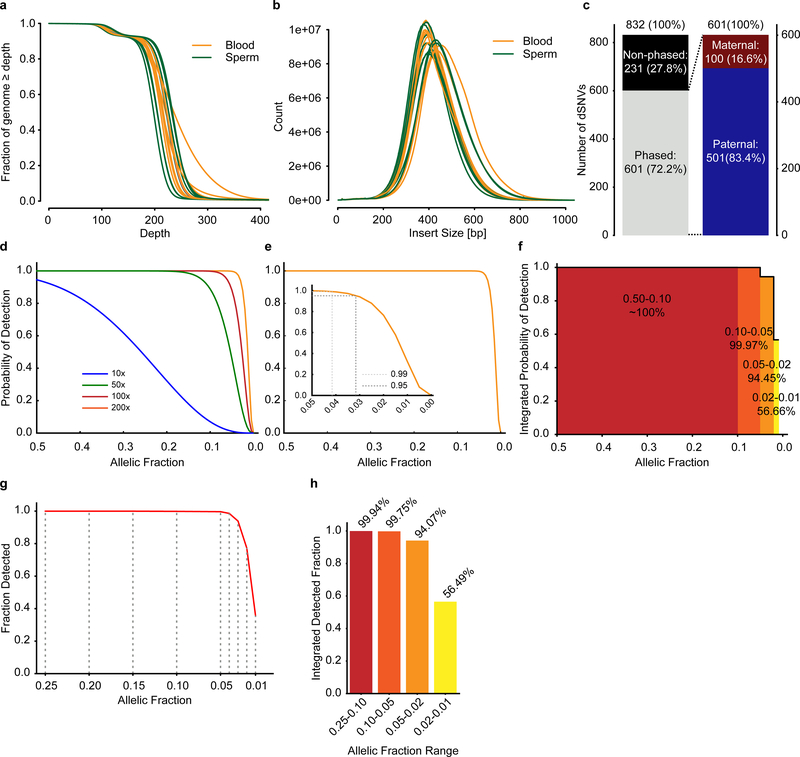
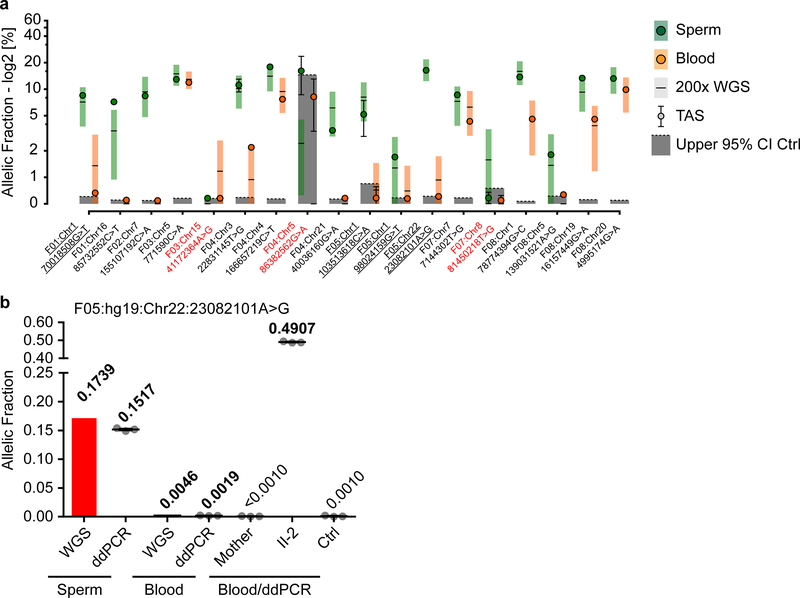
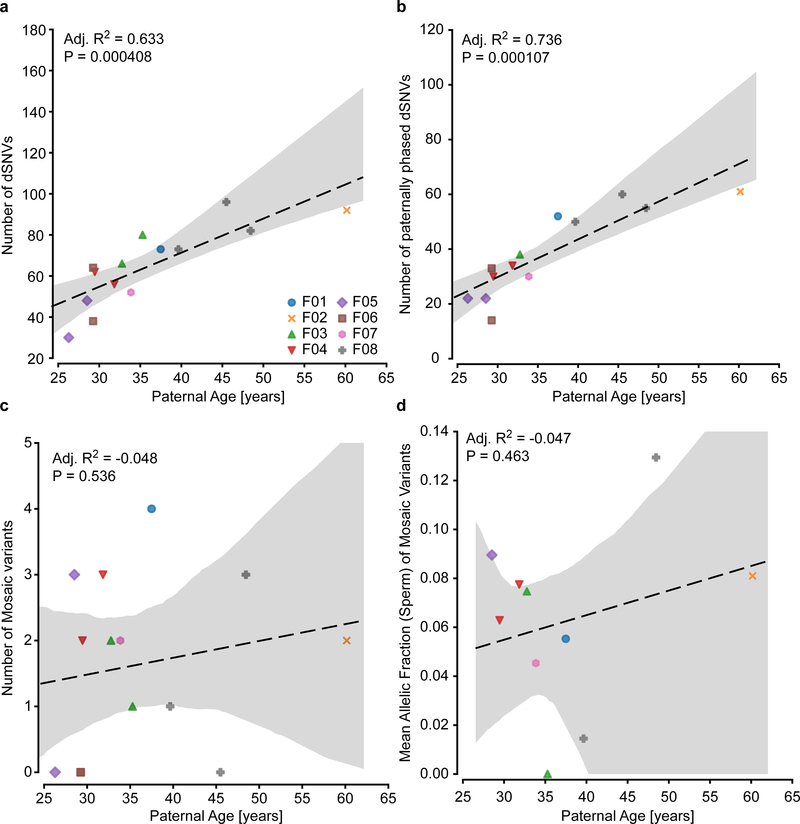
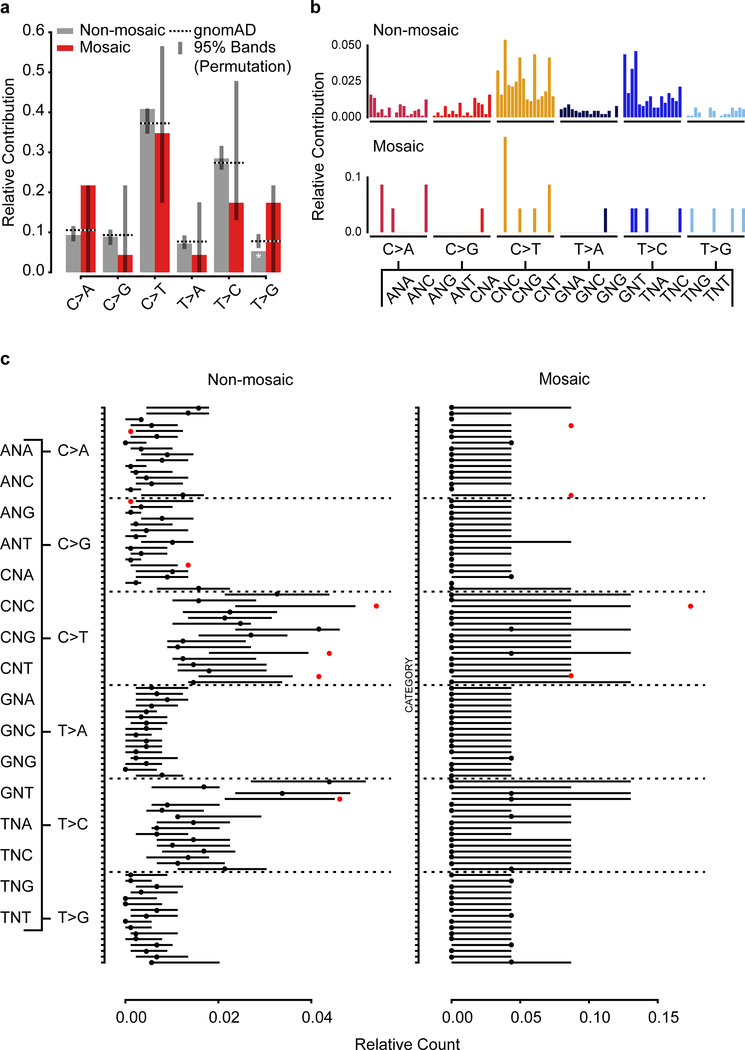
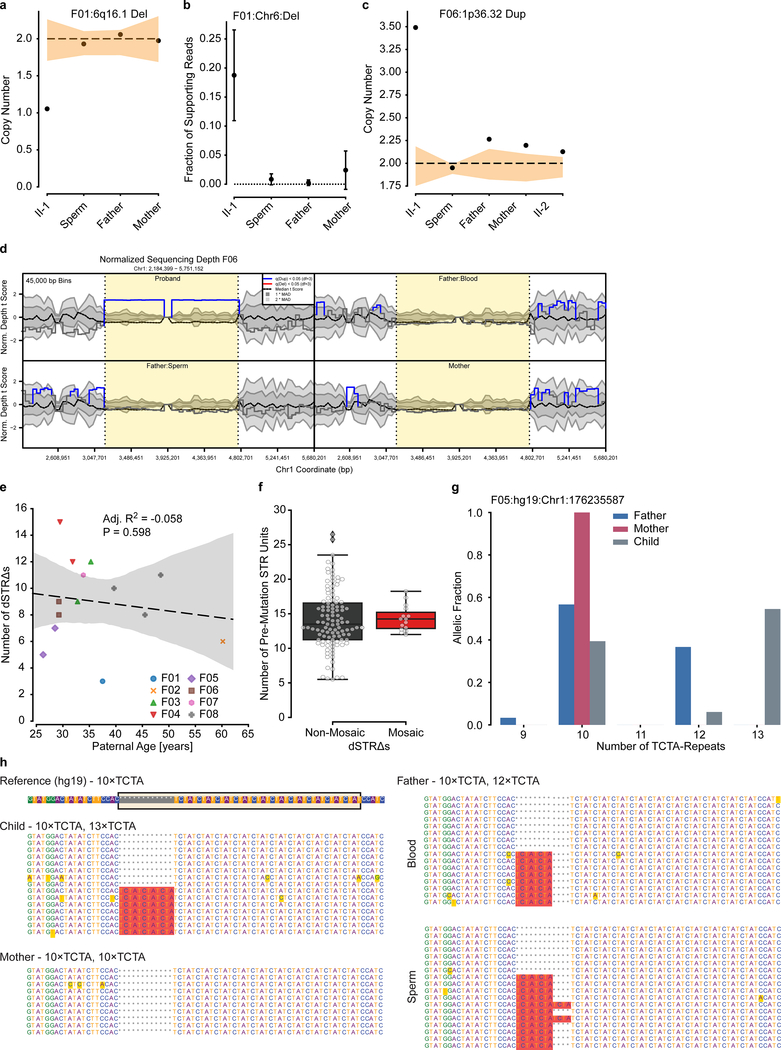
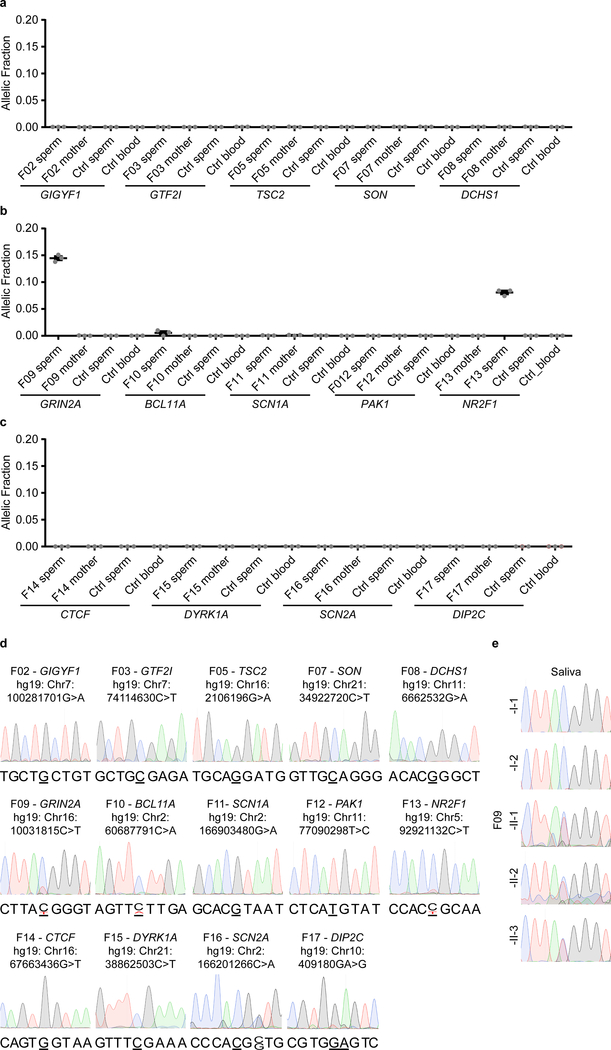
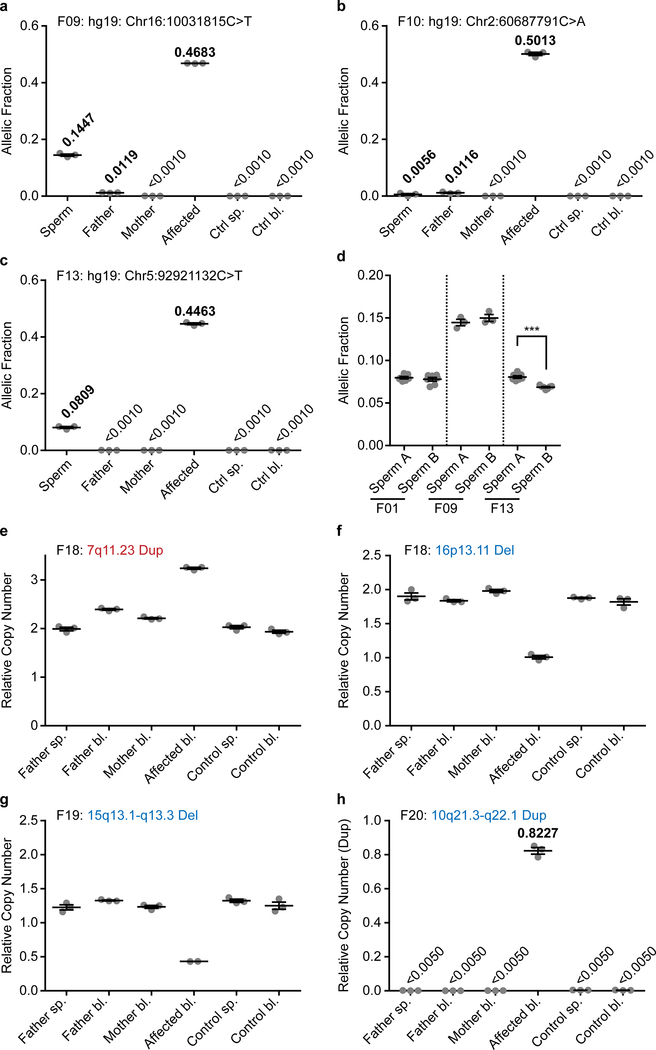
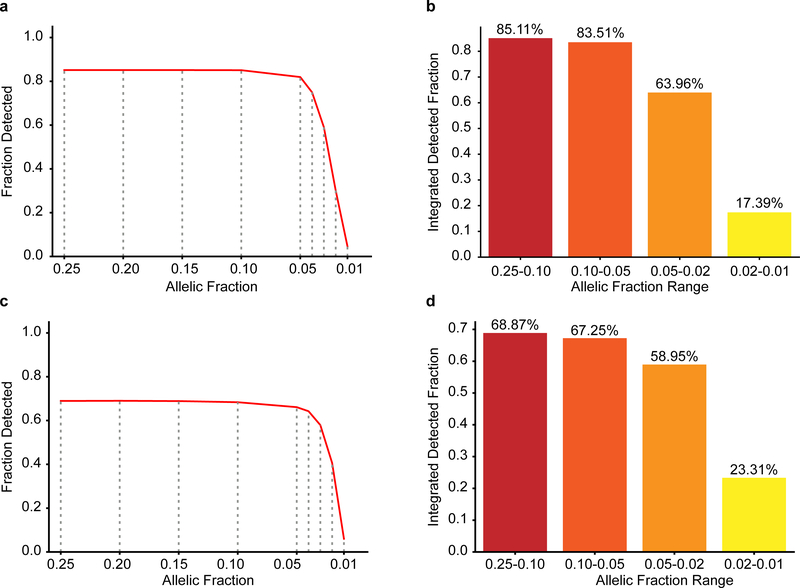
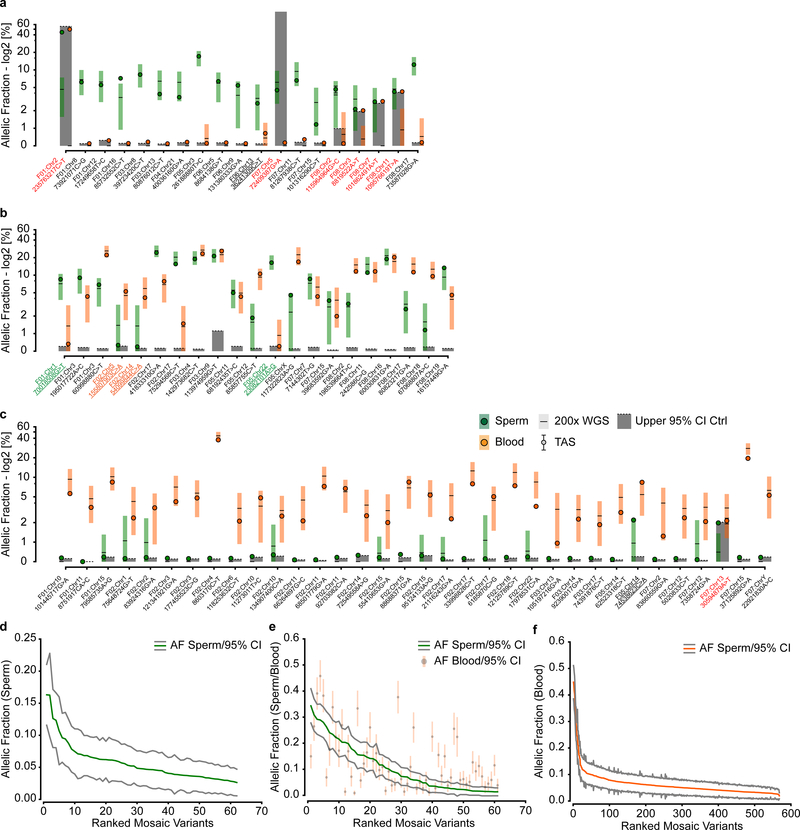
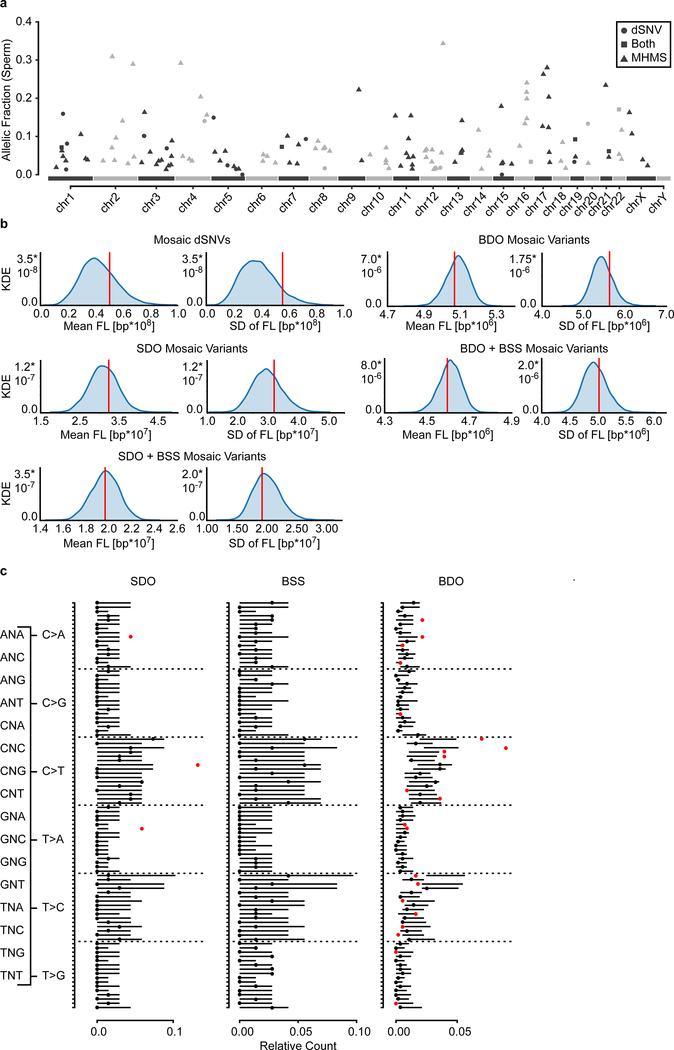
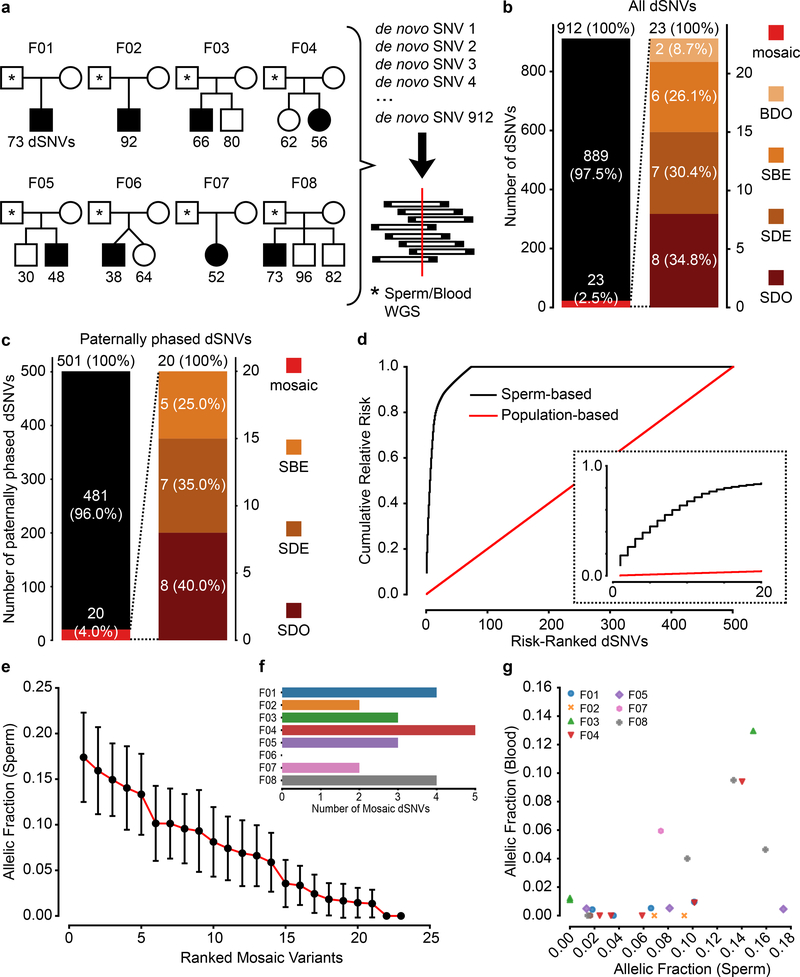
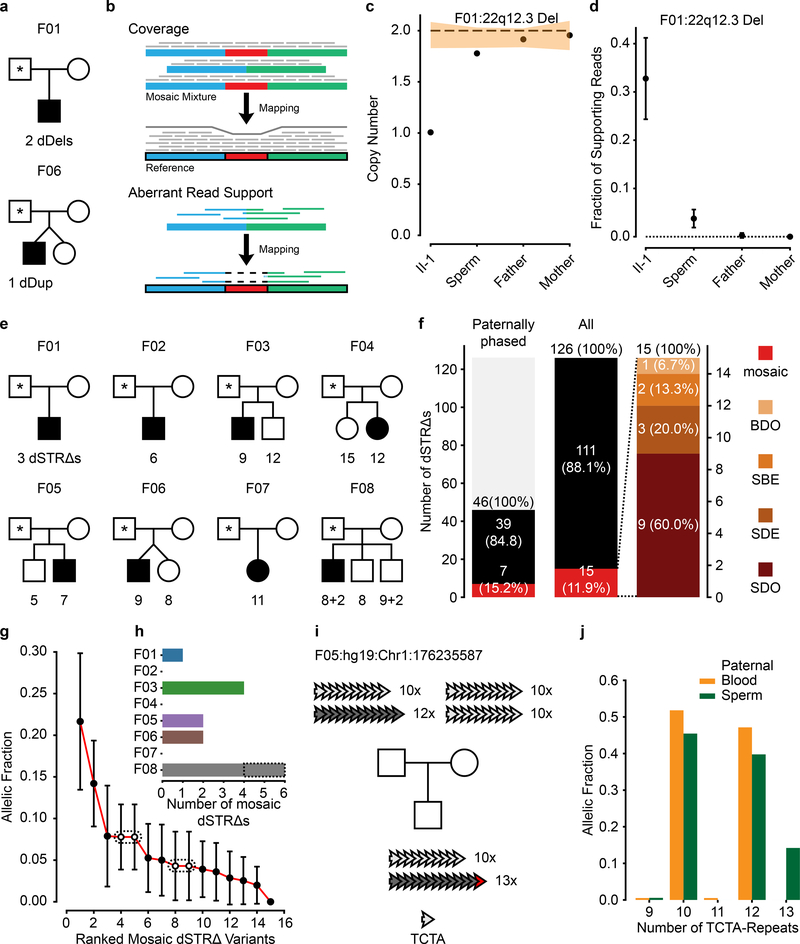
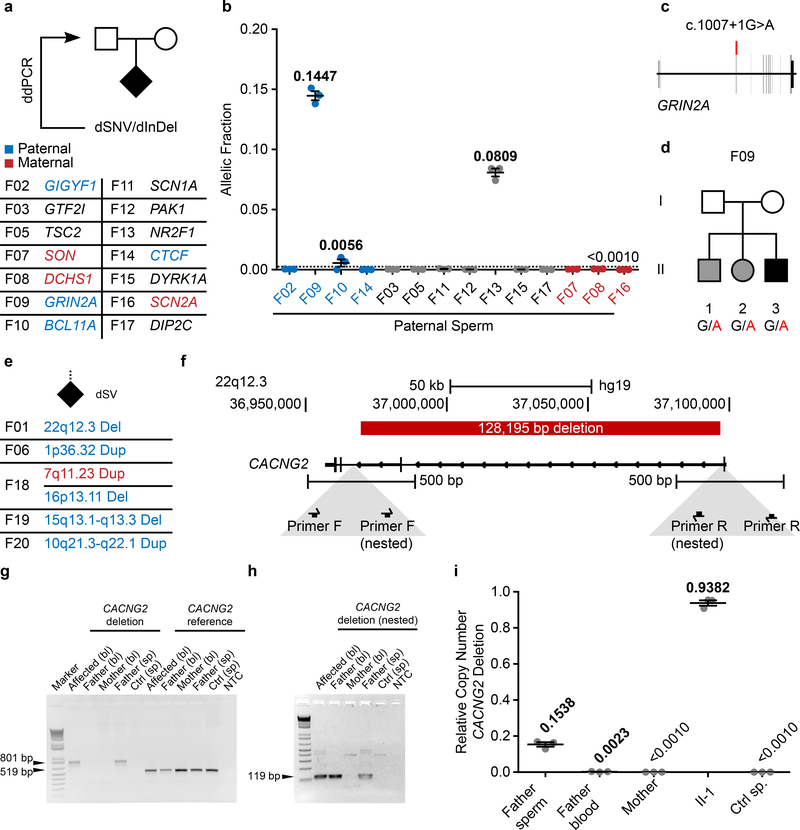
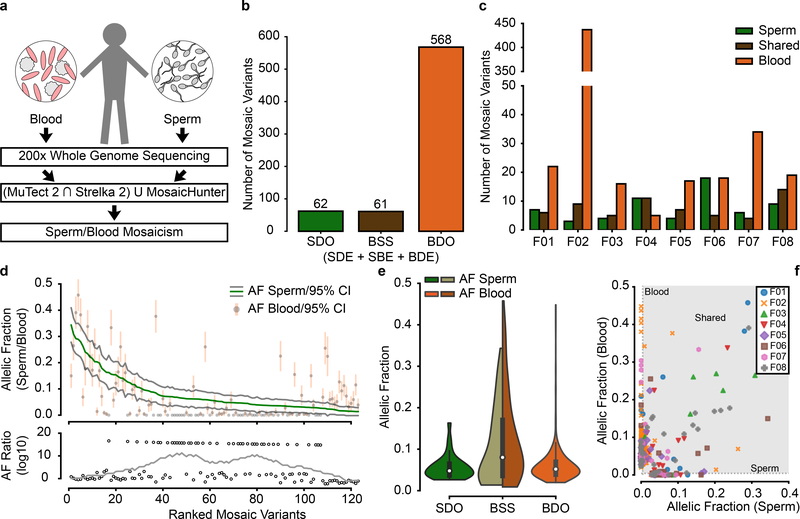
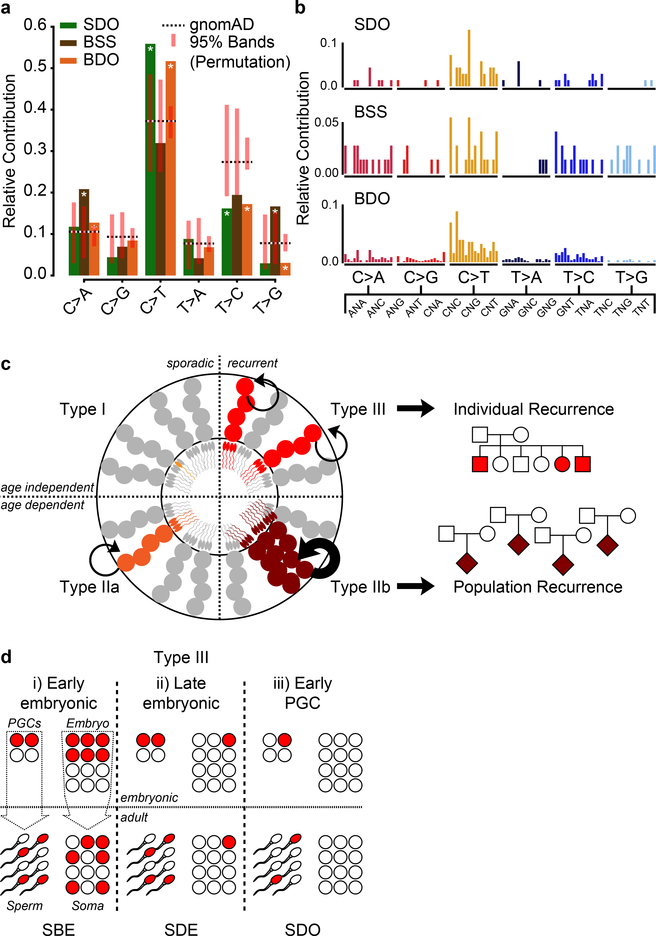
De novo mutations arising on the paternal chromosome make the largest known contribution to autism risk, and correlate with paternal age at the time of conception. The recurrence risk for autism spectrum disorders is substantial, leading many families to decline future pregnancies, but the potential impact of assessing parental gonadal mosaicism has not been considered. We measured sperm mosaicism using deep-whole-genome sequencing, for variants both present in an offspring and evident only in father's sperm, and identified single-nucleotide, structural and short tandem-repeat variants. We found that mosaicism quantification can stratify autism spectrum disorders recurrence risk due to de novo mutations into a vast majority with near 0% recurrence and a small fraction with a substantially higher and quantifiable risk, and we identify novel mosaic variants at risk for transmission to a future offspring. This suggests, therefore, that genetic counseling would benefit from the addition of sperm mosaicism assessment.


Figures

Extended Data Fig. 1
Extended Data Fig. 1. 200× WGS allows detection of mosaic variants down to 1% sensitivity.
a, Plot showing the fraction of the genome that is covered at a given depth for blood and sperm following WGS with a target coverage of 200×. b, Plot showing the insert size of the reads for blood and sperm. c, Nanopore long-read technology (average read length 5,349 bp) was able to assign parental haplotype to 601/832 dSNVs in 13 children. Out of these, 501 were paternal, resulting in α~4 as reported previously. d-e, Binomial models for the detection limit of mosaic variants. Plots show the probability of detecting a given variant at a specific allelic fraction (AF) when requiring at 3 alternate reads at different read-depths (d) or including a magnified inset for AF between 0.05 and 0 at 200× (e). f, Analysis of the power of detection assuming a minimum requirement of 3 reads at 200× sequencing. Plot shows the integrated probability of detection for the indicated tiers based on the curve seen in e. g-h, Plot of the fraction of detected variants (g) and the integrated detected fraction for the indicated AF ranges (h) of simulated data using Pysim. Results are from 10,000 variants simulated at 0.25, 0.20, 0.15, 0.10, 0.05, 0.02, and 0.01 AF. HaplotypeCaller was employed to detect variants as for data in Figure 1.
Extended Data Fig. 2
Extended Data Fig. 2. Orthogonal validation of a subset of mosaic dSNVs.
a, 18 variants that could be assessed by ultra-deep target amplicon sequencing (TAS): shown are the reported 200× WGS results (square with horizontal line) and the results from TAS (closed circle) (shown are estimated fraction ± binomial 95% CI). Sperm (left, green) and blood (right, orange). Dashed line and grey box: upper 95% CI of an unrelated control and the area beneath to visualize likely false positive variants. y-axis: allelic fraction (%) for a log2 transformation of the data. Red text: variants that were considered to have failed orthogonal validation: 15/18 variants were successfully confirmed. Underlined variants were confirmed, but likely annotated as the wrong class (all 5 are probably SDO rather than SDE). For all data points, the estimated fraction and CI are based on the fraction of mutant reads, see Supplementary Data 2 and 4. b, Allelic fraction (determined by ddPCR or WGS read counts) of the mutant allele with the highest allelic fraction in sperm (F05: Chr22:23082101A>G). Sperm and Blood indicate samples from the father, other samples (Blood/ddPCR) were derived from the mother, the child harboring the dSNV (II-2), or control (Ctrl) blood. Graph shows individual data points (experimental triplicates) and mean ± SEM for the ddPCR data.
Extended Data Fig. 3
Extended Data Fig. 3. Age correlation of all and mosaic dSNVs.
a, Plot showing the increase in dSNV number with paternal age at birth, as described previously,. Dashed line shows a regression curve demonstrating this dependence (n=14 trios, adjusted R2=0.526, P=0.0020). b, Plot showing the increase in dSNV number with paternal age at birth for paternal variants only. As expected, this correlation was stronger than for non-phased variants (n=13 trios, adjusted R2=0.736, P=0.000107). c-d, Plots showing correlation for paternal age and the number of mosaic variants or the mean AF in sperm. Paternal age/the number of mosaic variants (c; n=14 trios, adjusted R2=−0.048, P=0.536) and paternal age/mean AF in sperm (d; n=14 trios, adjusted R2=−0.047, P=0.463) did not show any significant correlation. Adjusted R2, coefficient of determination, and F-statistic nominal P-values are derived from a linear regression model through ordinary least squares. All graphs show individual data points, a regression line, and the 95% CI.
Extended Data Fig. 4
Extended Data Fig. 4. Mutational signature for non-mosaic and mosaic dSNVs.
a, Mutational signatures (6 categories) for non-mosaic and mosaic dSNVs, compared to the overall gnomAD signature and a permuted subset (n=1,000 permutations for n=889 (non-mosaic) and n=23 (mosaic) dSNVs; shown is the 95% band). Asterisks indicate observed signatures that lie outside the 95% band of the permuted variants.. Non-mosaic variants are largely reminiscent of the gnomAD signature (with the exception of a significant depletion of T>G). Mosaic variants exhibit some differences, but none reach significance due to the low number of available mutations. b, Mutational signatures (96 categories; trinucleotide environment for non-mosaic and mosaic dSNVs. c, Detailed view of the 96 mutational categories for non-mosaic and mosaic dSNVs, compared to the overall gnomAD signature and a permuted subset (n=1,000 permutations for n=889 (non-mosaic) and n=23 (mosaic) dSNVs; shown is the 95% band). Dots indicate the observed mutational signature (black: within 95% band; red: outside the 95% band).
Extended Data Fig. 5
Extended Data Fig. 5. Sperm mosaicism stratifies recurrence risk for dSV and dSTRΔ variants.
a-c,, Calculated copy number (a, c) and fraction of supporting reads (b) for the 6q16.1 deletion in F01 and The 1p36.32 duplication as indicated. Orange band in a and c: ±1 SD of the CN using similarly sized regions across the genome (n=1,000 random regions, see Methods). Plot in d shows the estimated fraction of supporting reads (estimated fraction ± binomial 95% CI; based on the fraction of mutant reads, see Supplementary Data 7). Together, these approaches suggest that these dSVs are not mosaic in paternal sperm. Note that the fraction of supporting reads could not be used for the duplication due to the repetitive elements flanking this SV. d, Copy number variant plot for the duplication in F06 for the Proband (40×), Father (200× both), and the mother (40×). Visualization was performed with the CNView tool (see Methods). e, Correlation of the number of dSTRΔs with paternal age at birth. Dashed line shows a regression curve (n=14 trios, adjusted R2=−0.058, P=0.598). Adjusted R2, coefficient of determination, and F-statistic nominal P-value are derived from a linear regression model through ordinary least squares. Graph shows individual data points, a regression line, and the 95% CI. f, Number of STR repeat units for non-mosaic dSTRΔs or those that are mosaic. No significant difference can be observed between the two groups (n=111 non-mosaic variants and n=15 mosaic variants; two-tailed Mann Whitney test; nominal P=0.5490). Boxplots show median and quartiles with outliers as well as individual values. g, Detailed analysis of the TCTA repeat numbers in paternal, maternal, and child’s blood at low sequencing depth. Results show a de novo 13× repeat in the child that is neither present in the father nor the mother. h, Sample reads showing the presence of a 10× and 13× allele in the child, a homozygous 10× allele in the mother, a 10× and a 12× allele in the father, and the presence of a mosaic 13× allele exclusively in paternal sperm.
Extended Data Fig. 6
Extended Data Fig. 6. Sperm mosaicism stratifies risk for pathogenic ASD mutations.
a-c AF (determined by ddPCR) of the mutant allele in paternal sperm (sperm) and maternal blood (mother) for the relevant dSNV in the 14 families. Part of this panel is also presented in Figure 3. Ctrl –an unrelated sperm or blood sample, as indicated, acting as control. Graphs show individual data points (experimental triplicates) and mean ± SEM. d, Sanger sequencing results of paternal sperm for the locus harboring the dSNV for each family. Confirming the ddPCR results, F09, F10, and F13 showed mosaicism at their respective positions. e, Sanger sequencing results showing the C>T conversion locus in GRIN2A in F09 for all family members. The mutation was absent in the saliva of both parents, but present as a heterozygous allele in all 3 children.
Extended Data Fig. 7
Extended Data Fig. 7. ddPCR assessment of pathogenic structural variants and recurrent sampling of pathogenic DNMs in F01, F09, and F13.
a-c, AF (determined by ddPCR) of the mutant alleles in F09 (a), F10 (b), and F13 (c). DNA tested was derived from paternal sperm (indicated as sp.) and the saliva (a and b; sal.) or blood (c, bl.) of the father, mother, or affected child. In addition, controls for sperm (sp) and blood (bl) are provided. d, AF (determined by ddPCR) comparing two biological replicates of paternal sperm for F01, F09, and F13. The samples showed comparable levels of AF over time for all three samples, however, F13 exhibited a minor, but statistically significant difference. ***P<0.001 (unpaired t-test, two-tailed, degrees of freedom=12). e-g, Relative copy number (determined by ddPCR) for the three indicated dSVs for blood-derived samples, labeled as SNV assays in Extended Data Figure 6. Note that there is no detectable abnormality in the paternal sperm copy number above noise level, suggesting absence of sperm mosaicism in these samples. h, Direct copy number quantification of the duplication by ddPCR. Samples as before. All graphs show individual data points (experimental triplicates except for Affected in g [experimental duplicate], and F01 and F13 in d [7 experimental replicates]) and mean ± SEM.
Extended Data Fig. 8
Extended Data Fig. 8. Limit of detection analysis for the unbiased analysis of gonadal mosaic SNVs.
a-d, Plots of the fraction of detected variants (a, c) and the integrated detected fraction for the indicated AF ranges (b, d) of simulated data using Pysim for the intersection of MuTect 2/Strelka 2 (a, b) and MosaicHunter (c, d). Results were from 10,000 variants simulated at 0.25, 0.20, 0.15, 0.10, 0.05, 0.02, and 0.01 AF. This was the same data set as used in Extended Data Figure 1. The MuTect 2/Strelka 2 and MosaicHunter pipelines were employed with the same filters as for the data in Figure 4.
Extended Data Fig. 9
Extended Data Fig. 9. Mosaic SNVs identified by unbiased analysis have a high validation rate and their AF differs depending on their origin.
a-c, 74 variants that could be assessed by ultra-deep target amplicon sequencing (TAS): shown are the reported 200× WGS results (square with horizontal line) and the results from TAS (closed circle) (shown are estimated fraction ± binomial 95% CI). Sperm (left, green) and blood (right, orange). Dashed line and grey box: upper 95% CI of an unrelated control and the area beneath to visualize likely false positive variants. y-axis: allelic fraction (%) for a log2 transformation of the data. Plots are split by the three categories: SDO (a), BSS (b), and BDO (c). Red text denotes variants that were considered to have failed orthogonal validation: 13/19 (a), 21/21 (b), and 33/34 (c) were successfully confirmed. Underlined variants were confirmed, but likely annotated as the wrong class (i.e. they are actually BSS for SDO and BDO variants in a and c, or are SDO (green text) or BDO (orange text) for BSS variants in c). For all data points, the estimated fraction and CI are based on the fraction of mutant reads, see Supplementary Data 2 and 8. d-f, Ranked plot of the estimated sperm and blood AF with 95% confidence intervals (estimated fraction ± binomial CI; based on the fraction of mutant reads, see Supplementary Data 8) for all variants detected in the three categories. SDO (d) and BDO (f) variants both show curves that are reminiscent of exponential decay, consistent with an increase of the number of mutations with expansion of the progenitor pool at a constant mutational rate. However, BSS (e) mosaicism for the first 40 variants appears to be more linear, suggesting that mutation rates for early division might be higher than those for later. This is consistent with previous models that estimated an elevated mutation rate in early embryonic development.
Extended Data Fig. 10
Extended Data Fig. 10. Mosaic variants do not exhibit clustering but differ in their mutational signatures depending on their origin.
a, Plot of the chromosomal location for each of the mosaic variants and their allelic fraction found in sperm from F01–08. Circles, triangles, and squares denote variants found to be mosaic by the dSNV approach, by the unbiased approach, or by both, respectively. b, Permutation simulations (n=10,000 simulations of n=23 mosaic dSNVs, n=62 SDO mosaics, n=123 SDO+BSS mosaics, n=568 BDO mosaics, and n=629 BDO+BSS mosaics) of variant locations to obtain mean and SD of broken stick fragment lengths. Vertical lines mark the observed value from mosaic dSNVs and mosaic variants from the indicated classes. These simulations illustrate that the observed distributions of variants along the chromosomes (as visualized in A for those that were mosaic in sperm) were within expectation. c, Detailed view of the 96 mutational categories for SDO, shared, and BDO mosaic variants,, compared to the overall gnomAD signature and a permuted subset (n=1,000 permutations for n=68 (SDO), 72 (BSS), and 568 (BDO) gnomAD SNVs; shown is the 95% band). Dots indicate the observed mutational signature (black: within 95% band; red: outside the 95% band).
Figure 1.
Figure 1.. Recurrence risk stratification and mosaicism rates of 912 dSNVs is different in sperm compared with blood.
a, 8 Nuclear families used for 200× WGS analysis of father’s sperm and blood. dSNVs in offspring were evaluated in paternal sperm and blood using WGS data. Filled symbols: autism spectrum disorder (ASD) diagnosis. b, dSNV assessment in 8 families identified 912 dSNVs, of which 23 (2.5%) were detected in father’s sperm or blood with ≥3 mutant reads; 34.8% of these were sperm detectable only (SDO), 30.4% were sperm detectable enriched (SDE; α<3), 26.1% were present at equal AF in sperm and blood (sperm blood equal; SBE), and 8.7% were blood detectable only (BDO). c, Relative number of paternal dSNVs that showed evidence (≥3 reads) of mosaicism in blood, sperm, or both. d, Contribution to the cumulative relative recurrence risk for all dSNVs. Risk derived from sperm mosaicism (≥1 alternate read; black), assuming equal risk for all variants (red). Dashed box shows only the first 20 identified paternally phased mosaic variants. e, Ranked plot of the estimated sperm AF (estimated fraction ± binomial 95% CI; based on the fraction of mutant reads, see Supplementary Data 2) for all mosaic variants. f, Number of mosaic variants found in each father’s sperm. F04 had the most at 5 and F06 had none detected. g, Sperm vs. blood AF for all detected mosaic variant coded by family. Most sperm mosaic AFs <8% were either SDO or SDE, whereas most mosaic variants >8% were also detected in blood at similar AFs.
Figure 2.
Figure 2.. Risk stratification can be applied to other classes of DNMs.
a, Pedigrees for F01 and F06 and detected dSVs. b, Approaches to detect dSV gonadal mosaicism: coverage and aberrant read support. c, Calculated copy number (CN) for the 22q12.3 deletion in F01. Dashed line: expected CN (2 copies). Orange band: ±1 SD of the CN using similarly sized regions across the genome (n=1,000 random regions, see Methods). d, Estimated fraction of supporting reads (estimated fraction ± binomial 95% CI; based on the fraction of mutant reads, see Supplementary Data 7), for the 22q12.3 deletion in F01. e, 8 nuclear families and the detected de novo short tandem repeat changes (dSTRΔs) for each child (total of 126 variants, two of which are recurrent in F08). f, Gonadal mosaicism assessment for 126 dSTRΔs in father’s sperm from 8 families. g, Ranked plot of the estimated sperm AF and 95% confidence intervals (estimated fraction ± binomial CI; based on the fraction of mutant reads, see Supplementary Data 7) for all mosaic variants. Dashes: recurrent variants that suggest parental mosaicism. h, Number of mosaic dSTRΔs found in each father. i, Exemplary dSTRΔ in F05, where the child had an expansion of a tetranucleotide repeat (TCTA) on the paternal haplotype (12x to 13x) based upon bulk sequencing. j, TCTA repeat AFs from 200× WGS data for paternal blood and sperm demonstrated MGM for the 13x variant.
Figure 3.
Figure 3.. Pathogenic ASD DNMs benefit from risk stratification through sperm sequencing.
a, 14 ASD families with a causative dSNV/de novo insertion/deletion (dInDel) in the child and phased, where possible, to the parental haplotype (blue: paternal; red: maternal). Gonadal mosaicism was assessed by ddPCR for each dSNV/dInDel. b, AF (determined by ddPCR) of the mutant alleles in paternal sperm (n=3 experimental replicates for each sample, shown are mean ± SEM and individual values). c, Schematic of GRIN2A and the PGM variant found in F09. d, Pedigree of family F09. Black: ASD; grey: epilepsy with ADHD symptoms. All three children shared the GRIN2A G>A conversion. e, 5 ASD families with a causative dSV. Haplotype was determined from the WGS data as paternal (blue) or maternal (red). Only the 22q12.3 deletion in F01 showed gonadal mosaicism, as also described in Fig. 2c–d. f, Genomic CACNG2 locus (22q12.3) and the pathogenic 128,195 bp deletion in F01. Below: primers for nested PCR for deletion detection. g, Agarose gel for the primary PCR products from blood (bl) and sperm (sp). CACNG2 deletion: 801 bp band detected in DNA from affected and paternal sperm; 519 bp reference band detected in all samples as a control. h, Agarose gel for nested PCR products (arranged as in g). g and h show representative gels from two independent replicates. i, ddPCR showed CN mosaicism at 0.1538 copies or~7.5% AF in sperm and 0.0023 copies or ~0.1% in blood from father, 0.9382 copies or ~47.0% AF in blood from the affected individual, undetectable in samples from mother and control (n=3 experimental replicates for each sample, shown are mean ± SEM and individual values).
Figure 4.
Figure 4.. Unbiased analysis of sperm mosaicism reveals that sperm sequencing reclassifies risk for ~50% of mosaic variants.
a, Blood and sperm from 8 fathers was subjected to 200× whole genome sequencing (WGS) followed by detection of mosaicism using the intersection of MuTect 2 and Strelka 2 and union with MosaicHunter. b-c, Total number of mosaic variants (b) and those found in each father (c) that were SDO, blood/sperm shared (BSS; includes SDE, SBE, and blood detectable enriched - BDE), or BDO. F02 showed a substantially increased number of BDO variants, most likely related to clonal hematopoiesis/collapse due to his advanced age at sampling (70 years). d, Ranked plot of the estimated sperm and blood AF with 95% confidence intervals (estimated fraction ± binomial CI; based on the fraction of mutant reads, see Supplementary Data 8) for all 123 gonadal mosaic variants that were detected as mosaic in sperm. Lower plot shows the log10 transformed ratio of sperm and blood AFs (0 replaced with 1*10−8) and the rolling average over 20 data points to display the local trend. e, Violin plots with inner box plots (showing median and quartiles) of AFs of all three types of variants as indicated (n=62 SDO variants, 61 BSS, and 568 BDO). f, Sperm vs. blood AF for all detected mosaic variant coded by individual. BDO and BSS mosaic variants reached higher AF than those that were SDO. Grey area denotes region of variants that are detectable in both sperm and blood.
Figure 5.
Figure 5.. Sperm mosaic variant mutation patterns support a developmental origin.
a, Mutational signatures (6 categories) for the three classes of mosaicism, compared to the overall gnomAD signature and a permuted subset (n=1,000 permutations for n=68 (SDO), 72 (BSS), and 568 (BDO) gnomAD SNVs; shown is the 95% band). Asterisks indicate observed signatures that lie outside the 95% band of the permuted variants. SDO and BDO showed signatures that differed from gnomAD and the BSS variants; BSS variants likewise showed a mutational signature that was distinct from the gnomAD population. b, Mutational signatures (96 categories; trinucleotide environment) of the three classes of mosaicism. c, Model for four types of PGM from testis tubule cross-section, with spermatogonial stem cells (SSC) at perimeter, and mature sperm at lumen. Type I and IIa PGM occurs in a single sperm (I) or SSC (IIa), thus contributing to only a fraction of total sperm and associate with non-recurrent disease. Type IIb and III mutations lead to selective growth advantage and elevate population-level recurrence risk (IIb), or occur during paternal embryogenesis, leading to multiple independent mutant SSCs and associate with mutational recurrence (III). d, Type III PGM mosaicism occur (i) during early paternal embryogenesis, seeding sperm and somal progenitors at equally high AFs, (ii) during late embryogenesis, seeding stochastically at variable AFs between tissues, or (iii) in early primordial germ cell (PGC) differentiation, seeding only gonads. Note: PGCs are the early embryonic progenitors of SSCs.

Comment in

References

    1. Iossifov I et al. The contribution of de novo coding mutations to autism spectrum disorder. Nature 515, 216–221, doi:10.1038/nature13908 (2014). - DOI - PMC - PubMed
    1. Turner TN et al. Genomic Patterns of De Novo Mutation in Simplex Autism. Cell 171, 710–722 e712, doi:10.1016/j.cell.2017.08.047 (2017). - DOI - PMC - PubMed
    1. O’Roak BJ et al. Sporadic autism exomes reveal a highly interconnected protein network of de novo mutations. Nature 485, 246–250, doi:10.1038/nature10989 (2012). - DOI - PMC - PubMed
    1. Neale BM et al. Patterns and rates of exonic de novo mutations in autism spectrum disorders. Nature 485, 242–245, doi:10.1038/nature11011 (2012). - DOI - PMC - PubMed
    1. Kong A et al. Rate of de novo mutations and the importance of father’s age to disease risk. Nature 488, 471–475, doi:10.1038/nature11396 (2012). - DOI - PMC - PubMed

Publication types