. 2020 Apr 1;130(4):1635-1652.
doi: 10.1172/JCI129497.

HPV16 drives cancer immune escape via NLRX1-mediated degradation of STING

Affiliations

HPV16 drives cancer immune escape via NLRX1-mediated degradation of STING

Xiaobo Luo et al. J Clin Invest. .

Abstract

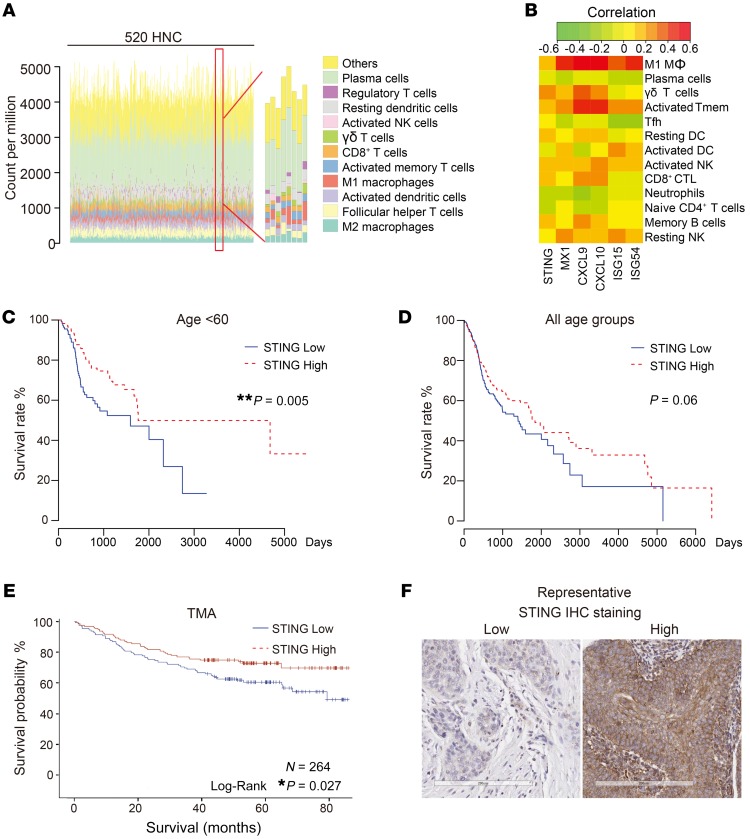
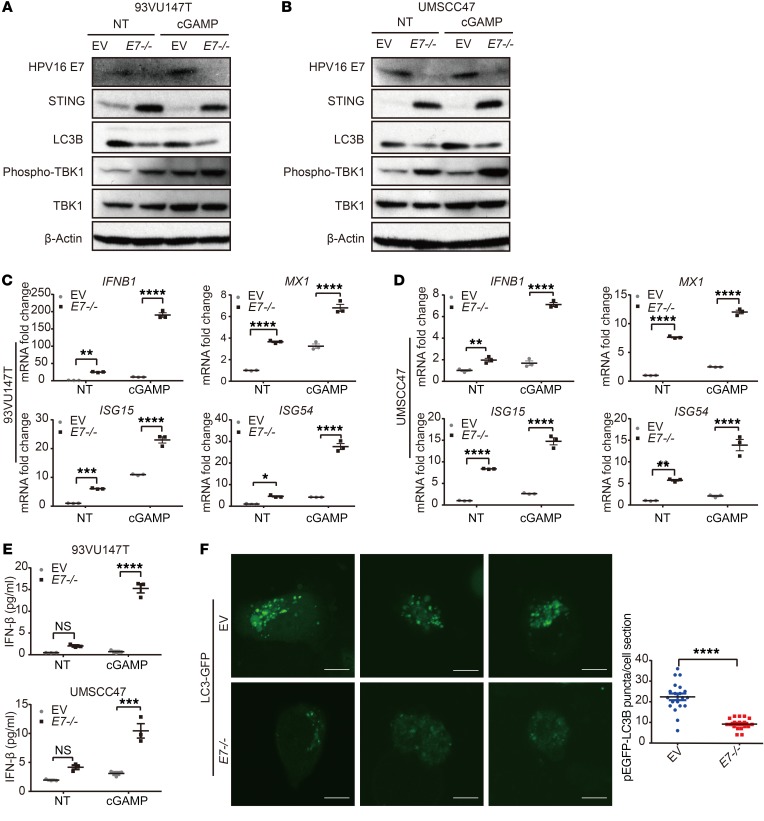
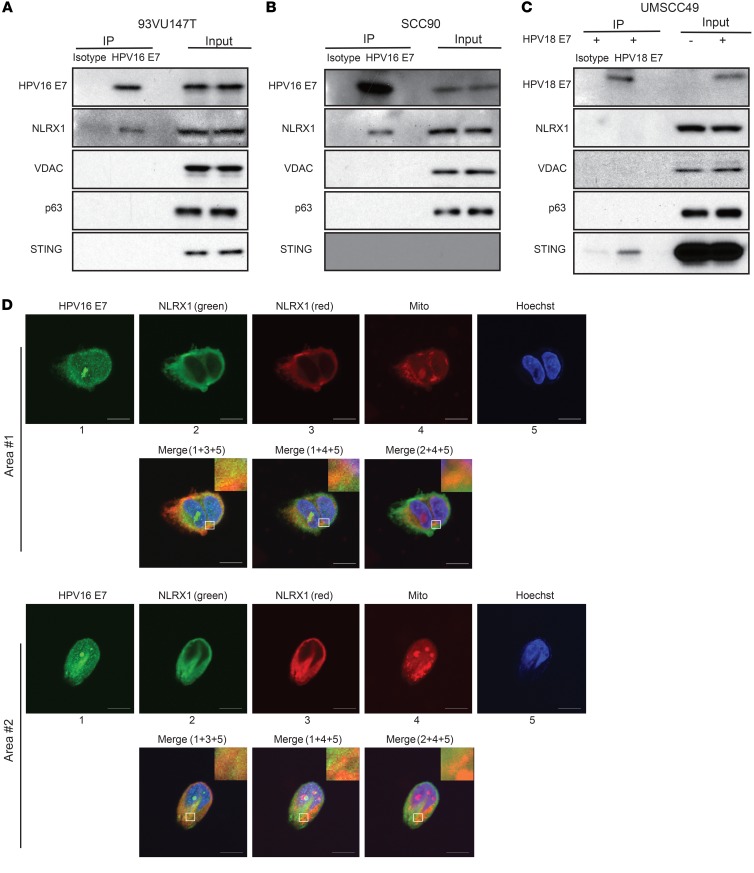
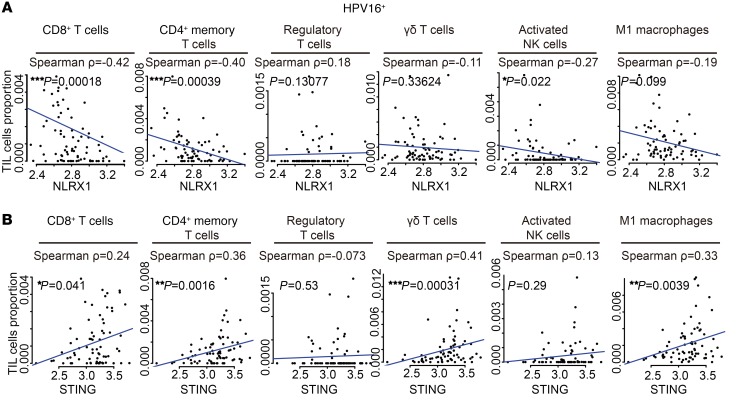
The incidence of human papillomavirus-positive (HPV+) head and neck squamous cell carcinoma (HNSCC) has surpassed that of cervical cancer and is projected to increase rapidly until 2060. The coevolution of HPV with transforming epithelial cells leads to the shutdown of host immune detection. Targeting proximal viral nucleic acid-sensing machinery is an evolutionarily conserved strategy among viruses to enable immune evasion. However, E7 from the dominant HPV subtype 16 in HNSCC shares low homology with HPV18 E7, which was shown to inhibit the STING DNA-sensing pathway. The mechanisms by which HPV16 suppresses STING remain unknown. Recently, we characterized the role of the STING/type I interferon (IFN-I) pathway in maintaining immunogenicity of HNSCC in mouse models. Here we extended those findings into the clinical domain using tissue microarrays and machine learning-enhanced profiling of STING signatures with immune subsets. We additionally showed that HPV16 E7 uses mechanisms distinct from those used by HPV18 E7 to antagonize the STING pathway. We identified NLRX1 as a critical intermediary partner to facilitate HPV16 E7-potentiated STING turnover. The depletion of NLRX1 resulted in significantly improved IFN-I-dependent T cell infiltration profiles and tumor control. Overall, we discovered a unique HPV16 viral strategy to thwart host innate immune detection that can be further exploited to restore cancer immunogenicity.

Keywords: Autophagy; Head and neck cancer; Immunology; Innate immunity; Oncology.


Conflict of interest statement

Conflict of interest: The authors have declared that no conflict of interest exists.

Figures

Figure 1
Figure 1. STING correlates with enhanced infiltration of Th1/Tc1-skewed immune subsets in HNSCC and improved patient survival.
(A) Using a machine learning pipeline, we deconvolved tumor-infiltrating lymphocyte (TIL) compositions of 520 human HNSCC specimens in the TCGA database. Each color represents an immune cell subset, and each vertical line represents 1 specimen. (B) The relationship between expression levels of IFN-I signatures and the percentages of TIL subsets was analyzed by Spearman’s rank-order correlation. Positive values indicate positive associations, and negative values indicate inverse associations. (C and D) Kaplan-Meier overall survival analysis was performed based on STING expression in TCGA, presented stratified by age or across all age groups. (E) A tissue microarray (TMA) consisting of 297 HNSCCs with 3 cores for each specimen was stained with STING. Tumor parenchyma and tumor microenvironment (TME) were defined and scored independently using Aperio ImageScope. STING staining scores were available for 264 HNSCC patients. Kaplan-Meier survival curves were compared using a log-rank test. *P < 0.05; **P < 0.01. (F) Representative IHC staining for STING is shown (scale bar: 200 μm).
Figure 2
Figure 2. HPV16 E7 inhibits STING-induced transcription of IFN-I target genes in HNSCC cells.
(AI) HPV+ 93VU147T (AC), HPV+ UMSCC47 (DF), and HPV FaDu (GI) cells were transfected with 1.5 μg/mL STING expression plasmid for 24 hours with or without transfection of 1.5 μg/mL HPV16 E7 plasmid. The mRNA levels of IFNB1, CXCL10, and ISG54 were determined by qPCR. Values displayed indicate the mean ± SEM of 3 biological replicates. The comparisons were made by 2-way ANOVA with Šidák’s multiple-comparisons test (**P < 0.01, ***P < 0.001, ****P < 0.0001). Experiments were performed twice. NT, no treatment. (JL) 93VU147T (J), UMSCC47 (K), and FaDu (L) cells were transfected with 1.5 μg/mL STING expression plasmid for 24 hours in the absence or presence of 1.5 μg/mL HPV16 E7 plasmid in 3 biological replicate wells. The levels of secreted IFN-β were quantified using ELISA. The comparisons were made by 2-way ANOVA followed by Šidák’s post-test (*P < 0.05, **P < 0.01, ***P < 0.001, ****P < 0.0001). Experiments were performed twice.
Figure 3
Figure 3. HPV16 E7 attenuates STING-induced innate immune signaling.
(A) 93VU147T cells were transduced with empty vector (EV) control or shNLRX1-expressing lentiviruses to produce stable control and NLRX1-deficient cell lines, which were then transfected with 1.0 μg/mL HA-tagged STING plasmid and incubated for 16 hours. STING protein complexes were immunoprecipitated using anti-HA affinity matrix followed by immunoblotting for the indicated potential binding partners. Experiments were performed 3 times, and representative blots are shown. (B) The protein lysates of HPV+ 93VU147T, UDSCC2, UMSCC47, and SCC90 as well as HPV FaDu and PCI-13 cells were harvested on ice and separated by SDS-PAGE. Endogenous expression levels of HPV16 E7 and STING were then detected with respective antibodies. (CE) 93VU147T, UMSCC47, and FaDu cells were transfected with 1.0 μg/mL STING plasmid and incubated for 24 hours with or without introduction of 1.5 μg/mL HPV16 E7 plasmid. Cell lysates were immunoblotted with HPV16 E7, STING, and markers for IFN-I activation. Densitometry analysis was performed using ImageJ and is shown in the lower panels. Comparisons between 2 groups were made by 2-tailed unpaired t test, while comparisons between multiple groups were conducted by 1-way ANOVA test followed by Tukey’s multiple-comparisons test. Results displayed represent the mean ± SEM (*P < 0.05, **P < 0.01, ***P < 0.001, ****P < 0.0001). Each immunoblot represents 3 biological repeats, and representative blotting results are shown.
Figure 4
Figure 4. HPV16 E7 promotes autophagy-dependent degradation of STING.
(AC) 93VU147T, UMSCC47, and FaDu cells were transfected with 1.5 μg/mL HPV16 E7 for 24 hours, 93VU147T alone was simultaneously transfected with STING, and immunoblotting was performed against HPV16 E7, STING, and LC3B. Each immunoblot represents 3 biological repeats, and representative blotting results are displayed. (DF) 93VU147T, UMSCC47, and FaDu cells were transfected with 1.5 μg/mL HPV16 E7 and incubated for 24 hours. 93VU147T cells were simultaneously transfected with STING. Half of the groups were then treated with 200 nM bafilomycin A1 (BafA1) and incubated for 8 hours. Cell lysates were immunoblotted for HPV16 E7, STING, and LC3B. Representative blots are shown and represent 3 independent repeats. Densitometric quantitation of STING/β-actin was performed using ImageJ and is shown in the lower panels. Comparisons between multiple groups were determined by 1-way ANOVA test followed by Tukey’s multiple-comparisons test. Results represent mean ± SEM (****P < 0.0001).
Figure 5
Figure 5. Deletion of HPV16 E7 restores IFN-I signaling along with reduced autophagic activity.
(A and B) 93VU147T and UMSCC47 cells were transduced with lentivirus of CRISPR/Cas9 targeting E7, and the EV was considered as control. The established cell lines were transfected with STING agonist (cGAMP) or mock for 16 hours, and cell lysates were subjected to immunoblotting for HPV16 E7, STING, LC3B, phospho-TBK1, and TBK1. Representative blots of 2 repeats are presented. (C and D) 93VU147T and UMSCC47 cells with or without the expression of E7 were transfected with cGAMP for 16 hours, and total RNA was isolated. qPCR was then performed to quantitate the mRNA levels of indicated IFN-I signature genes. Values represent mean ± SEM of 3 biological replicates. Comparisons were made by 2-way ANOVA followed by Šidák’s post-test (*P < 0.05, **P < 0.01, ***P < 0.001, ****P < 0.0001). Experiments were performed 3 times. (E) 93VU147T and UMSCC47 cells with or without the expression of HPV16 E7 were transfected with cGAMP for 16 hours, and the protein levels of IFN-β from supernatant were determined by ELISA. Comparisons were made by 2-way ANOVA with Šidák’s post-test (***P < 0.001, ****P < 0.0001). Experiments were performed twice. (F) Left panel: Laser confocal analysis was conducted in EV or HPV16 E7–/– UMSCC47 cells, which were transfected with pEGFP-LC3B for 48 hours before the images were captured. Scale bars: 10 μm. Right panel: Quantitation of EGFP-LC3 puncta in each cell section of both groups was conducted. Comparisons between the 2 sets were completed using an unpaired 2-tailed t test. Values represent mean ± SEM (****P < 0.0001). n = 20 cell sections from 2 repeats.
Figure 6
Figure 6. HPV16 E7 specifically interacts with NLRX1.
(A and B) 93VU147T and SCC90 cells were lysed, precleared, and incubated with an isotype control antibody and anti-HPV16 E7. Immunoprecipitation was performed using Protein A/G UltraLink Resin, and immunoprecipitated protein complexes were washed before SDS-PAGE. Immunoblotting of NLRX1 and specificity control proteins was carried out. (C) The whole-cell lysates of HPV18 E7–expressing UMSCC49 cells were precleared and incubated with IgG2a isotype control or anti–HPV18 E7, followed by incubation with Protein A/G UltraLink Resin for 2 hours at room temperature. Immunoprecipitated protein complexes were washed and subjected to SDS-PAGE. Immunoblotting of STING and specificity control proteins was performed. Experiments were performed 3 times, and representative results are shown. (D) 93VU147T cells were stained with MitoTracker, followed by fixation, permeabilization, and staining with NLRX1 and HPV16 E7. Nuclei were counterstained with Hoechst. Representative images and colocalization overlay are shown (scale bars: 10 μm). Experiments were performed twice.
Figure 7
Figure 7. NLRX1 potentiates autophagy-mediated inhibition of STING/IFN-I signaling in HPV16+ HNSCC cells.
(A) Cell lysates of 4 HPV+ HNSCC cell lines were immunoblotted for NLRX1, HPV16 E7, STING, and β-actin. (BD) UMSCC47, 93VU147T, and SCC90 cells were transduced with lentiviruses carrying an empty vector (EV) control construct or a construct expressing NLRX1-targeted shRNA. Stable cell lines were generated through puromycin selection. 1.0 μg/mL EV or 1.0 μg/mL STING plasmid was then introduced into 93VU147T and SCC90 cells and incubated for 24 hours. Cell lysates were separated by SDS-PAGE and immunoblotted for the indicated proteins. Immunoblots were performed twice, and representative blots are shown. (E and F) EV control or NLRX1-deficient 93VU147T and SCC90 cells were stimulated by 1.0 μg/mL STING for 16 hours, and qPCR was performed to determine the mRNA levels of IFNB1, ISG15, CXCL9, and CXCL10. Values represent mean ± SEM of 3 biological replicates. The comparisons were made by 2-way ANOVA with Šidák’s multiple-comparisons test (**P < 0.01, ***P < 0.001, ****P < 0.0001). (G) Control and shNLRX1 93VU147T and SCC90 cells were transfected with 1.0 μg/mL STING plasmid and incubated for 16 hours. Cell lysates were then subjected to immunoblotting for markers of IFN-I activation. Immunoblots represent 2 independent repeats.
Figure 8
Figure 8. NLRX1 in cancer cells inhibits STING signaling in vivo and excludes functional effectors from TME.
(A) Control and shNLRX1 MOC2-E6/E7 cells were stimulated by 1.0 μg/mL poly(dA:dT) for 16 hours, and qPCR was performed to quantitate the mRNA levels of indicated IFN-I signature genes. Experiments were performed 3 times. Comparisons between 2 groups were made using a 2-tailed unpaired t test (**P < 0.01, ****P < 0.0001). (B) Control and NLRX1-deficient MOC2-E6/E7 cells were transfected with 1.0 μg/mL expression plasmid encoding murine STING and incubated for 16 hours. Cell lysates were immunoblotted against the indicated markers. Immunoblotting results represent 2 independent repeats. (C) The proliferation of EV control and shNLRX1 MOC2-E6/E7 cells was measured by an alamarBlue assay. Each group included 5 replicate wells. Experiments were performed twice. (D) One million EV control or NLRX1-deficient MOC2-E6/E7 cells were implanted subcutaneously in the right flank of C57BL/6 hosts. Tumor measurements were performed every 2–3 days. Tumor burden was compared using the generalized estimating equations model (n = 8 in each group; *P < 0.05). In vivo experiments were performed 3 times with n = 19 total in each group. A representative set is shown. (E) Total RNA was isolated from 1 representative set of tumors and subjected to qPCR. (F) After harvesting of tumors, TILs of 1 representative set were isolated and analyzed by flow cytometry (n = 8 in control group, n = 4 in shNLRX1 group due to tumor rejection). (G) Lymphocytes were isolated from draining lymph nodes of 1 representative set and assessed by flow cytometry (n = 5 in each group). Comparisons between 2 groups from EG were made using a 2-tailed unpaired t test (*P < 0.05, **P < 0.01). Quantifications indicate the mean ± SEM. Results represent 3 independent experiments.
Figure 9
Figure 9. NLRX1-potentiated tumor immune escape is IFN-I–dependent.
(A) C57BL/6 hosts were given 0.5 mg of anti-CD8 or PBS intraperitoneally daily for 3 days before the tumor implantation and then twice per week for 2 weeks. The overall tumor burden was compared using the generalized estimating equations model (n = 7 in each group; *P < 0.05). (B) Tumors were harvested and total RNA isolated for qPCR detection of the indicated STING signature genes. Values represent mean ± SEM. Comparisons between groups were assessed using an unpaired t test. (C) One million EV control or shNLRX1 MOC2-E6/E7 cells were inoculated subcutaneously in the right flank of Rag1–/– mice. Tumors were monitored and compared as described above (n = 6 in each group). (D) After euthanasia, tumors were harvested and total RNA was isolated. qPCR was conducted to quantify the mRNA levels of indicated genes. Values represent mean ± SEM. Comparisons between groups were assessed using an unpaired t test. (E) One million EV control or shNLRX1 MOC2-E6/E7 cells were inoculated subcutaneously in the right flank of Ifnar1–/– mice (n = 5 in control group, n = 6 in shNLRX1 group). Tumor growth was monitored and compared as described above. Experiments were performed twice, and 1 representative set is shown. (F) After euthanasia, all tumors were harvested and total RNA isolated for qPCR analysis. Values represent mean ± SEM. Comparisons between groups were assessed using an unpaired t test.
Figure 10
Figure 10. NLRX1 is negatively correlated with antitumor immune subsets in HPV+ HNSCC specimens.
Spearman’s correlation analysis was performed to assess the relationship between the expression levels of NLRX1 (A) or STING (B) among 78 HPV16+ HNSCC specimens in the TCGA database and the frequencies of major TIL subsets; Spearman’s correlation coefficients and P values are indicated in each panel. Each dot represents 1 HPV16+ HNSCC specimen. This figure relates to Supplemental Figure 9.

References

    1. Secombes CJ, Zou J. Evolution of interferons and interferon receptors. Front Immunol. 2017;8:209. - PMC - PubMed
    1. Doehle BP, Chang K, Rustagi A, McNevin J, McElrath MJ, Gale M. Vpu mediates depletion of interferon regulatory factor 3 during HIV infection by a lysosome-dependent mechanism. J Virol. 2012;86(16):8367–8374. doi: 10.1128/JVI.00423-12. - DOI - PMC - PubMed
    1. Unterholzner L, et al. Vaccinia virus protein C6 is a virulence factor that binds TBK-1 adaptor proteins and inhibits activation of IRF3 and IRF7. PLoS Pathog. 2011;7(9):e1002247. doi: 10.1371/journal.ppat.1002247. - DOI - PMC - PubMed
    1. Ma Z, Ni G, Damania B. Innate sensing of DNA virus genomes. Annu Rev Virol. 2018;5(1):341–362. doi: 10.1146/annurev-virology-092917-043244. - DOI - PMC - PubMed
    1. Gillison ML, Chaturvedi AK, Anderson WF, Fakhry C. Epidemiology of human papillomavirus-positive head and neck squamous cell carcinoma. J Clin Oncol. 2015;33(29):3235–3242. doi: 10.1200/JCO.2015.61.6995. - DOI - PMC - PubMed

Publication types

MeSH terms