Comparative Study
. 2019 Dec 24;20(1):298.
doi: 10.1186/s13059-019-1919-5.

The somatic mutation landscape of the human body

Affiliations
Comparative Study

The somatic mutation landscape of the human body

Pablo E García-Nieto et al. Genome Biol. .

Abstract

Background: Somatic mutations in healthy tissues contribute to aging, neurodegeneration, and cancer initiation, yet they remain largely uncharacterized.

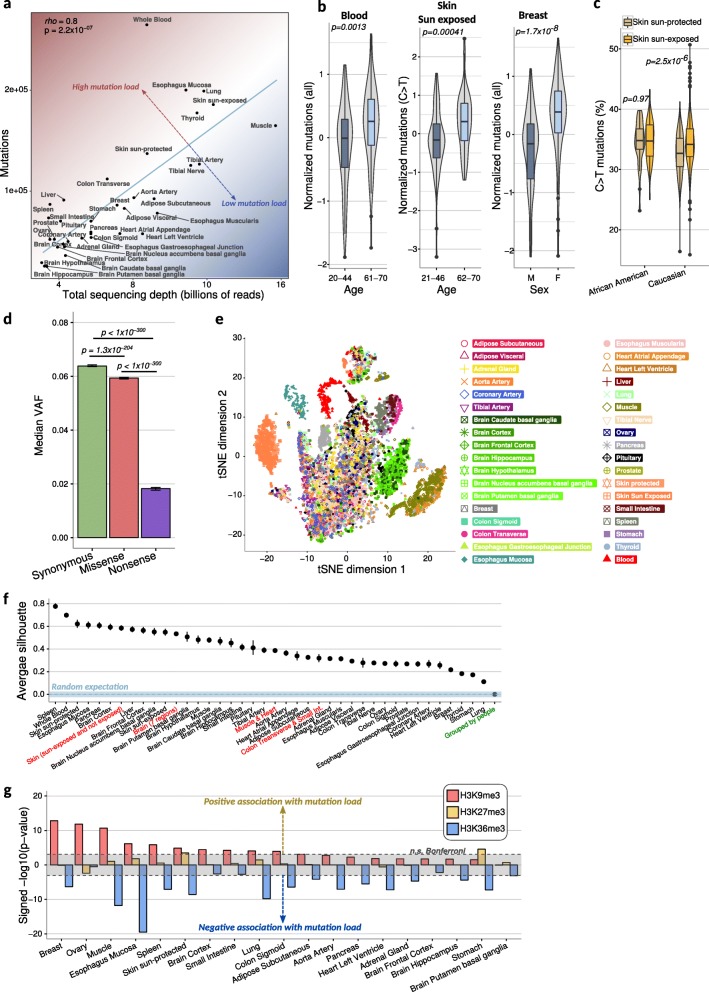
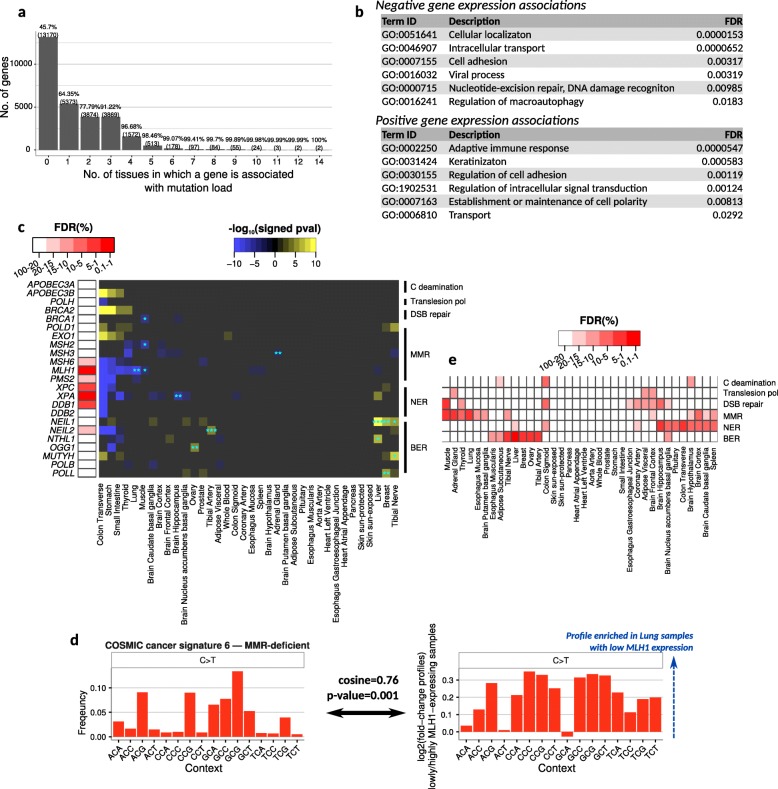
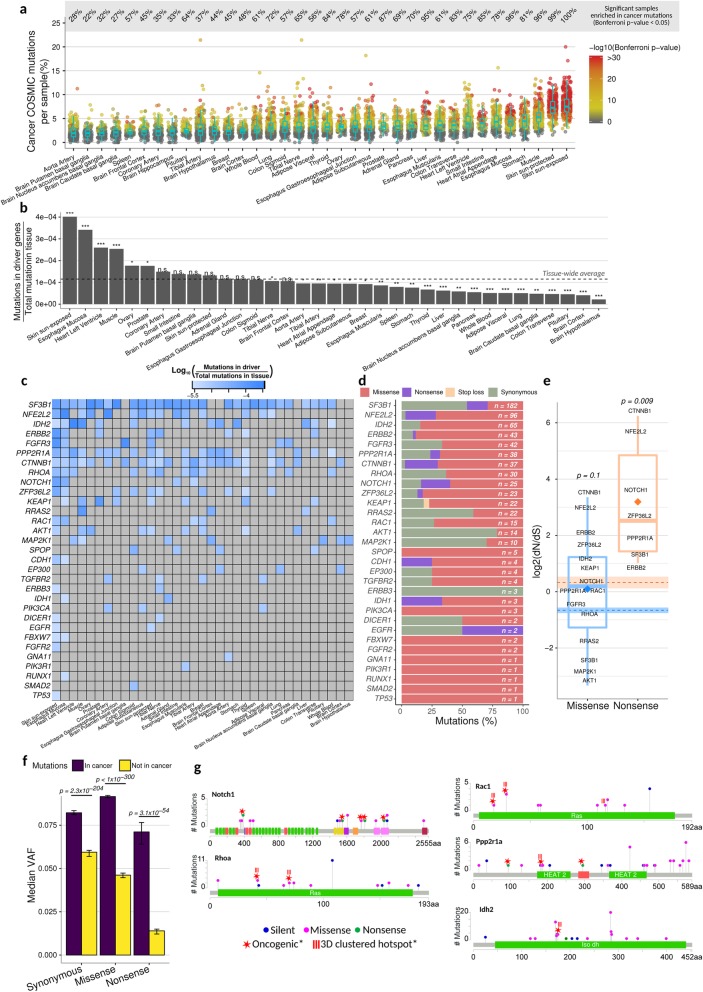
Results: To gain a better understanding of the genome-wide distribution and functional impact of somatic mutations, we leverage the genomic information contained in the transcriptome to uniformly call somatic mutations from over 7500 tissue samples, representing 36 distinct tissues. This catalog, containing over 280,000 mutations, reveals a wide diversity of tissue-specific mutation profiles associated with gene expression levels and chromatin states. For example, lung samples with low expression of the mismatch-repair gene MLH1 show a mutation signature of deficient mismatch repair. In addition, we find pervasive negative selection acting on missense and nonsense mutations, except for mutations previously observed in cancer samples, which are under positive selection and are highly enriched in many healthy tissues.

Conclusions: These findings reveal fundamental patterns of tissue-specific somatic evolution and shed light on aging and the earliest stages of tumorigenesis.

Keywords: Aging; Cancer; Genomic instability; Human; Somatic evolution; Somatic mutation.


Conflict of interest statement

The authors declare that they have no competing interests.

Figures

Fig. 1
Fig. 1
A method to identify DNA somatic mutations from RNA-seq. a A general overview of the method. RNA-seq reads were downloaded from GTEx v7 (left) and processed to identify positions with two different base calls at a high confidence. Then, sources of biological and technical artifacts were removed (right, see the “Methods” section). b Schematic illustrating potential sources of sequence variation. c Average percentage of variants detected in blood RNA-seq that are retained after each step of filtering (see the “Methods” section). d Validation of the method. For 105 individuals, we compared variant calls from exome DNA-seq data with those from RNA-seq of the same samples. Median FDR values per mutation type are shown, and they represent the fraction of mutations called in RNA-seq for which there are no exome reads supporting the same variant (see the “Methods” section and Additional file 1: Figure S1c). Error bars represent the 95% confidence interval after bootstrapping 10,000 times
Fig. 2
Fig. 2
Cross-tissue analysis of somatic mutations. a The total number of mutations observed in a tissue depends on the sequencing depth of that tissue. Sequencing depth is defined as the cumulative amount of uniquely mapped reads across all samples of a tissue. A linear regression line is shown in blue; tissues above it exhibit more mutations than expected by sequencing depth, while tissues below it show fewer mutations than expected. Rho is the Spearman coefficient. b Examples of significant mutation associations with age and biological sex (see Additional file 1: Fig. S4 and Additional file 6: Table S4 for all tissue data). Age ranges represent the youngest and oldest quartiles for each tissue. To control for sequencing depth and other technical artifacts, mutation values were obtained as the residuals from a linear regression (see the “Methods” section). p values are from a two-sided Mann-Whitney test. c Caucasian sun-exposed skin shows a higher percentage of C>T mutations compared to the sun-protected skin, while no such difference was seen for African-American skin. p values are from two-sided Mann-Whitney tests. d Median variant allele frequency (VAF) for each mutation type based on their impact to the amino acid sequence; error bars represent the 95% confidence interval after bootstrapping 1000 times; p values are from two-sided Mann-Whitney tests. e tSNE plot constructed from a normalized pentanucleotide mutation profile (the mutated base plus two nucleotides in each direction; see the “Methods” section for normalization details) and all samples in this study. f Average silhouette scores representing the coherence of selected groups of samples from the tSNE space in panel e; a score of 1 represents maximal clustering, whereas 0 represents no clustering (see the “Methods” section). Grouping was performed by tissue-of-origin, or multiple tissues combined (red labels). “Grouped by people” (green label) is an average silhouette score after grouping samples by their person-of-origin from 20 randomly selected people. The blue dashed line represents the average random score expectation after permuting tissue labels (see the “Methods” section), and the blue stripes are ± two standard deviations. Error bars in points represent the 95% confidence interval based on bootstrapping 10,000 times. g Mutation load is positively associated with H3K9me3 and/or negatively associated with H3K36me3 across most tissues analyzed. p values were obtained from a linear regression using all histone modifications as explanatory variables (see the “Methods” section). Gray range denotes non-significant p values after Bonferroni correction
Fig. 3
Fig. 3
Somatic mutational strand asymmetries. a Mutation average and S.D. for each strand with respect to transcription (left and middle panels) and the ratio of mean mutations on the transcribed over the non-transcribed strand (right panel). b Distribution of z-scores for mutation averages and standard deviations on each strand (from panel a) across all samples. c Example of intra-individual correlation of C>A strand asymmetry in two tissues; each point represents an individual for which we generated mutation maps in the two tissues (see Additional file 1: Figure S7a for all tissue pairwise comparisons). d Correlation of mutational strand biases between calls from RNA-seq and matched DNA-seq; each point represents the mutation strand bias observed in one gene across all 105 blood samples. Blue lines in all scatter plots are based on a linear regression; rho values are the Spearman correlation coefficients
Fig. 4
Fig. 4
Mutation load is associated with the expression of genes and pathways. a Histogram of the number of tissues for which each gene was significantly associated with mutation load (Bonferroni-corrected p < 0.05). Associations were estimated for each tissue using linear models controlling for population structure and biological and technical cofactors (see the “Methods” section). b Genes whose expression was negatively (top) or positively (bottom) associated with C>T mutation load in multiple tissues are enriched in these representative GO categories (see the “Methods” section and Additional file 11: Table S8, Additional file 12: Tables S9). c Individual gene-tissue associations between C>T mutations and expression of genes involved in DNA repair or DNA mutagenesis (right panel). Blue asterisks denote significant associations using a permutation-based FDR strategy (see the “Methods” section; *FDR < 0.2, **FDR < 0.1, ***FDR < 0.05). Shown on the left panel are genes whose expression was associated with mutation load across all tissues more than expected by chance at the indicated FDR (see the “Methods” section). d COSMIC cancer signature 6 (linked to MMR deficiency; left) is significantly similar to profiles from lung samples expressing low levels of MLH1 (right). The plot in the left panel represents the frequency of C>T mutations at the indicated tri-nucleotide context for signature 6. The plot in the right panel is the log ratio of C>T mutation rates comparing the 20% of lung samples with the lowest MLH1 expression vs the 20% with the highest MLH1 expression. Cosine similarity is indicated for C>T mutation across contexts, and the p value represents the frequency of cosine similarity values that were greater than the original from permuted values—permutations were done by randomly selecting 2 groups of 20% of samples and calculating the fold-change mutation frequencies between them. e Group-level gene expression associations of the shown pathways and C>T mutations across tissues (see the “Methods” section). Heatmap columns in c and e are ordered based on a hierarchical clustering
Fig. 5
Fig. 5
Cancer driver genes evolve under strong positive selection, and cancer mutations are enriched in healthy tissues. a Percentage of COSMIC cancer mutations observed per sample and grouped by tissue; p values for enrichment were calculated using a hypergeometric test accounting for sequencing coverage, total number of mutations per sample, total number of COSMIC mutations, and the three possible alternate alleles that any given reference allele can have (see the “Methods” section). p values are Bonferroni-corrected across all samples. b Relative mutation rates of a selected group of 53 genes known to carry cancer driver mutations [2] (only 31 of them had at least 1 mutation in this study); the tissue-wide average is indicated with the dotted line. Significant deviation from the tissue-wide average was calculated using the binomial distribution and the tissue-wide average mutation rate. Benjamini-Hochberg FDR: ***FDR < 0.001, **FDR < 0.01, *FDR < 0.05. c Individual mutation rates for each cancer driver gene across all tissues. d Percentage of mutations for each cancer driver gene stratified by impact to amino acid sequence; n is the total number of mutations observed in a gene. e dN/dS values for missense (blue) and nonsense mutations (orange) in cancer driver genes calculated using dndsloc [9, 36] (see the “Methods” section); averages per group are shown as rhomboids, and their respective genome-wide averages are shown as dashed lines along with their 95% confidence intervals after bootstrapping 10,000 times. p values indicate the probability of observing a higher average dN/dS from 10,000 equally sized randomly sampled groups of genes (see the “Methods” section). f Median variant allele frequency (VAF) for each mutation type based on their impact to the amino acid sequence and colored by their cancer status. Mutations “in cancer” (purple bars) are those that overlap with the COSMIC database in both base change and position, and mutations “not in cancer” (yellow bars) are those that overlap with COSMIC only in position but not in base change. Error bars represent the 95% confidence interval after bootstrapping 1000 times; p values are from two-sided Mann-Whitney tests. g Mutation maps of five cancer driver genes; oncogenic state was obtained from oncoKB [37], and clustered mutation annotations were obtained from the databases Cancer Hotspots [38] and 3D Hotspots of mutations occurring in close proximity at the protein level [39]

References

    1. Kennedy SR, Loeb LA, Herr AJ. Somatic mutations in aging, cancer and neurodegeneration. Mech Ageing Dev. 2012;133:118–126. doi: 10.1016/j.mad.2011.10.009. - DOI - PMC - PubMed
    1. Bailey MH, Tokheim C, Porta-Pardo E, Sengupta S, Bertrand D, Weerasinghe A, et al. Comprehensive characterization of cancer driver genes and mutations. Cell. 2018;173:371–385.e18. doi: 10.1016/j.cell.2018.02.060. - DOI - PMC - PubMed
    1. Alexandrov LB, Nik-Zainal S, Wedge DC, Aparicio SAJR, Behjati S, Biankin AV, et al. Signatures of mutational processes in human cancer. Nature. 2013;500:415–421. doi: 10.1038/nature12477. - DOI - PMC - PubMed
    1. Schuster-Bockler B, Lehner B. Chromatin organization is a major influence on regional mutation rates in human cancer cells. Nature. 2012;488:504–507. doi: 10.1038/nature11273. - DOI - PubMed
    1. Paz Polak, Rosa Karlic, Amnon Koren, Robert Thurman, Richard Sandstrom, Michael S. Lawrence AR, Eric Rynes, Kristian Vlahovicˇek JAS& SRS Cell-of-origin chromatin organization shapes the mutational landscape of cancer. Nature. 2015;518:360–364. - PMC - PubMed

Publication types

LinkOut - more resources