. 2020 Feb;97(2):370-382.
doi: 10.1016/j.kint.2019.08.038. Epub 2019 Oct 9.

Detection and characterization of mosaicism in autosomal dominant polycystic kidney disease

Affiliations

Detection and characterization of mosaicism in autosomal dominant polycystic kidney disease

Katharina Hopp et al. Kidney Int. 2020 Feb.

Abstract

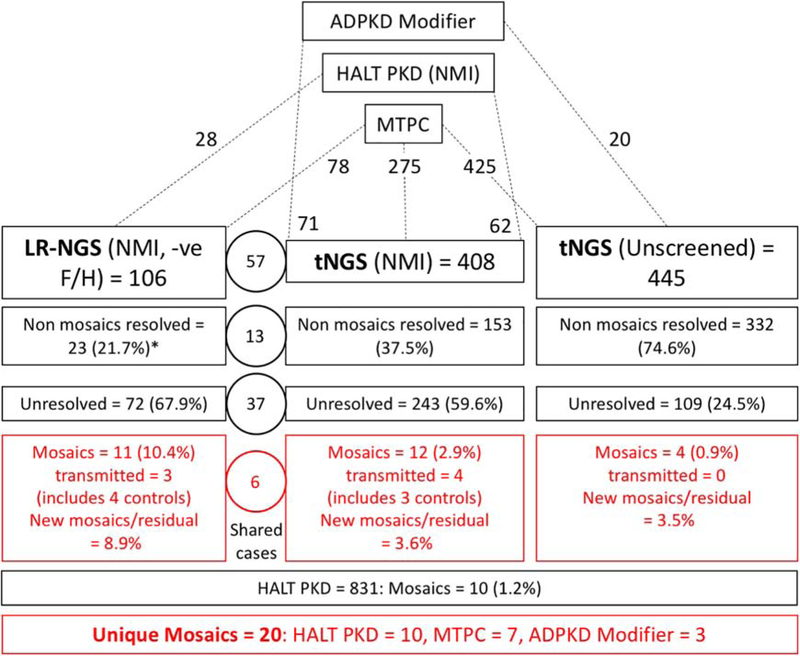
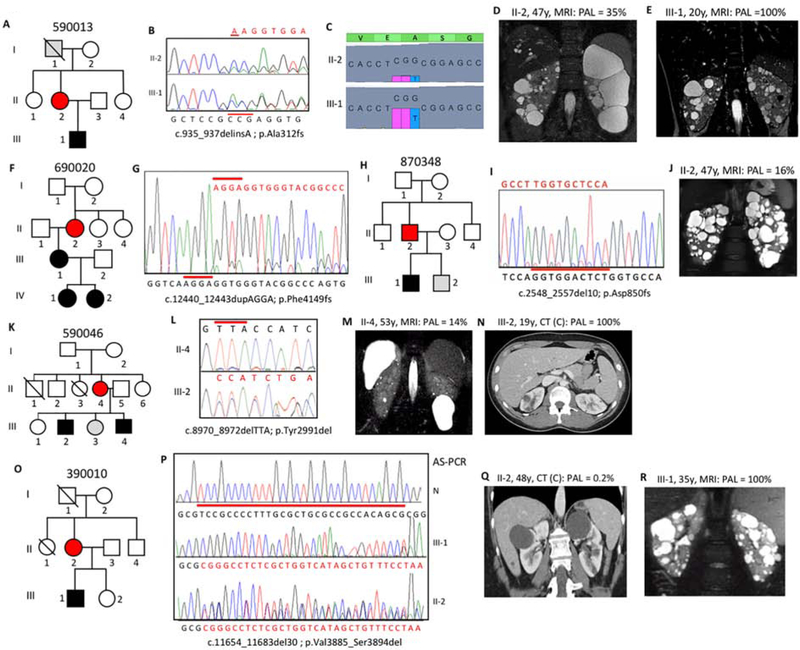
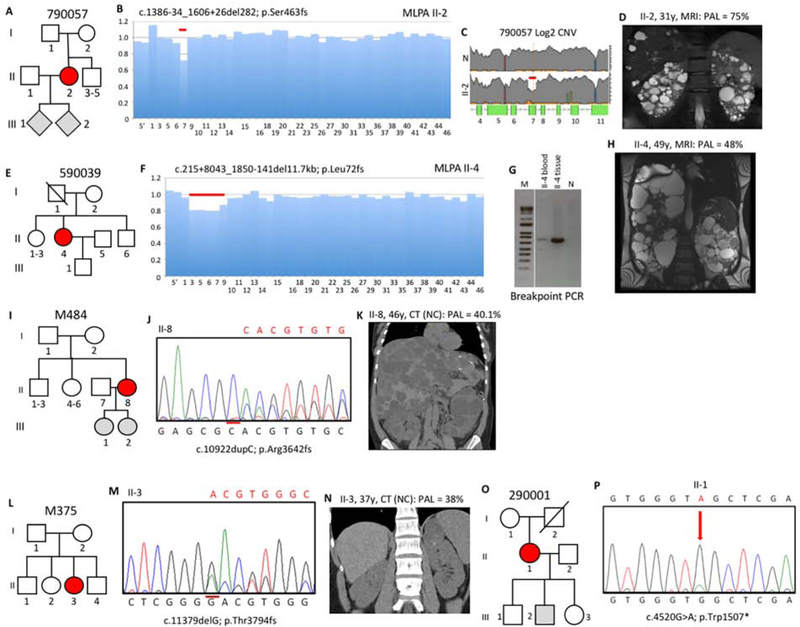
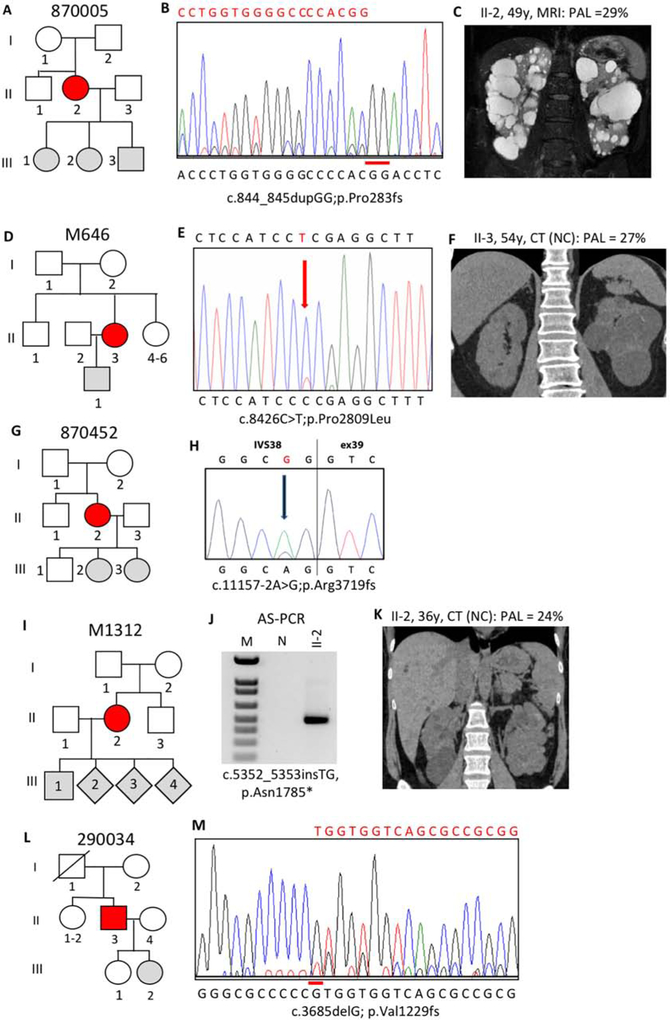
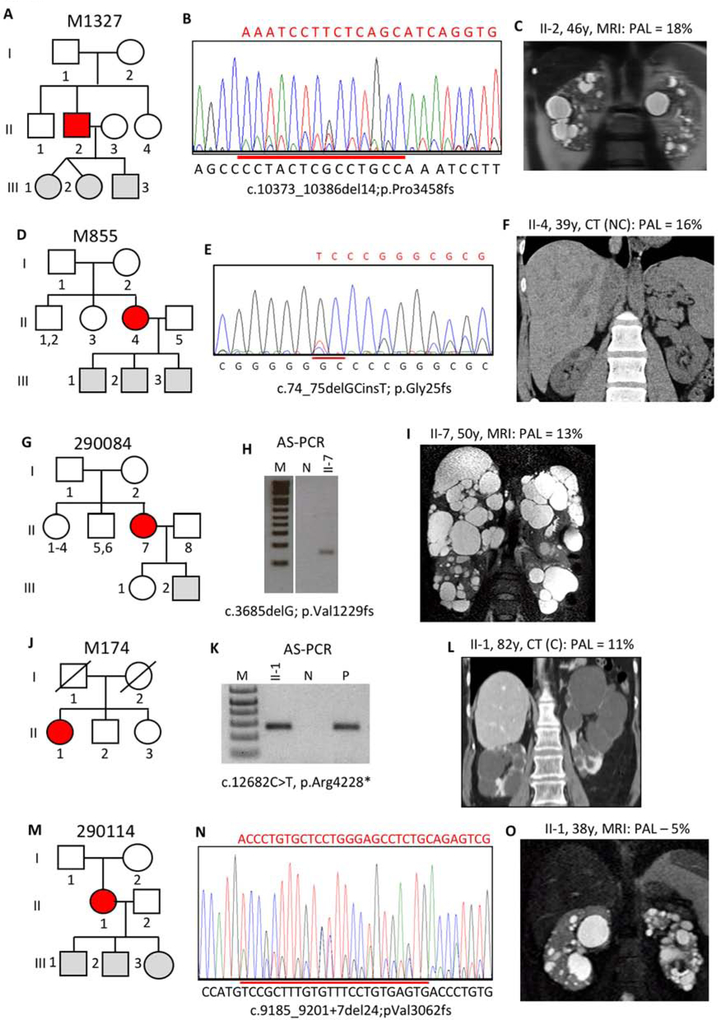
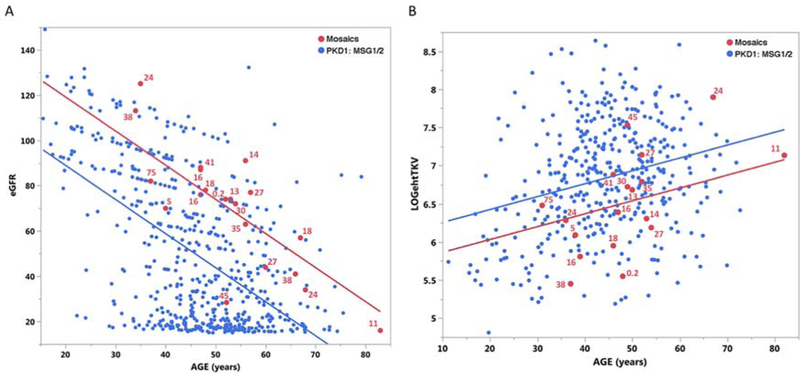
Autosomal dominant polycystic kidney disease (ADPKD) is an inherited, progressive nephropathy accounting for 4-10% of end stage renal disease worldwide. PKD1 and PKD2 are the most common disease loci, but even accounting for other genetic causes, about 7% of families remain unresolved. Typically, these unsolved cases have relatively mild kidney disease and often have a negative family history. Mosaicism, due to de novo mutation in the early embryo, has rarely been identified by conventional genetic analysis of ADPKD families. Here we screened for mosaicism by employing two next generation sequencing screens, specific analysis of PKD1 and PKD2 employing long-range polymerase chain reaction, or targeted capture of cystogenes. We characterized mosaicism in 20 ADPKD families; the pathogenic variant was transmitted to the next generation in five families and sporadic in 15. The mosaic pathogenic variant was newly discovered by next generation sequencing in 13 families, and these methods precisely quantified the level of mosaicism in all. All of the mosaic cases had PKD1 mutations, 14 were deletions or insertions, and 16 occurred in females. Analysis of kidney size and function showed the mosaic cases had milder disease than a control PKD1 population, but only a few had clearly asymmetric disease. Thus, in a typical ADPKD population, readily detectable mosaicism by next generation sequencing accounts for about 1% of cases, and about 10% of genetically unresolved cases with an uncertain family history. Hence, identification of mosaicism is important to fully characterize ADPKD populations and provides informed prognostic information.

Keywords: ADPKD; PKD1; diagnostics; genotype/phenotype correlations; mosaicism; mutations; prognostics.


Conflict of interest statement

Disclosure

All the authors declared no competing interests.

Figures

Figure 1.
Figure 1.. Diagram showing the study design and detection rates for the different groups involved in the screen for mosaicism.
ADPKD patients were included in the study from those collected for mutation screening at the Mayo Translational PKD Center (MTPC), ADPKD Modifier patients, and PKD1 and PKD2 SS NMI HALT PKD patients. The analysis for mosaic cases was performed in three screens, LR-NGS of PKD1 and PKD2 SS NMI ADPKD patients with a proven or suspected negative family history (-ve F/H), a tNGS screen of PKD1 and PKD2 SS NMI ADPKD patients, and a tNGS screen of previously unscreened patients. The number of total families included in each screen, and their origin is indicated at the top portion of the figure. The detection rate breakdown of each screen is indicated in boxes and includes number of families resolved with typical heterozygous variants (non mosaics resolved), number of families remaining unresolved, and the number of families with detected mosaic variants. The numbers in the circles represents families shared among the LR-NGS and tNGS approach. The number of newly detected mosaics as a proportion of the unresolved plus mosaics (New mosaics/residual) is also calculated. Approximately 1% of not families (HALT PKD (1.2%) and tNGS (Unscreened; 0.9%)) were mosaics. In addition, newly resolved mosaics represented 8.9% of the unresolved plus mosaic families from the LR-NGS screen (-ve F/H and SS PKD1/PKD2 NMI) and 3.6% from the tNGS (SS PKD1/PKD2 NMI) screen. The number of unresolved families from the tNGS (unscreened) analysis is greater than expected from a typical ADPKD population, which is likely because of the large number of very mild and atypical patient screened from the MTPC population. *For the non-mosaic patients resolved from the LR-NGS screen, results from other genes detected by tNGS are also included.
Figure 2.
Figure 2.. Pedigree, imaging and sequencing data of mosaic families segregating the pathogenic variant to the next generation.
(A) Pedigree 590013 showing ADPKD in II-2 and III-1, with I-1 found to have a few, likely simple, cysts at 79y. (B) SS showing the indel (red line) and reduced peak height of the frameshifted sequence (red) in II-2 compared to III-1. (C) tNGS showing the CCG deletion and T insertion in a reduced number of reads in II-2 compared to III-1. (D) MRI of II-2 at 47y showing asymmetric disease with just a few large cysts in the left kidney compared to a more even distribution in III-1 (E). (F) Pedigree 690020 with ADPKD in three generations. (G) SS of II-2 showing the frameshifted sequence following the 4bp duplication at a low level, reflecting mosaicism. (H) Pedigree of family 870348 with ADPKD in II-2 and III-1. (I) SS of II-2 (reverse strand) showing frameshifted sequence due to a 10bp deletion at a very low level, which is confirmed by AS-PCR (Figure S2B). (J) MRI showing robust PKD in II-2. (K) Pedigree 590046 showing the mosaic case (II-4) with two affected children (III-2 and III-4). (L) The inframe codon deletion is seen at only a low level in II-4 compared to III-2. (M) MRI of II-4 showing very mild kidney and liver cystic disease. (N) Contrast (C) enhanced CT of III-2 at 19y showing a few kidney cysts. (O) Pedigree 390010 shows ADPKD in the II-2 and III-1. (P) SS of the AS-PCR from a normal individual (N), the son (III-1) and the mosaic mother (II-2) shows the 30bp deletion in the son, but due to the low-level mosaicism, the AS-PCR is not completely specific in II-2, hence the doublet sequence. (Q) CT of II-2 shows just a couple of cysts, in contrast to the typical PKD shown by MRI in III-1 (R). Pedigree: red shaded, mosaic; gray, equivocal or unknown; white, ADPKD negative. The percentage of the observed versus the expected level of the pathogenic allele (PAL) is indicated next to each radiological image.
Figure 3.
Figure 3.. Pedigree, imaging and sequencing data of mosaic families not segregating the pathogenic variant
(I). (A) Pedigree 790057 showing the mosaic mother (II-2) and her untested offspring. (B) Screening by MLPA found a possible mosaic deletion of ex7 that was confirmed by log2 copy number variant (CNV) analysis of the LR-NGS (C). (D) MRI of II-2 shows typical ADPKD at 31y. (E) Pedigree 590039 shows the mosaic subject (II-4) as the only affected. (F) A suspected mosaic PKD1 deletion was detected by MLPA and confirmed by log2 CNV analysis (Figure S2D). (G) Amplification and SS (Figure S2E) of a specific breakpoint fragment defined the deletion. (H) MRI of II-4 shows significant kidney disease at 49y (prior to ESRD) and severe PLD (after partial liver resection). (I) Pedigree M484 showing two untested daughters of the mosaic case (II-8). (J) Sanger confirmation of the mosaic single nucleotide duplication in II-8. (K) Non-contrast (NC) enhanced CT of II-8 at 46y shows significant PKD and severe PLD. (L) Pedigree M375 shows just one affected subject (II-3). (M) Sanger sequence shows II-3 is mosaic for a single nucleotide deletion. (N) CT of II-3 at 37y shows very mild kidney disease. (O) Pedigree 290001 shows the mosaic subject (II-1) and three children without PKD or untested. (P) Sanger sequence of II-1 confirms mosaicism of a nonsense change. Pedigree: red shaded, mosaic; gray, equivocal or unknown; white, ADPKD negative. The percentage of the observed versus the expected level of the PAL is indicated next to each radiological image.
Figure 4.
Figure 4.. Pedigree, imaging and sequencing data of mosaic families not segregating the pathogenic variant
(II). (A) Pedigree 870005 where the mosaic subject (II-2) has three untested children. (B) SS confirmation in II-2 of mosaicism of the GG duplication (reverse strand shown). (C) MRI of II-2 at 49y shows multiple large cysts. (D) Pedigree M646 where the mosaic proband (II-3) has an untested son. (E) SS confirms mosaicism for a previously described missense substitution in II-3. (F) CT imaging of II-3 at 54y shows bilateral disease with large cysts in the left kidney. (G) Pedigree 870452 showing three offspring of the mosaic case II-2. (H) SS of II-2 confirms mosaicism for a typical splicing variant. (I) Pedigree M1312 shows mosaicism in II-2 with four untested children. (J) AS-PCR shows a specific fragment just in II-2 but not the normal (N) control, that was confirmed to have the TG insertion by SS of the product (Figure S2F). (K) CT of II-2 at 36y shows bilateral cysts with several large cysts in the right kidney. (L) Pedigree 290034 indicates mosaicism in II-3 and two children either negative or untested. (M) Sanger sequence of II-3 confirms mosaicism of a G deletion. Pedigree: red shaded, mosaic; gray, equivocal or unknown; white, ADPKD negative. The percentage of the observed versus the expected level of the PAL is indicated next to each radiological image.
Figure 5.
Figure 5.. Pedigree, imaging and sequencing data of mosaic families not segregating the pathogenic variant
(III). (A) Pedigree M1327 shows the mosaic proband (II-2) has untested twin girls and a son. (B) SS of II-2 confirms mosaicism for a 14bp deletion. (C) Just a few bilateral cysts are detected in II-2 by MRI at 46y. (D) The mosaic proband in M855 (II-4) has 3 untested children. (E) SS of II-4 confirms mosaicism of a deletion/insertion. (F) CT of II-4 at 39y show just a few small cysts in the kidney and liver. (G) Pedigree 290084 shows two offspring of the mosaic subject (II-7) either negative for PKD or untested. (H) AS-PCR shows the mutant allele just in II-7 but not a control (N), and sequencing confirms the substitution (Figure S2G). (I) MRI of II-7 show moderate kidney disease and severe PLD. (J) The mosaic proband (II-1) in M174 is the only affected member. (K) AS-PCR shows that II-1 has p.Arg4228* that is also found in a positive control (P) but not an individual without this change (N), and SS shows the substitution at a very low level (Figure S2H). (L) CT of II-1 at 82y, shortly before ESRD, shows a few large cysts in both kidneys. (M) Pedigree 290114 shows the mosaic individual (II-1) has three untested children. (N) SS of II-1 shows mosaicism for a 24bp, splice site spanning, deletion. (O) II-1 has mild cystic disease with a few moderately sized cysts. Pedigree: red shaded, mosaic; gray, equivocal or unknown; white, ADPKD negative. The percentage of the observed versus the expected level of the PAL is indicated next to each radiological image.
Figure 6.
Figure 6.. Regression comparison of eGFR and htTKV in mosaic subjects compared to PKD1 controls.
The control populations (blue) are PKD1 patients with truncating (MSG1) or strongly predicted non-truncating changes (MSG2) from a MTPC cohort without known mosaicism; n=550 for eGFR and 403 for htTKV. The mosaic population is indicated in red and the percentage level of the mosaic allele compared to a fully penetrant allele is listed for each case. (A) The renal function analysis shows that the mosaic population (red) has a significantly higher eGFR than the controls (blue). (B) Analysis of renal structure shows that the mosaic population has a significantly lower htTKV than the controls. The htTKV is plotted on a log2 scale. No correlation was observed between the level of mosaicism and disease severity (eGFR or htTKV).

Comment in

References

    1. Sampson JR, Scahill SJ, Stephenson JB, et al. Genetic aspects of tuberous sclerosis in the west of Scotland. J Med Genet 1989; 26: 28–31. - PMC - PubMed
    1. Tyburczy ME, Dies KA, Glass J, et al. Mosaic and Intronic Mutations in TSC1/TSC2 Explain the Majority of TSC Patients with No Mutation Identified by Conventional Testing. PLoS Genet 2015; 11: e1005637. - PMC - PubMed
    1. Rossetti S, Strmecki L, Gamble V, et al. Mutation analysis of the entire PKD1 gene: genetic and diagnostic implications. Am J Hum Genet 2001; 68: 46–63. - PMC - PubMed
    1. Iliuta IA, Kalatharan V, Wang K, et al. Polycystic Kidney Disease without an Apparent Family History. J Am Soc Nephrol 2017; 28: 2768–2776. - PMC - PubMed
    1. Torres VE, Harris PC, Pirson Y. Autosomal dominant polycystic kidney disease. Lancet 2007; 369: 1287–1301. - PubMed

Publication types

Substances