Clinical Trial
. 2019 Dec 24;9(1):19732.
doi: 10.1038/s41598-019-56233-0.

Temporal development of the oral microbiome and prediction of early childhood caries

Affiliations
Clinical Trial

Temporal development of the oral microbiome and prediction of early childhood caries

S G Dashper et al. Sci Rep. .

Abstract

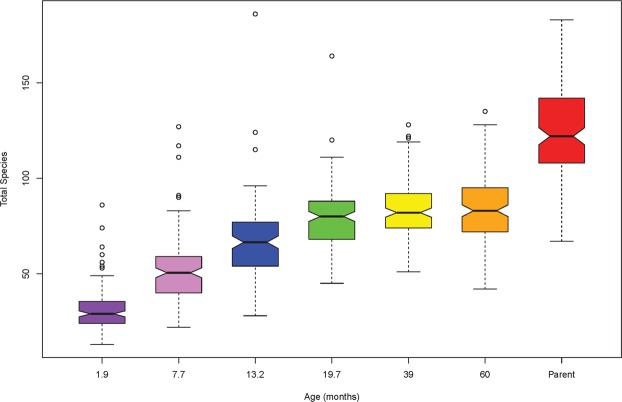
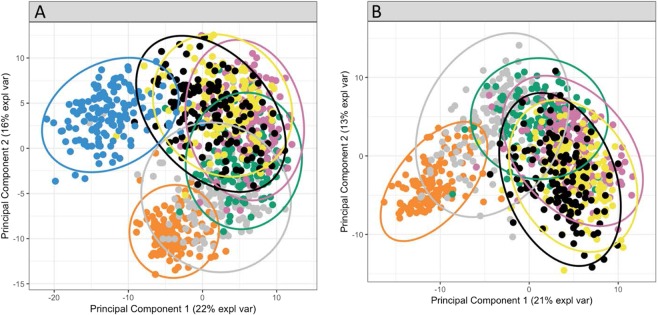
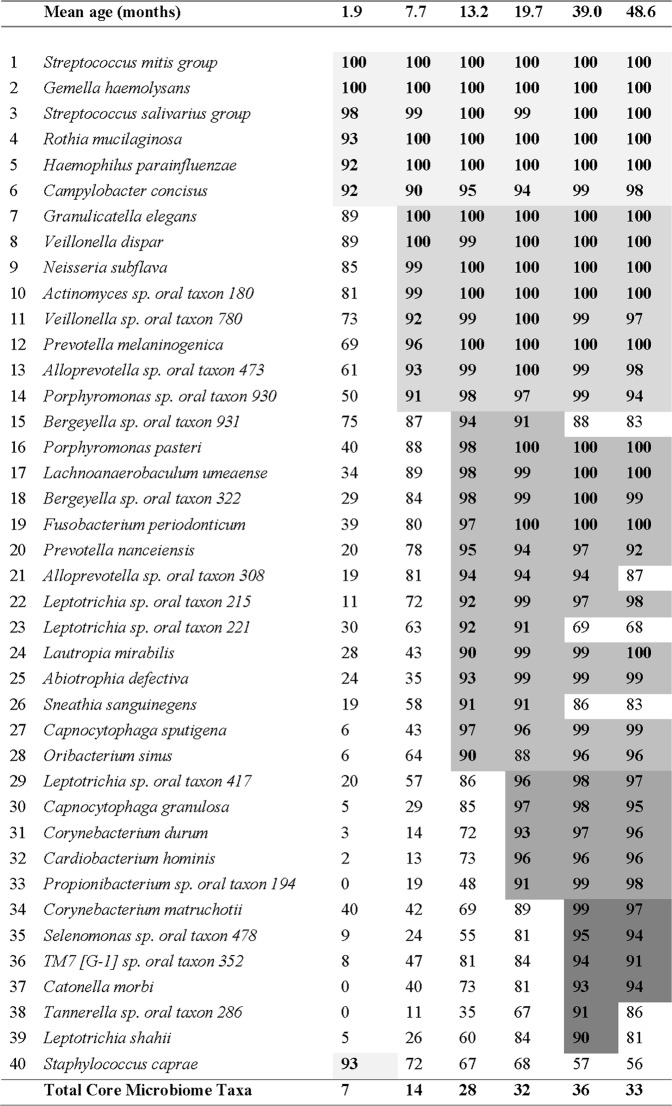
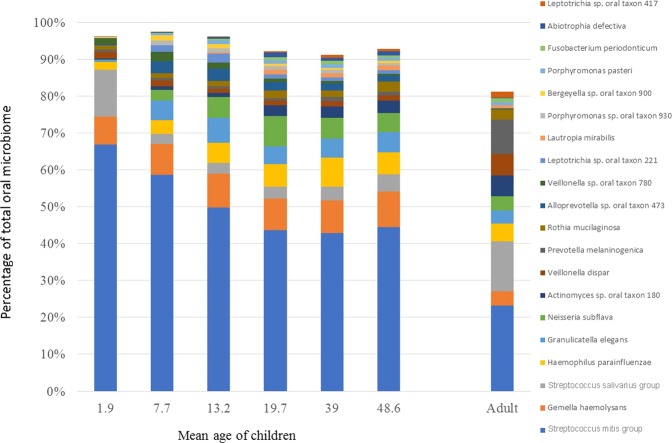
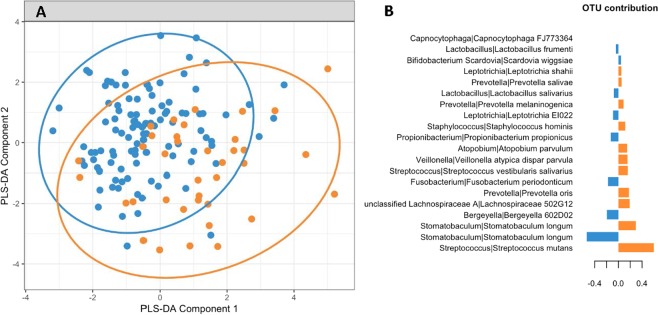
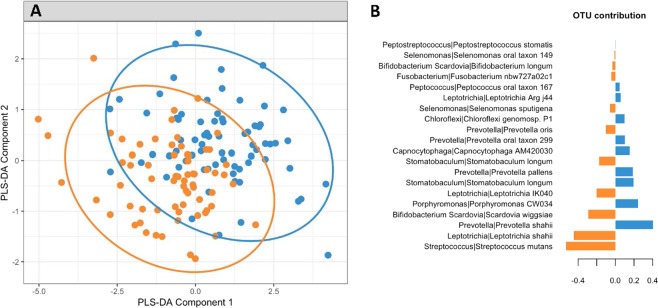
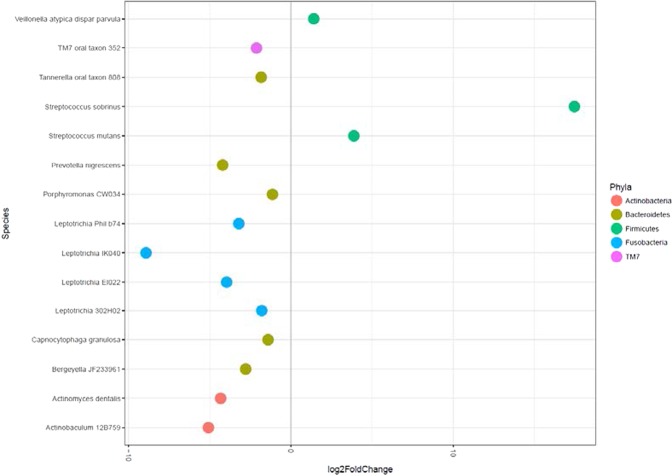
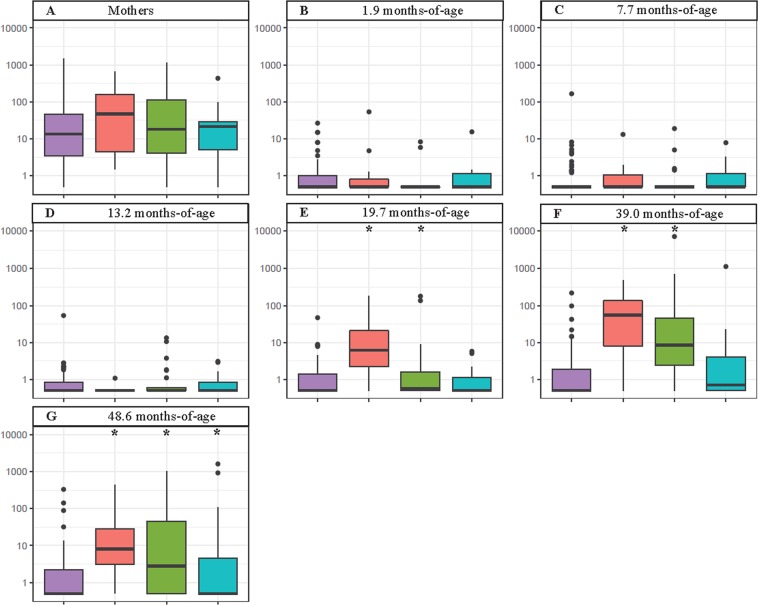
Human microbiomes are predicted to assemble in a reproducible and ordered manner yet there is limited knowledge on the development of the complex bacterial communities that constitute the oral microbiome. The oral microbiome plays major roles in many oral diseases including early childhood caries (ECC), which afflicts up to 70% of children in some countries. Saliva contains oral bacteria that are indicative of the whole oral microbiome and may have the ability to reflect the dysbiosis in supragingival plaque communities that initiates the clinical manifestations of ECC. The aim of this study was to determine the assembly of the oral microbiome during the first four years of life and compare it with the clinical development of ECC. The oral microbiomes of 134 children enrolled in a birth cohort study were determined at six ages between two months and four years-of-age and their mother's oral microbiome was determined at a single time point. We identified and quantified 356 operational taxonomic units (OTUs) of bacteria in saliva by sequencing the V4 region of the bacterial 16S RNA genes. Bacterial alpha diversity increased from a mean of 31 OTUs in the saliva of infants at 1.9 months-of-age to 84 OTUs at 39 months-of-age. The oral microbiome showed a distinct shift in composition as the children matured. The microbiome data were compared with the clinical development of ECC in the cohort at 39, 48, and 60 months-of-age as determined by ICDAS-II assessment. Streptococcus mutans was the most discriminatory oral bacterial species between health and current disease, with an increased abundance in disease. Overall our study demonstrates an ordered temporal development of the oral microbiome, describes a limited core oral microbiome and indicates that saliva testing of infants may help predict ECC risk.


Conflict of interest statement

The authors declare no competing interests.

Figures

Figure 1
Figure 1
Notch plot of the bacterial α-diversity of saliva from the 134 children and their mothers examined in this study. The figure shows oral bacterial community development in children as the increase in taxa number over six time-points, from 1.9 to 48.6 months-of-age. The number of bacterial taxa in the saliva of mothers taken when their children were 7.7 months-of-age is shown for comparison. The box represents the interquartile (50% of data), the horizontal line in the box represents the median, the “notch” represents the 95% confidence interval of the median and the “whiskers” represent the maximum and minimum values.
Figure 2
Figure 2
Principal component analysis of the oral microbiome from 1.9 months to 48.6 months-of-age showing the temporal development of the bacterial community. (A) Inclusion of the mothers’ oral microbiome (blue) into the data, showing the relationship of the children’s microbiome to that of their mothers’. (B) Without the mothers, a longitudinal trend is still observed. The microbiome of each child is shown at ages 1.9 (orange), 7.7 (grey), 13.2 (green), 19.7 (pink), 39 (yellow) and 48.6 (black) months. Confidence ellipse plots for each mean age group are represented at a 95% level.
Figure 3
Figure 3
Temporal development of the core oral microbiome. Values represent the percentage of the cohort with detectable levels of each taxa at the six mean ages tested. Taxa were considered to be part of the core microbiome if they were present in the saliva of more than 90% of the children in the cohort at one or more time-points. Bold font within the Figure shows those values above 90%. Taxa are arranged from early to late colonisers and the shading clusters taxa based on when they first became part of the core microbiome. Staphylococcus caprae is placed at the end of the Figure due to its anomalous colonization pattern. The final row shows the total number of taxa in the children’s core microbiome at that time point.
Figure 4
Figure 4
Change in the bacterial composition of children’s saliva from 1.9 months to 48.6 months-of-age based on the twenty most abundant taxa. The bacterial composition of the mothers’ saliva when the children were 7.7 months-of-age is shown for comparison.
Figure 5
Figure 5
Discriminant Analysis of oral microbiome taxa at a mean age of 39 months associated with health (caries free) or disease (ECC as defined by the presence of one or more ICDAS II score of two or above). (A) sPLS-DA plot showing some discrimination of the sample groups, 95% confidence ellipse plots are represented. (B) Most important taxa selected from sPLS-DA and associated with caries free or ECC. The x-axis represents the importance of each OTU in sPLS-DA, the y-axis the OTUs with their Genus | Species taxonomy classification. Colours indicate the sample group where the OTU’s median was the largest. Blue = health; Orange = disease.
Figure 6
Figure 6
Discriminant Analysis of oral microbiome taxa at a mean age of 48.6 months associated with health (caries free) or disease (ECC as defined by the presence of one or more ICDAS II score of two or above). (A) sPLS-DA plot showing some discrimination of the sample groups, 95% confidence ellipse plots are represented. (B) Most important taxa selected from sPLS-DA and associated with caries free or ECC. The x-axis represents the importance of each OTU in sPLS-DA, the y-axis the OTUs with their Genus | Species taxonomy classification. Colours indicate the sample group where the OTU’s median was the largest. Blue = health; Orange = disease.
Figure 7
Figure 7
Differences in bacterial taxa abundances in saliva at 39 months-of-age in children who developed disease at 48.6 months-of-age compared with those that remained healthy.
Figure 8
Figure 8
Abundance of S. mutans in the saliva of mothers and children at specified time points who remained healthy for the entire 60 months (purple, n = 69), developed clinically detectable disease at 39 months (red, n = 12), 48.6 months (green, n = 33) or 60 months (blue, n = 20) of age. The box plots show the median (line within the box), first and third quartiles (box), non-outlier range (whiskers), and outliers (dots). Asterisks denote those values significantly different to the remain healthy control group.

References

    1. Frencken JE, et al. Minimal intervention dentistry for managing dental caries - a review: report of a FDI task group. Int Dent J. 2012;62:223–243. doi: 10.1111/idj.12007. - DOI - PMC - PubMed
    1. Ha Diep, Do Loc, Spencer Andrew, Thomson William, Golley Rebecca, Rugg-Gunn Andrew, Levy Steven, Scott Jane. Factors Influencing Early Feeding of Foods and Drinks Containing Free Sugars—A Birth Cohort Study. International Journal of Environmental Research and Public Health. 2017;14(10):1270. doi: 10.3390/ijerph14101270. - DOI - PMC - PubMed
    1. Peres Karen Glazer, Nascimento Gustavo G., Peres Marco Aurelio, Mittinty Murthy N., Demarco Flavio Fernando, Santos Ina Silva, Matijasevich Alicia, Barros Aluisio J D. Impact of Prolonged Breastfeeding on Dental Caries: A Population-Based Birth Cohort Study. Pediatrics. 2017;140(1):e20162943. doi: 10.1542/peds.2016-2943. - DOI - PubMed
    1. Drury TF, et al. Diagnosing and Reporting Early Childhood Caries for Research Purposes: A Report of a Workshop Sponsored by the National Institute of Dental and Craniofacial Research, the Health Resources and Services Administration, and the Health Care Financing Administration. Journal of Public Health Dentistry. 1999;59:192–197. doi: 10.1111/j.1752-7325.1999.tb03268.x. - DOI - PubMed
    1. Ha, D., Roberts-Thomson, K. F. & Armfield, J. M. The Child Dental Health Survey Australia, 2005 and 2006. (Australian Institute of Health and Welfare Australia, 2011).

Publication types