. 2019 Dec 24;29(13):4389-4406.e10.
doi: 10.1016/j.celrep.2019.11.085.

miRNA551b-3p Activates an Oncostatin Signaling Module for the Progression of Triple-Negative Breast Cancer

Affiliations

miRNA551b-3p Activates an Oncostatin Signaling Module for the Progression of Triple-Negative Breast Cancer

Deepak Parashar et al. Cell Rep. .

Abstract

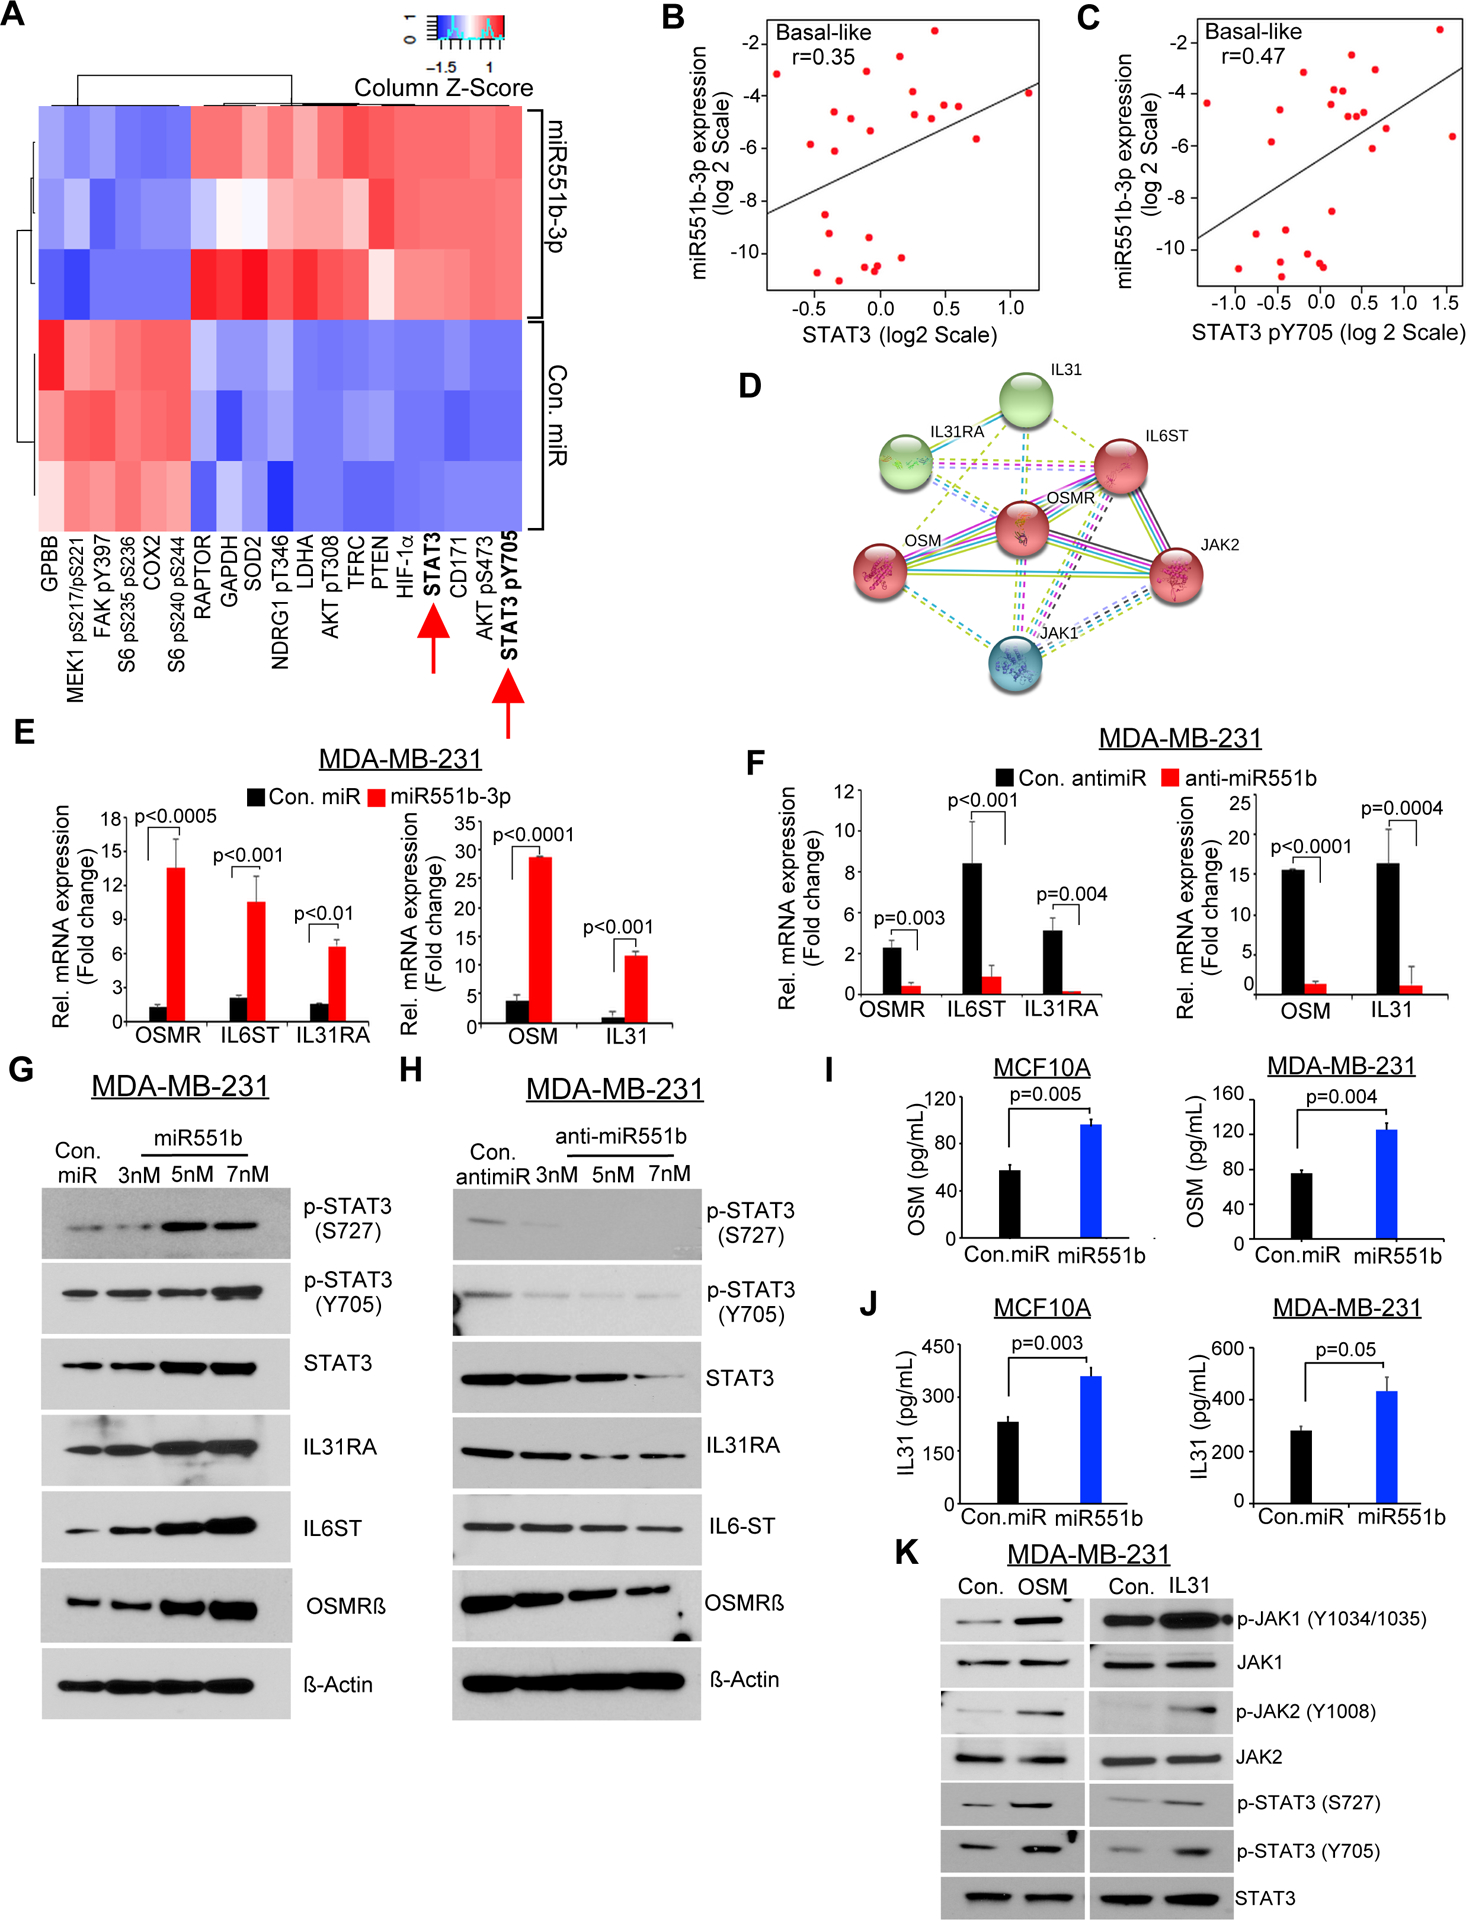
Genomic amplification of 3q26.2 locus leads to the increased expression of microRNA 551b-3p (miR551b-3p) in triple-negative breast cancer (TNBC). Our results demonstrate that miR551b-3p translocates to the nucleus with the aid of importin-8 (IPO8) and activates STAT3 transcription. As a consequence, miR551b upregulates the expression of oncostatin M receptor (OSMR) and interleukin-31 receptor-α (IL-31RA) as well as their ligands OSM and IL-31 through STAT3 transcription. We defined this set of genes induced by miR551b-3p as the "oncostatin signaling module," which provides oncogenic addictions in cancer cells. Notably, OSM is highly expressed in TNBC, and the elevated expression of OSM associates with poor outcome in estrogen-receptor-negative breast cancer patients. Conversely, targeting miR551b with anti-miR551b-3p reduced the expression of the OSM signaling module and reduced tumor growth, as well as migration and invasion of breast cancer cells.

Keywords: IPO8; OSMR; RNAi; STAT3; miR551b; miRNA-therapy; oncostatin.


Conflict of interest statement

Declaration of Interests

The authors declare no competing interests.

Figures

Figure-1
Figure-1. b-3p promotes oncogenic features in breast cancer cells.
A-B, Cell lines were transfected with control miR or miR551b-3p and the viability was assessed at the indicated time points, using MTT. Cell lines above were also assessed for their colony-forming ability 14 days after transfection by staining with crystal violet *P < 0.05, vs. control (con) miR. C, Representative images (scale bars represent 500 μm) of transfected (with con. miR or miR551b-3p) MCF10A or MDA-MB-231 cells that migrated or invaded through trans-well inserts with or without Matrigel and the quantification of absorbance crystal violet eluted. D, Representative images of three microscopic fields in a wound-healing assay of MCF10A and MDA-MB-231 cells captured at 24h after transfection with con. miR and different concentrations of miR551b-3p. Red-line indicates the empty space between healing cells. Scale bars represent 500 μm. E. Cell lines were transfected with control miR (7nM) and miR551b-3p at the indicated concentrations and immunoblotted 48 h after transfection. F, Total RNA was isolated from samples (as indicated in E) and qPCR was performed. mRNA expression was normalized to ß-actin. Bars represent S.E. of triplicate determinations. G, Cells were transfected with control miR (7nM) or miR551b-3p at the indicated concentrations and representative images of MCF10A and MDA-MB-231 spheroids formed on a low- attachment plate were captured. Scale bars represent 500 μm. H, Total RNA was isolated from samples (as indicated in F), and qPCR was performed. Error bars represent standard errors (SE) of triplicates. Student’s t-test was used for statistical analysis.
Figure-2.
Figure-2.. Inhibition of miRNA 551b-3p reduces oncogenic properties of breast cancer cells.
A-B, MDA-MB-231 cells were transfected with con. anti-miR or anti-miR551b-3p at different concentrations, and cell viability was assessed at the indicated time point using MTT and their colony-forming ability was assessed after 14 days. Error bars represent SE of quadruplicates, and P values were determined by Student’s t-test. *indicates P < 0.05 compared to the control group. C, Quantitative analysis of the colony-forming assay in (B). D, MDA-MB-231 cells were transfected with con. anti-miR (7nM) or anti-miR551b (7nM) for 48h, and the numbers of apoptotic cells (Q1) and viable cells (Q3) were assessed with a calcein AM/ethidium bromide (EtBr) assay kit, using flow cytometry. Data shown are representative of three independent experiments in triplicate. E–F, MDA-MB-231 cells were transfected with con. anti-miR or anti-miR551b-3p and plated onto trans-well inserts. Migrated or invaded cells were photographed (upper panel). Scale bars represent 500 μm. Bar graph represents the quantification of the cells migrated or invaded. G, The cells were transfected with control anti-miR or anti-miR551b-3p at the indicated concentrations and the spheroids formed on low attachment plates were photographed and quantitated on day 7. Scale bars represent 500 μm. H, Total RNA extracted from cells were transfected with control anti-miR or anti-miR551b-3p (7nM) 48h after transfection, and qPCR was performed to determine indicated genes. I, Cell lysates were prepared 48 h after transfection of con. anti-miR or anti-miR551b-3p (7nM) and immunoblotting was performed. J, qPCR was performed using total RNA was extracted from (I) to determine the expression of indicated genes. All mRNAs were normalized to ß-actin in qPCR assays. Bars represent S.E. of triplicate determinations. Statistical analysis was done by Student’s t-test.
Figure-3
Figure-3. b-3p regulates oncostatin gene module expression in breast cancer cells.
A, MDA-MB-231 cells were transfected with con. miR or miR551b-3p in three independent experiments, and effects on protein levels were determined by RPPA 48 h later. Proteins with >20% change in expression are represented in the heatmap. B–C, Pearson correlation analysis was performed based on the expression of miR551b-3p versus STAT3 or miR551b-3p versus pSTAT3 protein levels in basal like subtype of breast cancer patient samples in the Danish Breast Cancer Cohort Group (DBCG) cohort; n = 89. D, OSMR-signaling network predicted by STRING database. E, MDA-MB-231 cells were transfected with con. miR (7nM) or miR551b-3p (7nM), or F, transfected with con. antimiR (7nM) or with anti-miR551b (7nM) and qPCR was performed to test the expression of the indicated genes using RNA collected 48h after transfection. G-H, MDA-MB-231 cells were transfected with indicated miRs; then immunoblot was performed 48h after transfection. I–J, Secreted levels of OSM and IL31 in the culture supernatant of MCF10A and MDA-MB-231 cells were collected after con. miR or miR-551b −3p transfection and quantitated by ELISA. Bars represent mean ± S.E of quadruplicate determinations of three different experiments. K, MDA-MB-231 cells were treated with OSM, or IL31 (20ng/ml), then lysates were prepared and immunoblot was performed 48h after transfection.
Figure-4
Figure-4. b is translocated to nucleus and is mediated by Importin-8.
A, Total RNA was isolated from cytoplasmic and nuclear fractions of cell lines indicated and miR551b-3p expression was analyzed by qPCR. miRNA was normalized to U6. B, The WT STAT3 promoter, including 962 bp upstream of the transcription start site (TSS), was cloned in the pLight luciferase reporter construct and co-transfected with control miRNA and miR551b-3p. Similarly, mutant STAT3 promoter constructs (#1 - #4) as indicated in (C) were co-transfected with Con. miR or miR551b-3p into MDA-MB-231 cells, then luciferase activity was assessed. C, Sequence complementarity between miR551b-3p with STAT3 promoter, and the sites and sequences of mutations prepared. D, MDA-MB-231 cells were transfected with Cy3 labelled (red) miR551b or mutant miR551b, then fixed after 48h and confocal microscopy was performed, and representative images presented. Scale bars represent 20 μm. E, Nuclear translocation signal of miR551b-3p is quantitated by Image-J Coloc-2 pixel intensity spatial correlation analysis suite and Mander’s co-localization coefficient and the percentage of foci presented. F, RNA immunoprecipitation (RIP) assay was performed following transfection with con miRNA, miR551b-3p or mutant miR551b for 48h in MDA-MB-231 cells. Lysates of transfected cells were pull down using antibodies specific to IPO8 or control IgG in cytoplasmic and nuclear fractions to detect miR551b in lysates bound to IPO8. Control IgG antibody was used as negative controls for RIP, whereas U6 was used as a control for qRT-PCR and fold enrichment was calculated w.r.t. control IgG. Data presented as mean ± SE (n = 3). G, Lysates of MDA-MB-231 cells were used to perform immunoprecipitation of IPO8 as in (F) and immunoblotted for the indicated proteins. H, Total RNA was isolated from MDA-MB-231 cells transfected with siControl, siIPO8 and siIPO9 as followed by transfection with control miRNA and miR551b. miR551b expression was analyzed by qPCR 48h after transfection. miRNA expression was normalized to U6. I, Cy3 labelled miR551b (red) was transfected in the cells were pre-transfected with control siRNAs, siIPO8 or siIPO9, then fixed and imaged. Scale bars represent 20 μm. J, Nuclear translocation signal of miR551b-3p is quantitated as described in (E). K, Proposed model illustrating the transport of miR551b-3p into nucleus aided by IPO-8-AGO1 complex.
Figure-5
Figure-5. b-3p requires STAT3 for the regulation of OSM-Gene module.
A, MDA MB231 cells were transfected with con. miR or miR551b-3p, 24h after transfection of two different STAT3 siRNAs. RNA was isolated 48h after transfection and qPCR was performed to quantitate the expression of indicated mRNAs. mRNA expression was normalized to β-Actin. Bars represent S.E of triplicates. P-value was determined by Student’s t test. B, Immunoblot was performed using the lysates prepared from (A). C, qPCR was performed to quantitate the mRNA expression of OSM and IL31 from cells co-transfected with that siSTAT3 and miR551b as indicated in (A). Error bars represent means ± SE from three different experiments performed in quadruplicates. D-E. ChIP-qPCR analysis of the enrichment of STAT3 at the indicated promoter genes in MDA-MB-231 cells were transfected with con. miR and miR551b-3p (D) or treated with OSM (20ng/ml) and IL31 (20ng/ml) (E). The qPCR data are presented as fold enrichment compared to IgG control. Bars represent mean ± S.E. Statistical analysis was done by Student’s t test.
Figure-6
Figure-6. b effectors associate with the progression of breast cancer.
A, MDA-MB-231 cells were stimulated with OSM (20ng/ml), IL31 (20ng/ml) or both at 10ng/ml of each and the cell viability was assessed at indicated time points using MTT assay. Error bars represent S.E of quadruplicates. *P<0.05. B, Colony forming ability of MDA-MB-231 cells treated with OSM or IL31 or their combination as in (A) was assessed on 14th day after treatment. Colonies were stained using crystal violet and photographed. Bar graph shows the OD of crystal violet eluted from the colonies measured at 560nm. C, MDA-MB-231 cells were treated as in (A), and the wound healing capacity was monitored at indicated time points. Red line indicates the empty space between healing cells. Scale bars represent 500 μm. D, MDA-MB-231 cells were treated as in (A), and the invaded or migrated cells through matrigel coated or non-coated trans-well inserts were monitored and photographed. Scale bars represent 500 μm. Bar graph shows the OD of the crystal violet eluted measured at 560 nm. E, MDA-MB-231 cells were treated with OSM and IL31. Lysates were prepared at indicated time points and immunoblot was performed using indicated antibodies. F, Total RNA was isolated 48h after the treatment of chemokines as in (E) and qPCR was performed to quantitate the expression of indicated genes. mRNA expression was normalized to β-Actin. Bars represent mean ± S.E. Statistical analysis was done by Student’s t test. G-J, OSM-family gene transcripts were quantitated in the primary tumors versus normal breast tissues collected from mammoplasty reduction surgery. P-values were determined by Wilcoxon test. K-L, OSM and IL31 transcripts were quantitated in the normal breast tissues, Ductal carcinoma in situ (DCIS) and invasive breast cancers (IBC). P-values were determined by Student’s t-test. Due to low sample numbers in the normal group, we excluded normal group from our analysis. M, OSM expression in different molecular subtypes of breast cancer in the TCGA dataset plotted using UALCAN portal (Chandrashekar et al., 2017). N, Kaplan–Meier analysis of ER-Negative breast cancer patients whose samples were stratified as high vs. low based on median expression of OSM (226621_at) using KM survival analysis plotter (Gyorffy et al., 2010).
Figure 7.
Figure 7.. Therapeutic targeting of miR551b-3p reduces breast cancer cell growth in vivo.
A, Schema of the experimental design and treatment schedule for in vivo study. MDA-MB-231 cells (2×10⁶ cells/animal) were injected into the mammary fat pad of female athymic nude mice (age: 4 to 6 weeks, n = 7/group). Mice were treated with control (Con.) anti-miR or anti-miR551b-3p incorporated in DOPC nanoliposomes twice weekly until any of the mice became moribund. B–C, Tumors were isolated at the end of the experiments, representative tumors were photographed, and tumor weight quantitated. D, Tumor volume calculated twice in a week up to the end of the experiments (6.5 weeks). Bars represent SE of seven mice per group. *P < 0.05 determined by Student’s t-test compared between respective time point. E–F, Total RNA was extracted from tumor samples (n=3) from each group and qPCR was performed to quantitate the expression of miR551b-3p and the effector genes. miR551b-3p expression was normalized to U6 RNA and the mRNAs were normalized to ß-actin, respectively. G, Representative tumor tissues from four different mice were isolated, lysed, and immunoblotted. H, Representative H&E and immunohistochemistry analysis using tumor tissues from (A) were performed. Scale bars represent 150 μm. Bar graph represents the percentage of Ki67 and cleaved caspase-3 in the indicated groups. Error bar indicates the SE from mean value calculated from five random fields. I, Serum samples collected from the blood from each group at the end of experiment and ELISA was performed to determine the levels of OSM and IL31. Bars represent SE and P values were determined by Student’s t test. J, Model depicts how miR551b-3p-STAT3 axis activates the feedforward signaling through IL31 or OSM for tumor growth, cancer stemness, and EMT.

References

    1. Agarwal S, Parashar D, Gupta N, Jagadish N, Thakar A, Suri V, Kumar R, Gupta A, Ansari AS, Lohiya NK, and Suri A (2014). Sperm associated antigen 9 (SPAG9) expression and humoral response in benign and malignant salivary gland tumors. Oncoimmunology 3, e974382. - PMC - PubMed
    1. Amit I, Citri A, Shay T, Lu Y, Katz M, Zhang F, Tarcic G, Siwak D, Lahad J, Jacob-Hirsch J, et al. (2007a). A module of negative feedback regulators defines growth factor signaling. Nat Genet 39, 503–512. - PubMed
    1. Amit I, Wides R, and Yarden Y (2007b). Evolvable signaling networks of receptor tyrosine kinases: relevance of robustness to malignancy and to cancer therapy. Mol Syst Biol 3, 151. - PMC - PubMed
    1. Anjali G, Kaur S, Lakra R, Taneja J, Kalsey GS, Nagendra A, Shrivastav TG, Devi MG, Malhotra N, Kriplani A, and Singh R (2015). FSH stimulates IRS-2 expression in human granulosa cells through cAMP/SP1, an inoperative FSH action in PCOS patients. Cell Signal 27, 2452–2466. - PubMed
    1. Arpin CC, Mac S, Jiang Y, Cheng H, Grimard M, Page BD, Kamocka MM, Haftchenary S, Su H, Ball DP, et al. (2016). Applying Small Molecule Signal Transducer and Activator of Transcription-3 (STAT3) Protein Inhibitors as Pancreatic Cancer Therapeutics. Mol Cancer Ther 15, 794–805. - PMC - PubMed

Publication types

MeSH terms