. 2019 Dec 24;29(13):4509-4524.e5.
doi: 10.1016/j.celrep.2019.11.102.

TNFR2 Signaling Enhances ILC2 Survival, Function, and Induction of Airway Hyperreactivity

Affiliations

TNFR2 Signaling Enhances ILC2 Survival, Function, and Induction of Airway Hyperreactivity

Benjamin P Hurrell et al. Cell Rep. .

Abstract

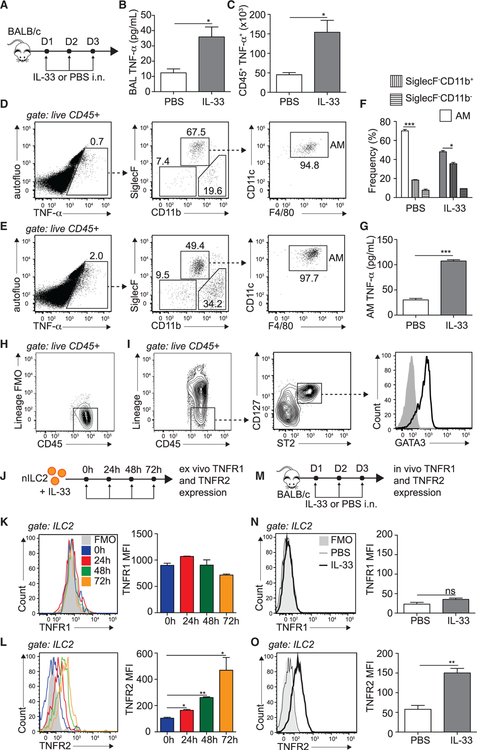
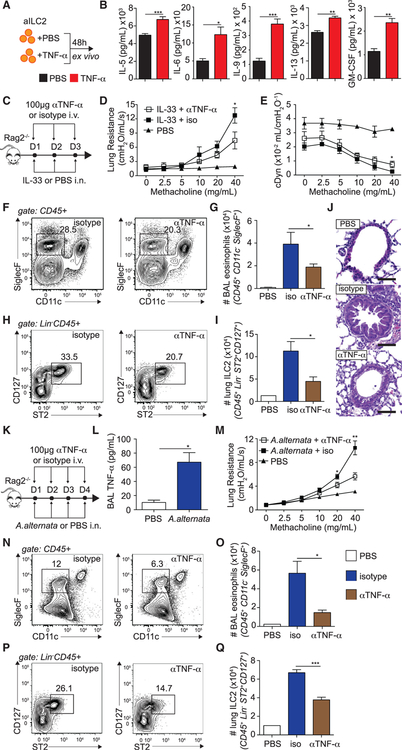
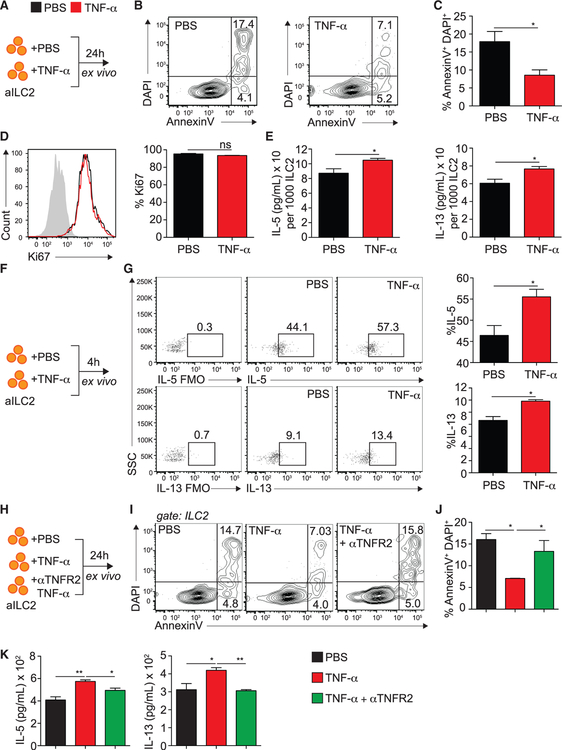
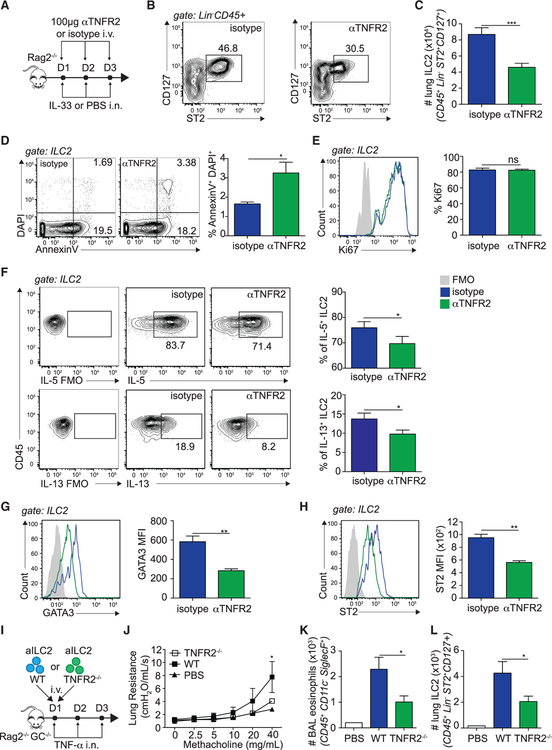
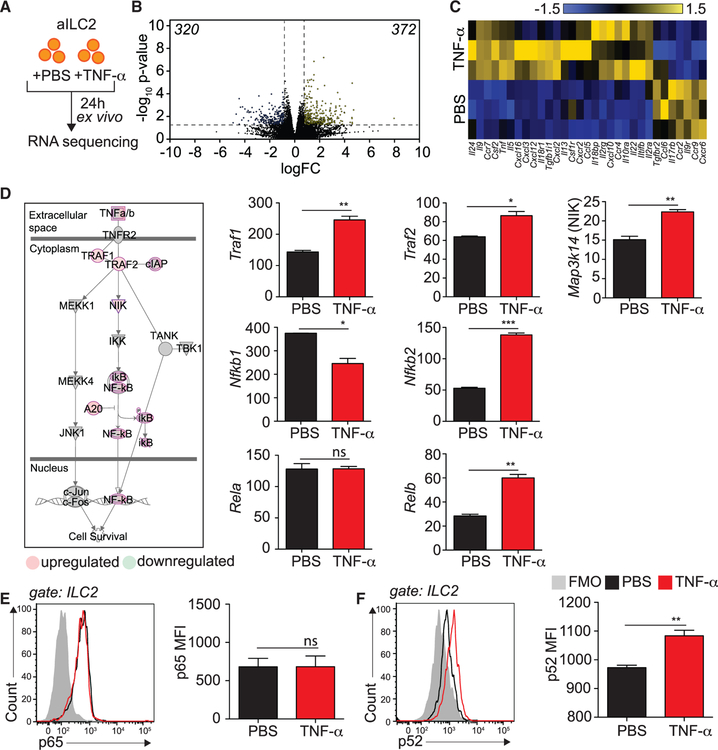
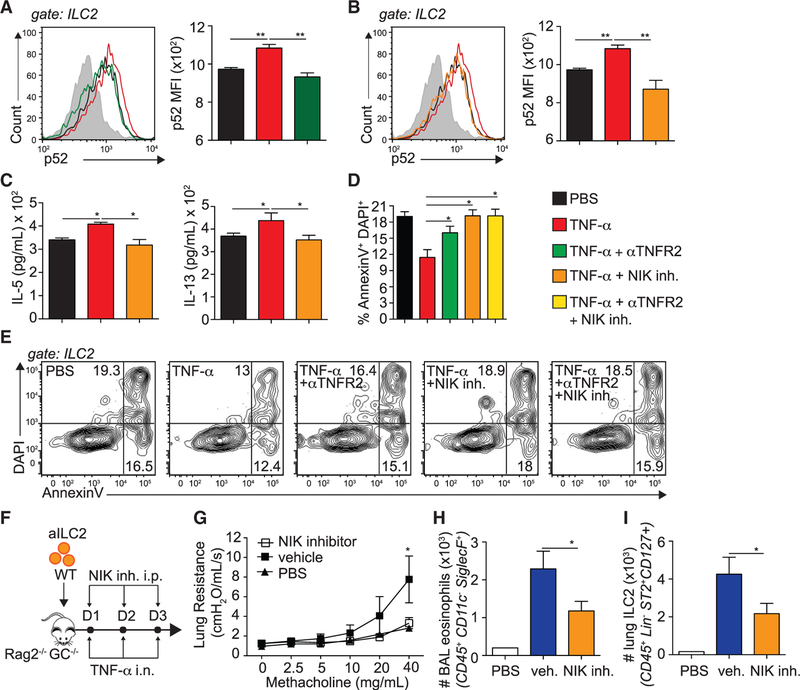
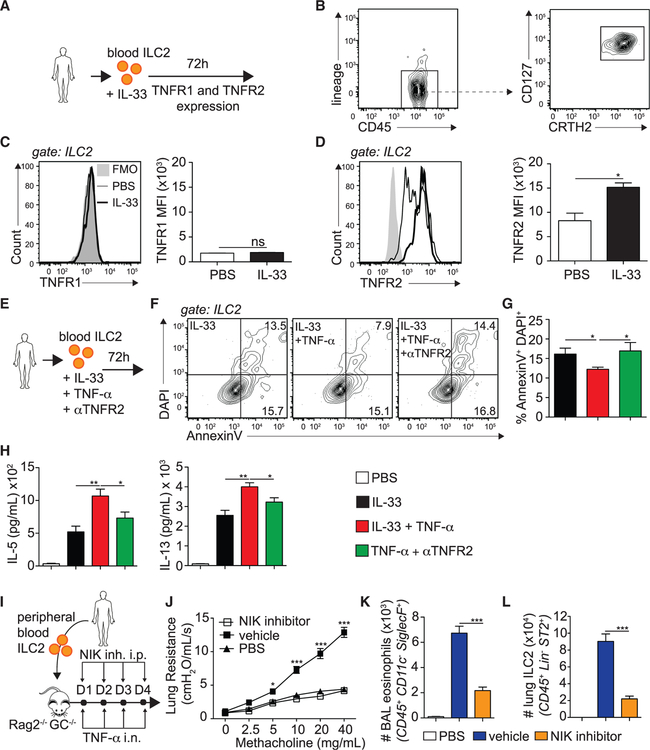
Group 2 innate lymphoid cells (ILC2s) can initiate pathologic inflammation in allergic asthma by secreting copious amounts of type 2 cytokines, promoting lung eosinophilia and airway hyperreactivity (AHR), a cardinal feature of asthma. We discovered that the TNF/TNFR2 axis is a central immune checkpoint in murine and human ILC2s. ILC2s selectively express TNFR2, and blocking the TNF/TNFR2 axis inhibits survival and cytokine production and reduces ILC2-dependent AHR. The mechanism of action of TNFR2 in ILC2s is through the non-canonical NF-κB pathway as an NF-κB-inducing kinase (NIK) inhibitor blocks the costimulatory effect of TNF-α. Similarly, human ILC2s selectively express TNFR2, and using hILC2s, we show that TNFR2 engagement promotes AHR through a NIK-dependent pathway in alymphoid murine recipients. These findings highlight the role of the TNF/TNFR2 axis in pulmonary ILC2s, suggesting that targeting TNFR2 or relevant signaling is a different strategy for treating patients with ILC2-dependent asthma.

Keywords: ILC2; NIK; NIK inhibitor; TNF-a; TNFR2; activation; airway hyperreactivity; asthma.


Conflict of interest statement

DECLARATION OF INTERESTS

The authors declare no competing interests.

Figures

Figure 1.
Figure 1.. IL-33 Promotes TNF-α Secretion and TNFR2 Expression on ILC2s
(A) BALB/cByJ mice were challenged i.n. on days 1–3 with 0.5 μg rmIL-33 or PBS. (B) On day 4, BAL fluid was collected, and supernatant TNF-α was measured by ELISA. (C) Number of TNF-α-producing CD45+ lung cells on day 4, cultured for 4 h with GolgiPlug. (D–F) Representative flow cytometry plots in naive (D) and activated (E) lungs of CD45+ TNF-α+ cells backgated for AMs (CD45+ SiglecF+ CD11b, CD11c+, and F4/80+) and SiglecFCD11b+ and SiglecFCD11b populations and (F) corresponding quantitation presented as mean frequency ± SEM. (G) AMs were FACS sorted from PBS- or rmIL-33-challenged mice on day 4 and cultured for 24 h in vitro (106 AMs/well), and supernatant TNF-α was measured by ELISA. (H and I) Gating strategy for murine ILC2s showing (H) lineage staining and (I) lineageCD45+ CD127+ ST2+ GATA-3hi ILC2s. (J) nILC2s were FACS sorted from naive BALB/cByJ mice and cultured (50 × 104/mL) ex vivo in the presence of rmIL-2 (10 ng/mL), rmIL-7 (10 ng/mL), and rmIL-33 (50 ng/mL) for the indicated times. nILC2s were gated as lineage CD45+ ST2+ CD127+. (K and L) Representative flow cytometry plot of TNFR1 (K) and TNFR2 (L) expression and corresponding quantitation, presented as Mean Fluorescence Intensity (MFI) ± SEM. (M) BALB/cByJ mice were challenged i.n. on days 1–3 with 0.5 μg rmIL-33 or PBS. (N and O) Representative flow cytometry plot of lung ILC2 expression of TNFR1 (N) and TNFR2 (O) expression on day 4 and corresponding quantitation, presented as MFI ± SEM. Data are representative of 4 individual experiments (n = 5). *p < 0.05, **p < 0.01, ***p < 0.001; ns, non-significant. See also Figure S1.
Figure 2.
Figure 2.. aILC2s and TNF-α Promote Development of AHR
(A) BALB/cByJ mice were challenged i.n. on days 1–3 with 0.5 μg rmIL-33. On day 4, aILC2s were FACS sorted as lineage CD45+ ST2+ CD127+ and cultured ex vivo (50 × 104/mL) for 48 h with rmIL-2 (10 ng/mL) and rmIL-7 (10 ng/mL) with or without recombinant mouse (rm) TNF-α (40 ng/mL). (B) Levels of IL-5, IL-6, IL-9, IL-13, and GM-CSF in culture supernatants. (C) Rag2−/− mice received i.v. injections of 100 μg αTNF-α or an isotype control and 0.5 αg rmIL-33 or PBS i.n. on days 1–3. On day 4, lung function, BAL eosinophils, lung ILC2s, and histology were analyzed. (D and E) Lung resistance (D) and dynamic compliance (E) in response to increasing doses of methacholine. (F and H) Representative FACS plots of BAL eosinophils (F) and lung ILC2s (H). Eosinophils were gated as CD45+, SiglecF+ CD11c and ILC2s as lineage CD45+ ST2+ CD127+. (G and I) Total number of eosinophils in the BAL fluid (G) and of ILC2s in the lungs (I), presented as mean numbers ± SEM. (J) Lung histology. Scale bars, 50 μm. (K) Rag2−/− mice received i.v. injections of 100 μg αTNF-α or an isotype control and 100 μg A. alternata or PBS i.n. on days 1–4. On day 5, lung function, BAL eosinophils, and lung ILC2s were analyzed. (L) BAL fluid was collected, and supernatant TNF-α was measured by ELISA. (M) Lung resistance in response to increasing doses of methacholine. (N and P) Representative FACS plots of BAL eosinophils (N) and lung ILC2s (P). (O and Q) Total number of eosinophils in the BAL fluid (O) and of ILC2s in the lungs (Q), presented as mean numbers ± SEM. Data are representative of 3 individual experiments (n = 5). *p < 0.05, **p < 0.01, ***p < 0.001. See also Figures S2 and S4.
Figure 3.
Figure 3.. TNF-α Enhances ILC2 Survival and Activation via TNFR2
(A) BALB/cByJ mice were challenged i.n. on days 1–3 with 0.5 μg rmIL-33. On day 4, aILC2s were FACS sorted as lineage CD45+ ST2+ CD127+ and cultured ex vivo (50 × 104/mL) for 24 h with rmIL-2 (10 ng/mL) and rmIL-7 (10 ng/mL) with or without rmTNF-α (40 ng/mL). (B) Representative flow cytometry plots of AnnexinV and DAPI expression on cultured ILC2s. (C) Frequency of AnV+DAPI+ ILC2s ± SEM on cultured ILC2s. (D) Representative flow cytometry plots of intranuclear Ki67-expressing ILC2s among cultured ILC2s and corresponding quantitation, presented as mean frequency ± SEM. (E) Levels of IL-5 and IL-13 in cultured supernatants, measured by ELISA and normalized to the number of viable cells after culture. (F) BALB/cByJ mice were challenged i.n. on days 1–3 with 0.5 μg rmIL-33. On day 4, aILC2s were FACS sorted as lineage CD45+ ST2+ CD127+ and cultured ex vivo (50 × 104/mL) for 4 h with rmIL-2 (10 ng/mL) and rmIL-7 (10 ng/mL) with or without rmTNF-α (40 ng/mL) and GolgiPlug. (G) Intracellular expression of IL-5 and IL-13 in cultured ILC2s and corresponding quantitation, presented as mean frequency ± SEM. (H) BALB/cByJ mice were challenged i.n. on days 1–3 with 0.5 μg rmIL-33. On day 4, aILC2s were FACS sorted as lineage CD45+ ST2+ CD127+ and cultured in vitro for 24 h with rmIL-2 (10 ng/mL) and rmIL-7 (10 ng/mL) with or without rmTNF-α (40 ng/mL) and αTNFR2 (10 μg/mL). αTNFR2 was added 30 min prior to rmTNF-α. (I) Representative flow cytometry plots of AnnexinV/DAPI expression on cultured ILC2s. (J) Frequency of AnV+DAPI+ ILC2s ± SEM on cultured ILC2s. (K) Levels of IL-5 and IL-13 in culture supernatants, measured by ELISA. Data are representative of 4 individual experiments (n = 5). *p < 0.05, **p < 0.01. See also Figure S3.
Figure 4.
Figure 4.. TNF-α, via TNFR2 Signaling, Enhances ILC2 Survival and Activation In Vivo
(A) Rag2−/− mice received i.v. injections of 100 μg αTNFR2 or an isotype control and 0.5 μg rmIL-33 or PBS i.n. on days 1–3. On day 4, lung ILC2 numbers, proliferation, and apoptosis were measured. (B) Representative flow cytometry plots of lung ILC2s in isotype control- or αTNFR2-treated mice. ILC2s were gated as lineage CD45+ ST2+ CD127+. (C) Total number of lung ILC2s, presented as mean numbers ± SEM. (D and E) Representative flow cytometry plots of AnnexinV/DAPI (D) and intranuclear Ki67 expression (E) with corresponding quantitation, presented as frequency of Ki67+ ILC2s ± SEM (D) and AnV+DAPI+ ILC2s ± SEM (E). (F) Representative flow cytometry plots of intracellular IL-5 and IL-13 expression by lung ILC2s cultured for 4 h with phorbol 12-myristate 13-acetate (PMA), ionomycin, and GolgiPlug and corresponding quantitation, presented as mean frequency ± SEM. (G) Representative flow cytometry plots of intranuclear GATA-3 in lung ILC2s (CD45+LinST2+CD127+) and corresponding quantitation, presented as MFI ± SEM. (H) Representative flow cytometry plots of ST2 expression in GATA-3+ ILC2s and corresponding quantitation, presented as mean MFI ± SEM. (I) C57BL/6 and TNFR2−/− mice were challenged i.n. on days 1–3 with 0.5 μg rmIL-33. On day 4, aILC2s were FACS sorted as lineage CD45+ ST2+ CD127+ and cultured in vitro for 3 days with rmIL-2 (10 ng/mL), rmIL-7 (10 ng/mL), and rmIL-33 (50 μg/mL) prior to transfer of 50 × 103 aILC2s in 2 separate cohorts of Rag−/− Il2rg−/− mice, followed by i.n. administration of 50 ng rmTNF-α on days 1–3. On day 4, lung function, BAL, and lung ILC2s were analyzed. (J) Lung resistance in response to increasing doses of methacholine. (K) Total number of eosinophils in the BAL fluid, presented as mean numbers ± SEM. (L) Total number of ILC2s in the lungs, presented as mean numbers ± SEM. Data are representative of 3 individual experiments (n = 4–5). *p < 0.05, **p < 0.01. See also Figures S4–S6.
Figure 5.
Figure 5.. TNFR2 Engagement on ILC2s Induces the Non-canonical NF-κB Pathway
(A) BALB/cByJ mice were challenged i.n. on days 1–3 with 0.5 μg rmIL-33. On day 4, aILC2s were FACS sorted as lineage, CD45+ ST2+ CD127+ and cultured in vitro for 24 h with rmIL-2 (10 ng/mL) and rmIL-7 (10 ng/mL) with or without rmTNFα (40 ng/mL). (B) Volcano plot comparison of whole-transcriptome gene expression on ILC2s from PBS-versus rmTNF-α—stimulated ILC2s. Differentially downregulated or upregulated genes (p < 0.05 and 2-fold change cutoff) are presented in blue and yellow, respectively. (C) Heatmap representation of statistically differentially regulated cytokines, chemokines, and their receptors in ILC2s from PBS-versus rmTNF-α-stimulated ILC2s. (D) Upregulated (red) and downregulated (green) genes in the non-canonical NF-κB pathway and corresponding quantitation, presented as normalized counts ± SEM. (E and F) Representative flow cytometry plots of NF-κB p65 (E) and NF-κB p52 (F) and corresponding quantitation, presented as MFI ± SEM in rmTNF-α-versus PBS-treated ILC2s. Data are representative of 3 individual experiments (n = 3–5). *p < 0.05, **p < 0.01, ***p < 0.001.
Figure 6.
Figure 6.. TNF-α Signaling via NIK Enhances ILC2-Dependent AHR
(A–E) BALB/cByJ mice were challenged i.n. on days 1–3 with 0.5 μg rmIL-33. On day 4, aILC2s were FACS sorted as lineage CD45+ ST2+ CD127+ and cultured ex vivo for 24 h with rmIL-2 (10 ng/mL) and rmIL-7 (10 ng/mL) with or without rmTNF-α (40 ng/mL), αTNFR2 (10 μg/mL), or NIK inhibitor (10 μM). αTNFR2 and the NIK inhibitor were added 30 min prior to rmTNF-α. (A and B) NF-κB p52 representative flow cytometry plots in TNFR2 (A) and NIK (B) blocking experiments on ILC2s and corresponding quantitation, presented as MFI ± SEM. (C) Levels of IL-5 and IL-13 secretion in culture supernatants, measured by ELISA. (D) Frequency of AnnexinV+DAPI+ late apoptotic/necrotic ILC2s, presented as mean frequency ± SEM. (E) Representative flow cytometry plots of AnnexinV+DAPI+ late apoptotic/necrotic ILC2s. (F) C57BL/6 mice were challenged i.n. on days 1–3 with 0.5 μg rmIL-33. On day 4, aILC2s were FACS sorted as lineage, CD45+ ST2+ CD127+ and cultured ex vivo for 3 days with rmIL-2 (10 ng/mL), rmIL-7 (10 ng/mL), and rmIL-33 (50 μg/mL) prior to transfer of 50 × 103 aILC2s in 2 separate cohorts of Rag−/− Il2rg−/− mice, followed by i.n. administration of 50 ng rmTNF-α and i.p. injection of 250 μg NIK inhibitor or vehicle on days 1–3. On day 4, lung function, BAL, and lung ILC2s were analyzed. (G) Lung resistance in response to increasing doses of methacholine. (H) Total number of eosinophils in the BAL fluid, presented as mean numbers ± SEM. (I) Total number of ILC2s in the lungs, presented as mean numbers ± SEM. Data are representative of 3 individual experiments (n = 5). *p < 0.05, **p < 0.01. See also Figure S3.
Figure 7.
Figure 7.. TNFR2 Signaling, via NIK Signaling, Enhances AHR in hILC2 Recipient Mice
(A) Human peripheral blood ILC2s were FACS sorted from human peripheral blood mononuclear cells (PBMCs) and cultured (5 × 10⁴/mL) for 72 h with rhIL-2 (10 ng/mL) and rhIL-7 (10 ng/mL) with or without rhIL-33 (50 ng/mL). (B) hILC2s were gated as CD45+ lineage CD127+ CRTH2+. (C and D) Representative flow cytometry plots of hTNFR1 (C) and hTNFR2 (D) expression in hILC2s and corresponding quantitation, presented as MFI ± SEM. (E) FACS-sorted hILC2s were cultured (5 × 10⁴/mL) for 72 h with rhIL-2 (10 ng/mL) and rhIL-7 (10 ng/mL) with or without rhIL-33 (50 ng/mL) or αTNFR2 (10 μg/mL). αTNFR2 was added 30 min prior to rhTNF-α. (F) Representative flow cytometry plots of AnnexinV/DAPI expression on cultured hILC2s. (G) Frequency of AnV+DAPI+ ILC2s ± SEM on cultured hILC2s. (H) Levels of IL-5 and IL-13 secretion in culture supernatants, measured by ELISA. (I) FACS-sorted hILC2s were cultured (5 × 10⁴/mL) for 72 h with rhIL-2 (10 ng/mL), rhIL-7 (10 ng/mL), and rhIL-33 (50 ng/mL) in vitro for 3 days prior to transfer of 50 × 103 ILC2s in 2 separate cohorts of Rag−/− Il2rg−/− mice, followed by i.n. administration of 50 ng rhTNF-α and i.p. injection of 250 μg NIK inhibitor or vehicle on days 1–4. On day 5, lung function, BAL, and lung ILC2s were analyzed. (J) Lung resistance in response to increasing doses of methacholine. (K) Total number of eosinophils in the BAL, presented as mean numbers ± SEM. (L) Total number of ILC2s in the lungs, presented as mean numbers ± SEM. Data are representative of 4 individual donors. *p < 0.05, **p < 0.01, ***p < 0.001. See also Figure S3.

Similar articles

Cited by

References

    1. Aggarwal BB (2003). Signalling pathways of the TNF superfamily: a doubleedged sword. Nat. Rev. Immunol 3, 745–756. - PubMed
    1. Aggarwal BB, Gupta SC, and Kim JH (2012). Historical perspectives on tumor necrosis factor and its superfamily: 25 years later, a golden journey. Blood 119, 651–665. - PMC - PubMed
    1. Ali T, Kaitha S, Mahmood S, Ftesi A, Stone J, and Bronze MS (2013). Clinical use of anti-TNF therapy and increased risk of infections. Drug Healthc. Patient Saf 5, 79–99. - PMC - PubMed
    1. Anticevich SZ, Hughes JM, Black JL, and Armour CL (1995). Induction of human airway hyperresponsiveness by tumour necrosis factor-alpha. Eur. J. Pharmacol 284, 221–225. - PubMed
    1. Barlow JL, Peel S, Fox J, Panova V, Hardman CS, Camelo A, Bucks C, Wu X, Kane CM, Neill DR, et al. (2013). IL-33 is more potent than IL-25 in provoking IL-13-producing nuocytes (type 2 innate lymphoid cells) and airway contraction. J. Allergy Clin. Immunol 132, 933–941. - PubMed

Publication types

MeSH terms

Substances

LinkOut - more resources