Randomized Controlled Trial
. 2020 Feb;578(7795):444-448.
doi: 10.1038/s41586-019-1911-y. Epub 2019 Dec 25.

GDF15 mediates the effects of metformin on body weight and energy balance

Affiliations
Randomized Controlled Trial

GDF15 mediates the effects of metformin on body weight and energy balance

Anthony P Coll et al. Nature. 2020 Feb.

Erratum in

  • Publisher Correction: GDF15 mediates the effects of metformin on body weight and energy balance.
    Coll AP, Chen M, Taskar P, Rimmington D, Patel S, Tadross JA, Cimino I, Yang M, Welsh P, Virtue S, Goldspink DA, Miedzybrodzka EL, Konopka AR, Esponda RR, Huang JT, Tung YCL, Rodriguez-Cuenca S, Tomaz RA, Harding HP, Melvin A, Yeo GSH, Preiss D, Vidal-Puig A, Vallier L, Nair KS, Wareham NJ, Ron D, Gribble FM, Reimann F, Sattar N, Savage DB, Allan BB, O'Rahilly S. Coll AP, et al. Nature. 2020 Feb;578(7796):E24. doi: 10.1038/s41586-020-2031-4. Nature. 2020. PMID: 32051582

Abstract

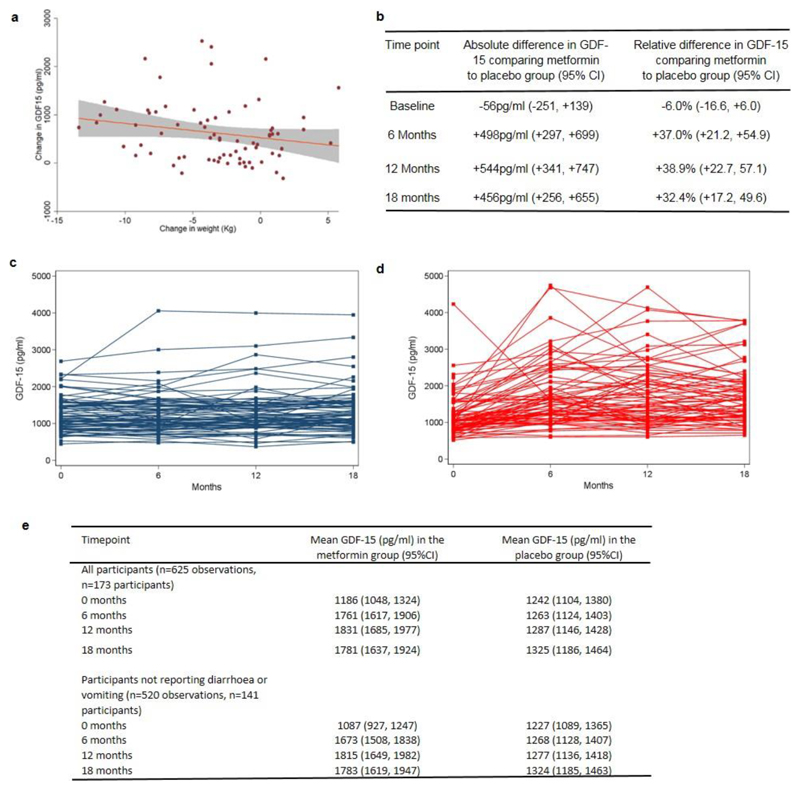
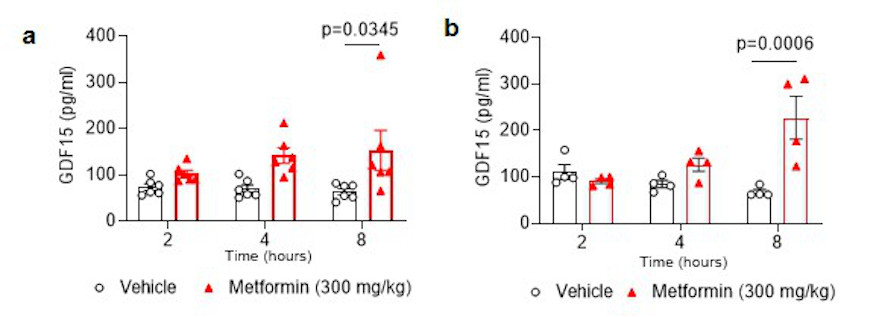
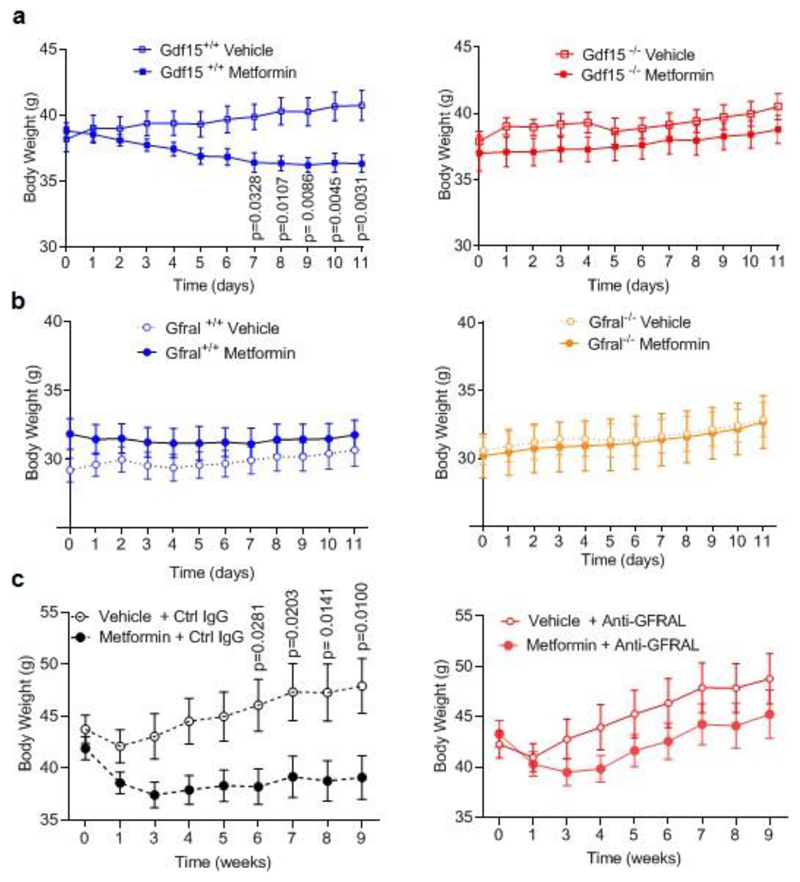
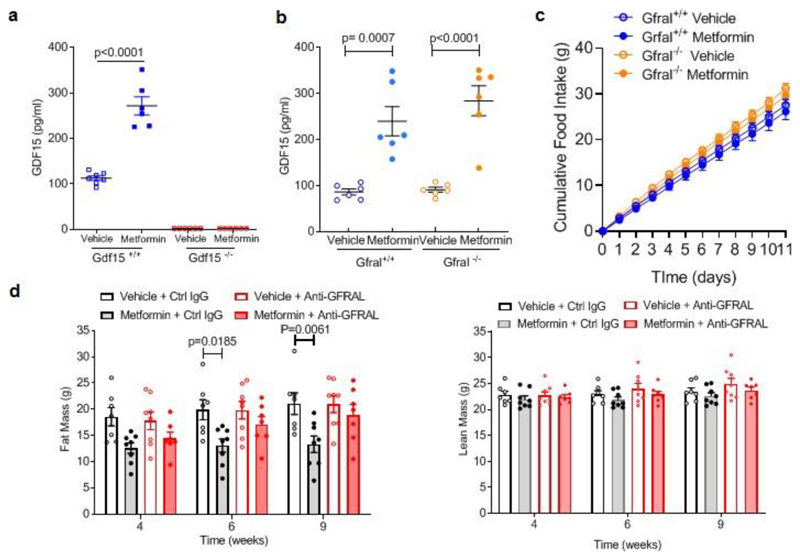
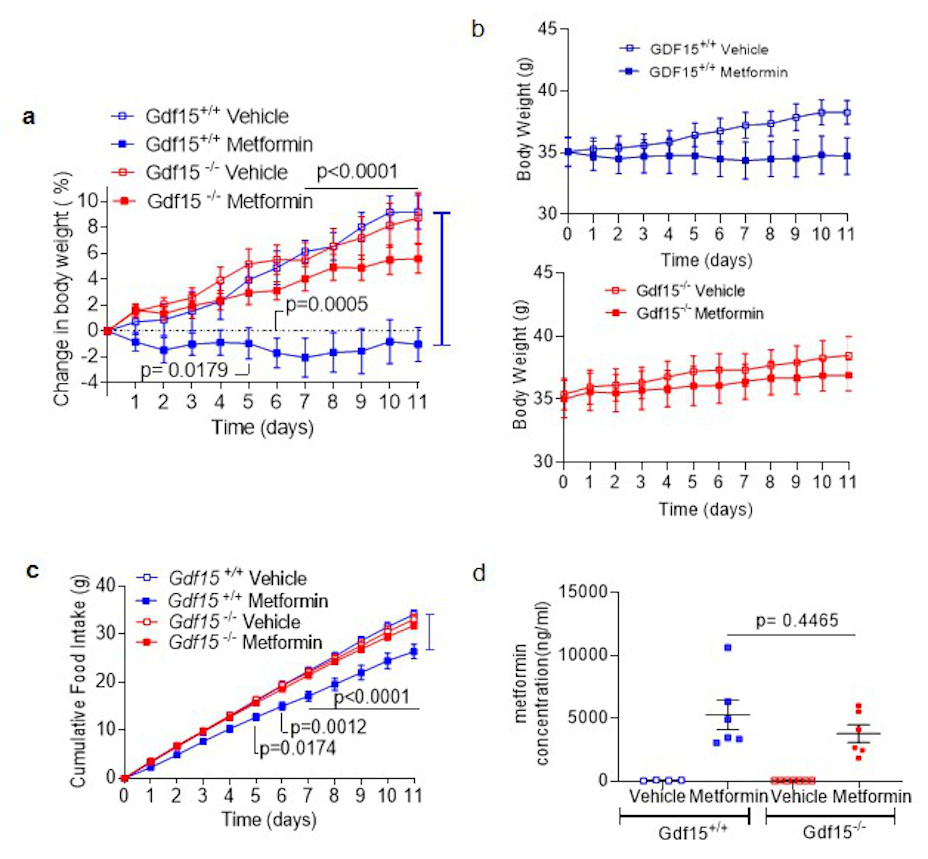
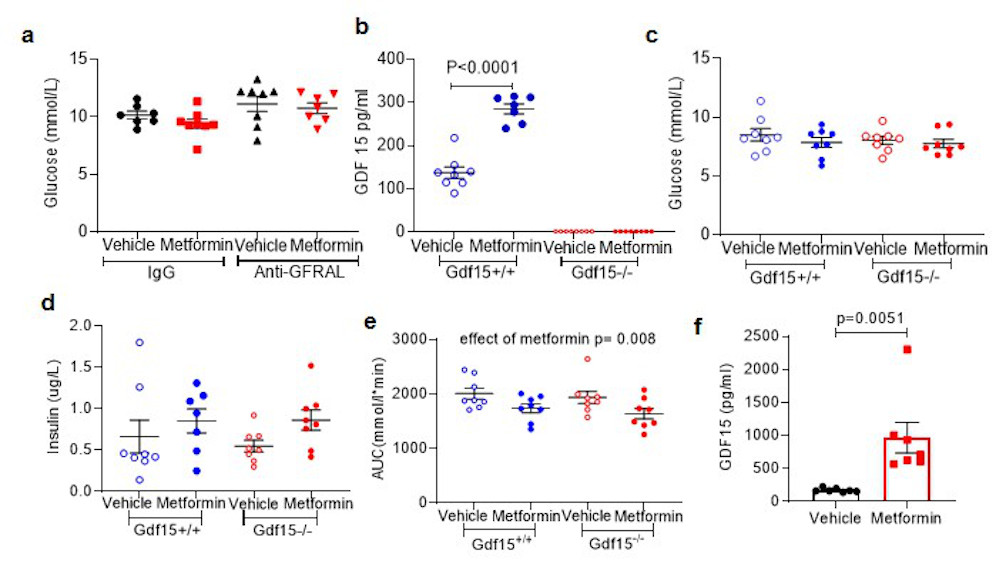
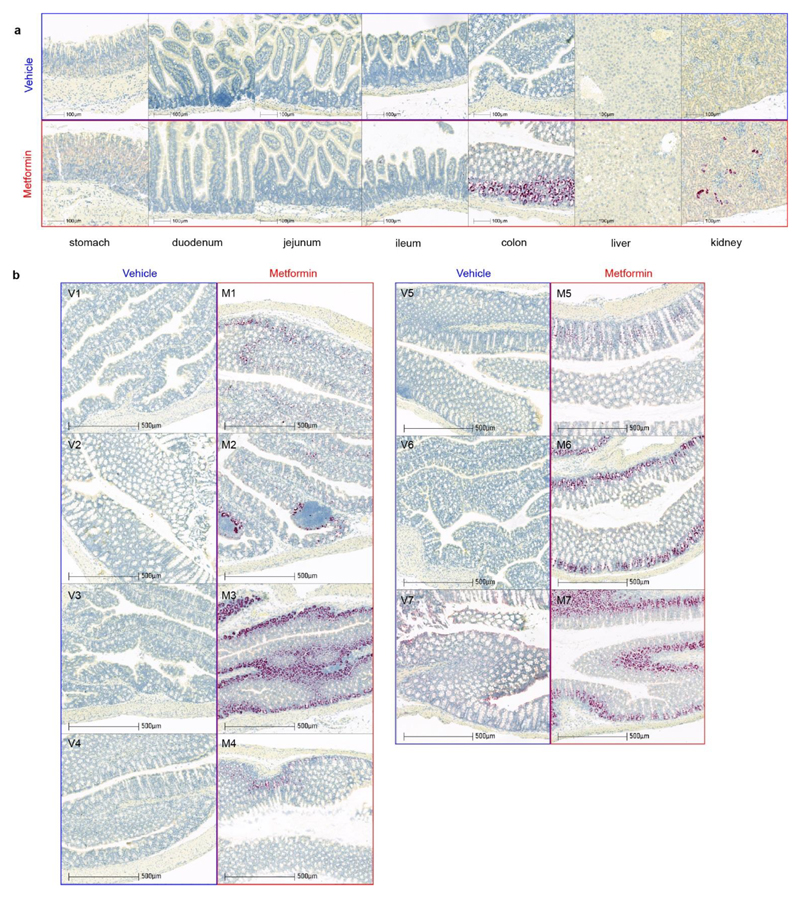
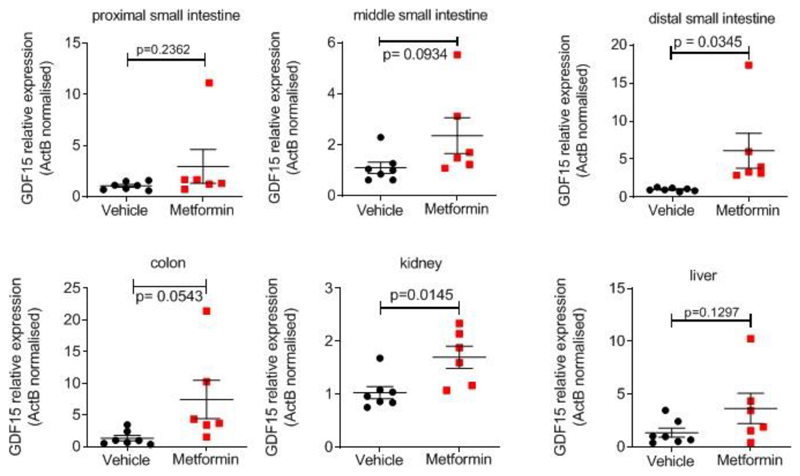
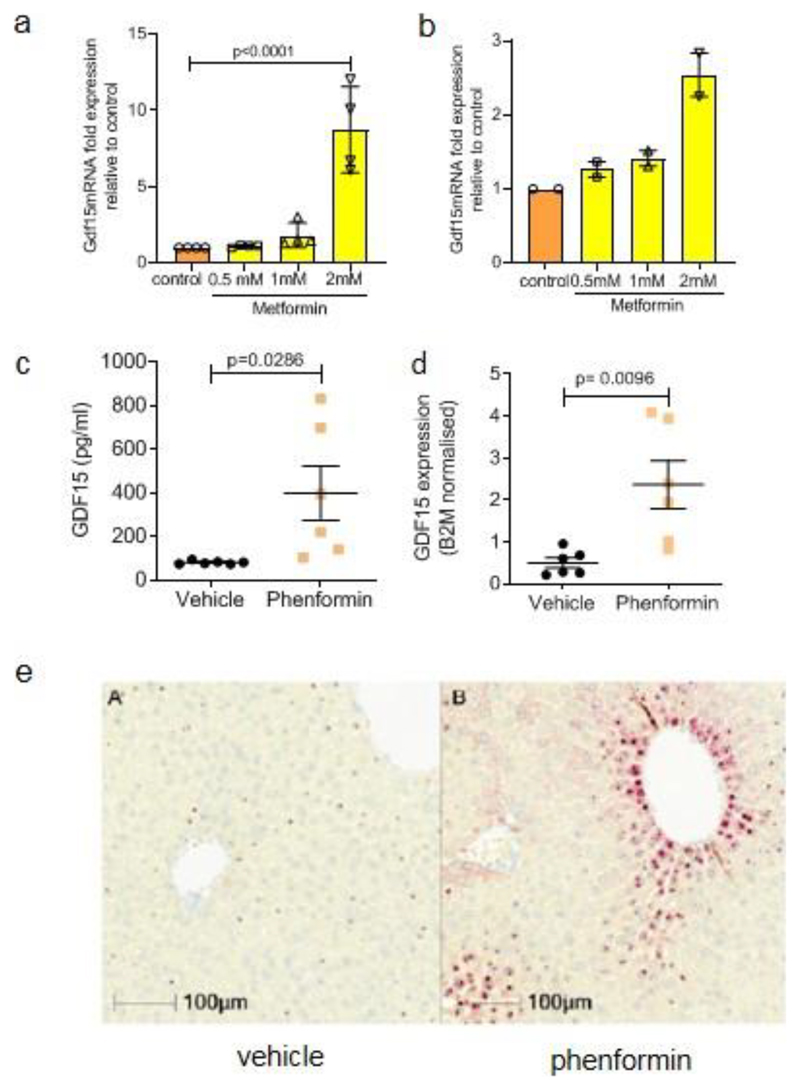
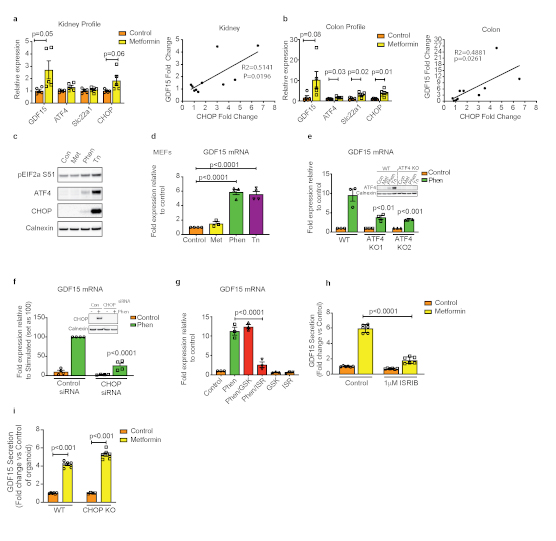
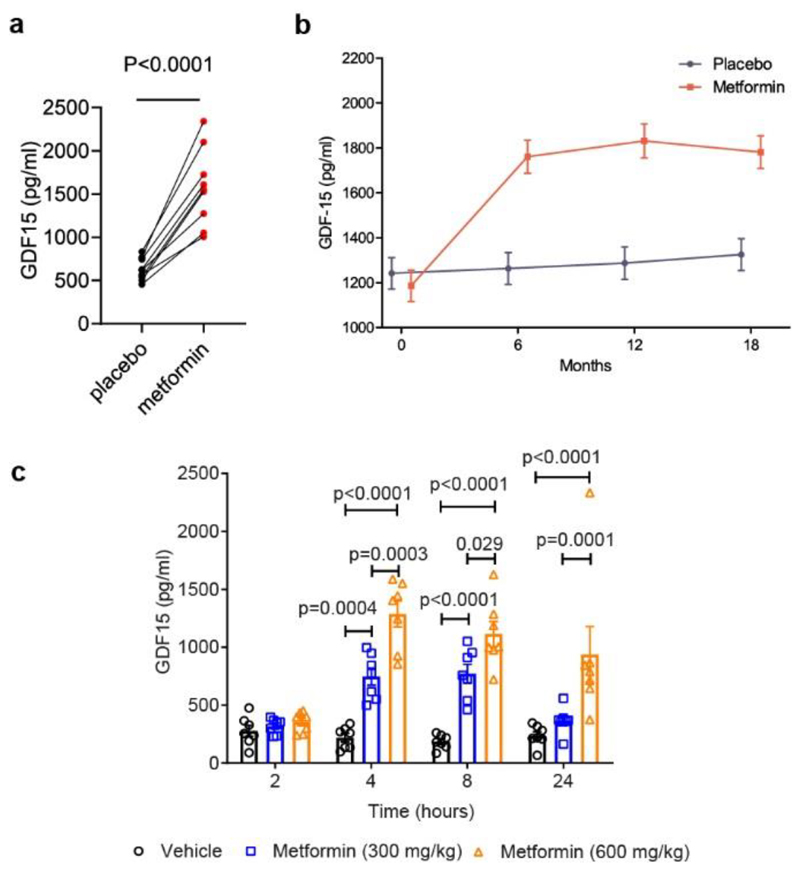
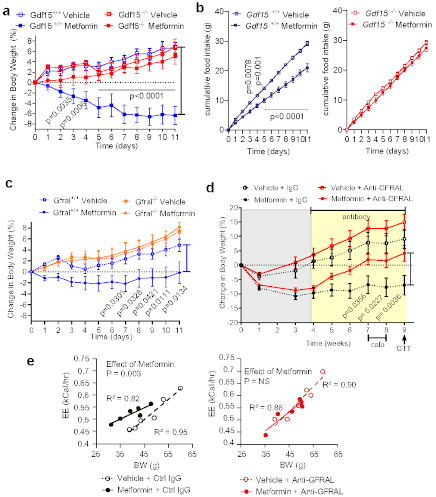
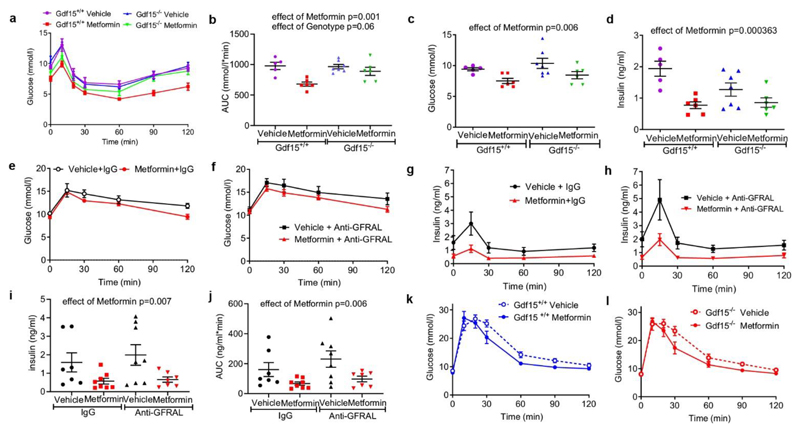
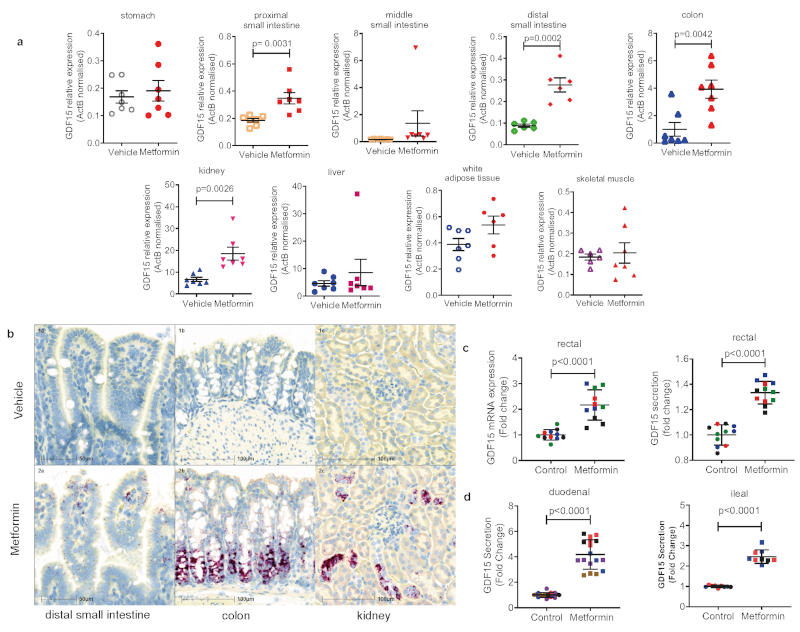
Metformin, the world's most prescribed anti-diabetic drug, is also effective in preventing type 2 diabetes in people at high risk1,2. More than 60% of this effect is attributable to the ability of metformin to lower body weight in a sustained manner3. The molecular mechanisms by which metformin lowers body weight are unknown. Here we show-in two independent randomized controlled clinical trials-that metformin increases circulating levels of the peptide hormone growth/differentiation factor 15 (GDF15), which has been shown to reduce food intake and lower body weight through a brain-stem-restricted receptor. In wild-type mice, oral metformin increased circulating GDF15, with GDF15 expression increasing predominantly in the distal intestine and the kidney. Metformin prevented weight gain in response to a high-fat diet in wild-type mice but not in mice lacking GDF15 or its receptor GDNF family receptor α-like (GFRAL). In obese mice on a high-fat diet, the effects of metformin to reduce body weight were reversed by a GFRAL-antagonist antibody. Metformin had effects on both energy intake and energy expenditure that were dependent on GDF15, but retained its ability to lower circulating glucose levels in the absence of GDF15 activity. In summary, metformin elevates circulating levels of GDF15, which is necessary to obtain its beneficial effects on energy balance and body weight, major contributors to its action as a chemopreventive agent.


Conflict of interest statement

All other authors declare no competing financial interests.

Figures

Extended Data Figure 1
Extended Data Figure 1. Expanded CAMERA data set.
a, Linear association between change in body weight and change in plasma GDF15 between 0 and 18 months among metformin treated participants (n=74, Spearman correlation r=-0.26, two-sided p=0.024). Red line is linear regression slope, and grey area is 95% confidence interval for slope. b, Absolute and relative differences in plasma GDF15 concentration between metformin and placebo groups at each time point (total 625 observations in 173 participants). c,d, Individual measures of plasma GDF15 levels in placebo group (c) and metformin group (d) over time. e, Plasma GDF15 concentration (95%CI) in overweight or obese non-diabetic participants with known cardiovascular disease randomised to metformin or placebo in CAMERA; modelled using a mixed linear model as per Figure 1 and grouped as “all participants” and “ all participants not reporting diarrhoea and vomiting”. Model includes all participants
Extended Data Figure 2
Extended Data Figure 2. Effect of single oral dose of metformin in chow fed mice.
Serum GDF15 levels in male mice measured 2, 4, or 8 hours after a single gavage dose of metformin (300mg/kg). a, mice ad libitum overnight fed prior to gavage. b, mice fasted for 12 hour prior to gavage. Data are mean ± SEM (a; n=6/group, b; n= 4/group); P by 2-way ANOVA with Tukeys correction for multiple comparisons.
Extended Data Figure 3
Extended Data Figure 3. Body weight changes with metformin treatment in mice with disrupted GDF15-GFRAL signalling.
a, Absolute body weight in Gdf15 +/+ and Gdf15 -/- mice on a high-fat diet treated with metformin (300mg/kg/day) for 11 days, mice as Figure 2a. Data are mean ± SEM, P by 2-way ANOVA with Tukey’s correction for multiple comparisons. b, Absolute body weight in high fat diet fed Gfral +/+ and Gfral -/- mice given oral dose of metformin (300mg/kg) once daily for 11 days, mice as Figure 2c. Data are mean ± SEM. c, Absolute body weight of metformin-treated, obese mice dosed with an anti-GFRAL antagonist antibody or with control IgG weekly for 5 weeks starting 4 weeks after initial metformin exposure, mice as Figure 2d. Data are mean ± SEM. P by 2-way ANOVA with Tukey’s correction for multiple comparisons.
Extended Data Figure 4
Extended Data Figure 4. Response of high fat diet fed Gdf15 -/- and Gfral -/- mice to metformin.
a, Circulating GDF15 levels in high fat diet fed Gdf15 +/+ and Gdf15 -/- mice given oral dose of metformin (300mg/kg) once daily for 11 days. Data are mean ± SEM, mice as Figure 2a. All samples from Gdf15 -/- were below lower limit of assay (< 2pg/ml), P value by 2-way ANOVA with Tukey’s correction for multiple comparisons. b, Circulating GDF15 levels in high fat diet fed Gfral +/+ and Gfral -/- mice given oral dose of metformin (300mg/kg) once daily for 11 days. Data are mean ± SEM, mice as Figure 2c, P by 2-way ANOVA with Tukey’s correction for multiple comparisons. c, Cumulative food intake in high fat diet fed Gfral +/+ and Gfral -/- mice on a high fat diet given oral dose of metformin (300mg/kg) once daily for 11 days. Data are mean ± SEM, mice as Figure 2c, non-significant difference vehicle vs metformin by 2W ANOVA. d, Fat mass (left panel) and lean mass (right panel) in metformin-treated obese mice dosed with an anti-GFRAL antagonist antibody, weekly for 5 weeks, starting 4 weeks after initial metformin exposure (mice as Figure 2d). Body composition was measured using MRI after 4 weeks of metformin exposure, prior to receiving anti-GFRAL (week 4), after 6 weeks of metformin exposure and 2 weeks after receiving anti-GFRAL (week 6) and after 9 weeks of metformin exposure and 5 weeks after receiving anti-GFRAL (week 9). Data are mean ± SEM (n=7 Vehicle + control IgG and Metformin + anti – GFRAL; n=8 other groups); P by 2-way ANOVA with Tukey’s correction for multiple comparisons.
Extended Data Figure 5
Extended Data Figure 5. Response of second, independent cohort of high-fat diet fed Gdf15 +/+ and Gdf15 -/- mice to metformin.
a,b,c, Percentage change in body weight (a), absolute body weight (b) and cumulative food intake (c) in Gdf15 +/+ and Gdf15 -/- mice on a high-fat diet treated with metformin (300mg/kg/day) for 11 days. Data are mean ± SEM (n=6/group, except Gdf15 -/- vehicle= 7), P by 2-way ANOVA with Tukey’s correction for multiple comparisons. d, Circulating metformin levels in mice 6 hrs after final dose of metformin on day 11. Data are mean ± SEM (n=6/group, except Gdf15 +/+ vehicle= 4, Gdf15 -/- vehicle= 7), P by 2-way ANOVA with Tukey’s correction for multiple comparisons.
Extended Data Figure 6
Extended Data Figure 6. Glucose, insulin and GDF15 response to metformin.
a, Fasting glucose from OGTT as Figure 3e and 3f. ANOVA analysis, effect of antibody p= 0.028, effect of metformin p= 0.271, interaction of antibody and metformin p 0.707. b, Circulating GDF15 in mice undergoing ipGTT post single dose metformin as Figure 3 k and 3l. P by 2-way ANOVA with Tukey’s correction for multiple comparisons. c,d, Fasting glucose (c) and fasting insulin (d)at time 0 of ipGTT as Figure 3 k and 3l, non-significant by 2-way ANOVA. e, AUC analysis of glucose levels as in Figure 3k and l. P by 2-way ANOVA, effect of genotype p= 0.392, interaction of genotype and metformin p= 0.883. f, Circulating GDF15 levels in high-fat diet fed Gdf15 +/+ mice after single oral dose of metformin (600mg/kg). Samples were collected 6 hours after dosing, data are mean ± SEM, (n=7/group), P value (95% confidence interval) by two tailed t-test.
Extended Data Figure 7
a, Representative images from the mouse with circulating GDF15 level closest to group median shown in Fig4b with images from other regions of the gut and from liver. b, In situ hybridization for Gdf15 mRNA expression (red spots) in colon. Tissue collected from high-fat fed wild type mice, 6 hrs after single dose of oral metformin (600mg/kg)(right side, red box, m1-m7) or vehicle gavage (left side, blue box, v1-v7), n=7/group, mice as Figure 4.
Extended Data Figure 8
Extended Data Figure 8. Analysis of Gdf15 mRNA expression (normalised to expression levels of ActB) in tissue from high fat diet fed Gdf15 +/+ mice.
Metformin dose (300mg/kg) once daily for 11 days (see Figure 2a). Data are mean ± SEM, n=6 metformin, n=7 vehicle, P value (95% confidence interval) by two tailed t-test.
Extended Data Figure 9
Extended Data Figure 9. Hepatic GDF15 response to biguanides.
a,b,Gdf15 mRNA expression in (a) primary mouse hepatocytes or (b) human iPSC derived hepatocytes treated with vehicle control (Con) or metformin for 6 h. mRNA expression is presented as fold expression relative to control treatment (set at 1), normalised to Hprt and GAPDH gene in mouse and human cells, respectively. Data are expressed as mean ± SEM from four (a) and two (b) independent experiments. P value (95% confidence interval) by 1 way ANOVA with Tukey’s correction for multiple comparisons. c,d, Circulating levels of GDF15 (c) and hepatic Gdf15 mRNA expression (d) (normalised toβ2 microglobulin) in chow fed, wild type mice 4 hrs after single oral dose of phenformin (300mg/kg). Data are mean ± SEM, n= 6/group, P value (95% confidence interval) by two tailed t-test. e, Representative image of in situ hybridization for Gdf15 mRNA expression (red spots) of fixed liver tissue derived from animals treated as described in (c) and (d).
Extended Data Figure 10
Extended Data Figure 10. Role of the Integrated Stress Response (ISR) in biguanide-induced Gdf15 expression
a,b, mRNA levels in kidney (a) and colon (b) isolated from obese mice 24 hours after a single oral dose of metformin (600mg/kg). Data are mean ± SEM (n=5/group). P values (95% confidence interval) by two tailed t-test. Gdf15 mRNA fold induction 24 hrs post metformin 600mgs/kg is positively correlated with CHOP mRNA induction in both kidney (a, right panel) and colon (b, right panel), black line= linear regression analysis. c-g, Immunoblot analysis of ISR components (c) and Gdf mRNA expression (d) in wild type MEFs (mouse embryonic fibroblasts) treated with vehicle control (Con), metformin (Met, 2 mM) or phenformin (Phen, 5 mM) or tunicamycin (Tn, 5 g/ml - used as a positive control) for 6 hrs. e, Gdf15 mRNA expression in ATF4 knockout (KO) MEFs or (f) in control siRNA and CHOP siRNA transfected wild type MEFs treated with Tn or Phen for 6 hrs or (g) in wild type MEFs pre-treated for 1 h either with the PERK inhibitor GSK2606414 (GSK, 200 nM) or eIF2α inhibitor ISRIB (ISR, 100 nM) then co-treated with Phen for a further 6 hrs. mRNA expression is presented as fold-expression relative to its respective control treatment (set at 1) or phen treated samples (set as 100) with normalisation to Hprt gene expression. Data are expressed as mean ± SEM from two for (c) and (d) and at least three independent experiments for (e-g). P value (95% confidence interval) by two tailed t-test relative to Phen treated control wild and control siRNA treated samples. h, GDF15 protein in supernatant of mouse derived 2D duodenal organoids treated with metformin in the absence or presence of ISRIB (1 μM). Data are expressed as mean ± SEM from two independent experiments. From each well, measurement of protein was at least in duplicate. P by 2 way ANOVA with Sidak’s correction for multiple comparisons. i, GDF15 protein in supernatants of mouse-derived 2D duodenal organoids from wild type and CHOP null mice treated with metformin from two independent experiments From each well, measurement of protein was at least in duplicate. Data are mean ± SEM, P value (95% confidence interval) by two-tailed t-test.
Figure 1
Figure 1. Effect of Metformin on circulating GDF15 levels in humans and mice.
a, Paired serum GDF15 concentration in 9 human subjects after 2 weeks of either placebo or metformin, P (95% confidence interval) by 2-tailed t-test. b, Plasma GDF15 concentration (mean± SEM) in overweight or obese non-diabetic participants with known cardiovascular disease randomised to metformin or placebo in CAMERA, using a mixed linear model. Subject numbers: placebo vs metformin, respectively, at time points: baseline, n=85 vs n=86; 6 months, n=81 vs n= 71;12 months, n=77 vs n=68; 18 months, n=83 vs n=74. Comparing metformin vs placebo groups, two-sided p=0.311 at baseline, and p<0.0001 at 6,12 and 18 months individually. c, Serum GDF15 levels (mean± SEM) in obese mice measured 2, 4, 8 or 24 hours after a single oral dose of 300 mg/kg or 600 mg/kg metformin, n=7/group, P by 2-way ANOVA with Tukey’s correction for multiple comparisons.
Figure 2
Figure 2. GDF15/GFRAL signalling is required for the weight loss effects of metformin on a high fat diet.
a, Percentage change in body weight of Gdf15+/+ and Gdf15-/- mice on a high-fat diet treated with metformin (300mg/kg/day) for 11 days, mean ± SEM, n=6/group except Gdf15+/+ vehicle n=7, P by 2-way ANOVA with Tukey’s correction for multiple comparisons. b, Cumulative food intake of mice as Figure 2a, P by 2-way ANOVA with Tukey’s correction for multiple comparisons. c, Percentage change in body weight of Gfral+/+ and Gfral-/- mice on a high-fat diet treated with metformin (300mg/kg/day) for 11 days, mean ± SEM, n=6/groups, P by 2-way ANOVA with Tukey’s correction for multiple comparisons. d, Percentage change in body weight of metformin-treated obese mice dosed with an anti-GFRAL antagonist antibody, weekly for 5 weeks (yellow), starting 4 weeks after initial metformin exposure (grey),mean ± SEM, n=7 Vehicle + control IgG and Metformin + anti –GFRAL, n=8 other groups, P by 2-way ANOVA with Tukey’s correction for multiple comparisons. “calo” = period in which energy expenditure measured (see Figure 2e), Arrow and “GTT”- timing of oral glucose tolerance test (see Figure 3e-h). e, ANCOVA analysis of energy expenditure against body weight of mice treated as in Figure 2d, n=6 mice/group. Data are individual mice and P for metformin calculated using ANCOVA with body weight as a covariate and treatment as a fixed factor.
Figure 3
Figure 3. Effects of metformin on glucose homeostasis.
a, Insulin tolerance test (ITT) (insulin=0.5 U/kg) after 11 days of metformin treatment (300mg/kg) to high fat fed Gdf15 +/+ and Gdf15 -/- mice, glucose levels are mean ± SEM, n=6/group, except Gdf15 -/- vehicle= 7, Gdf15+/+ vehicle= 5. b, Area under curve (AUC) analysis of glucose over time in Figure 3a, mean ± SEM, P by 2-way ANOVA, interaction of genotype and metformin p= 0.037. c, Fasting glucose (time 0) of ITT in Figure 3a, mean ± SEM, P by 2-way ANOVA, effect of genotype p= 0.144, interaction of genotype and metformin p= 0.988. d, Fasting insulin (time 0) of ITT in Figure 3a, mean ± SEM, P by 2-way ANOVA, effect of genotype p= 0.131, interaction of genotype and metformin p 0.056. e, f, Glucose over time after oral glucose tolerance test (GTT) in metformin treated obese mice given either IgG (e) or anti –GFRAL (f) once weekly for 5 weeks (as Figure 2d). AUC analysis by 2-way ANOVA, effect of antibody p= 0.031, effect of metformin p= 0.072, interaction of antibody and metformin p 0.91. g, h, Insulin (mean ± SEM) over time after GTT in mice as Figure 3e and f. i, Fasting insulin (time 0) of GTT in mice as Figure 3e and f, mean ± SEM, P by 2-way ANOVA, effect of antibody p= 0.544, interaction of genotype and metformin p 0.691. j, AUC analysis of insulin over time in Figure 3g and h, mean ± SEM, P by 2 -way ANOVA, effect of antibody p= 0.197, interaction of genotype and metformin p 0.607. k, l, Glucose (mean ± SEM) over time after intraperitoneal GTT in high fat fed mice given single dose of oral metformin (300mg/kg) 6 hrs before GTT, n=8/group.
Figure 4
Figure 4. Metformin increases GDF15 expression in the enterocytes of distal intestine and the renal tubular epithelial cells.
a, Gdf15 mRNA expression (normalised to expression levels of ActB) in tissues from high-fat fed wild type mice 6 hrs after single dose of oral metformin (600mg/kg), mean ± SEM, n=7/group, P value (95% confidence interval) by two tailed t-test. b, In situ hybridization for Gdf15 mRNA (red spots) n= 7 per group. Representative images from the mouse with circulating GDF15 level closest to group median, either vehicle-treated (panel 1a,1b,1c, blue box) or metformin-treated (panels 2a, 2b, 2c, red box). Mice from groups described in Figure 4a. c, Gdf15 mRNA expression (left panel) and GDF15 protein in supernatant (right panel) of human derived 2D monolayer rectal organoids treated with metformin. Each colour represents independent experiments (n= 4), mean ± SD, P value (95% confidence interval) by two-tailed t-test. d, GDF15 protein in supernatants of mouse-derived 2D monolayer duodenal (left panel) and ileal (right panel) organoids treated with metformin. Each colour represents independent experiment (duodenal n= 5, ileal n=3),mean ± SD, P value (95% confidence interval) by two-tailed t-test.

References

    1. Knowler WC, et al. Reduction in the incidence of type 2 diabetes with lifestyle intervention or metformin. N Engl J Med. 2002;346:393–403. doi: 10.1056/NEJMoa012512. - DOI - PMC - PubMed
    1. Ramachandran A, et al. The Indian Diabetes Prevention Programme shows that lifestyle modification and metformin prevent type 2 diabetes in Asian Indian subjects with impaired glucose tolerance (IDPP-1) Diabetologia. 2006;49:289–297. doi: 10.1007/s00125-005-0097-z. - DOI - PubMed
    1. Lachin JM, et al. Factors associated with diabetes onset during metformin versus placebo therapy in the diabetes prevention program. Diabetes. 2007;56:1153–1159. doi: 10.2337/db06-0918. - DOI - PMC - PubMed
    1. Rena G, Hardie DG, Pearson ER. The mechanisms of action of metformin. Diabetologia. 2017;60:1577–1585. doi: 10.1007/s00125-017-4342-z. - DOI - PMC - PubMed
    1. Apolzan JW, et al. Long-Term Weight Loss With Metformin or Lifestyle Intervention in the Diabetes Prevention Program Outcomes Study. Ann Intern Med. 2019 doi: 10.7326/M18-1605. - DOI - PMC - PubMed

Publication types

MeSH terms

Grants and funding