Review
. 2020 Feb;50(3):353-366.
doi: 10.1017/S0033291719003404. Epub 2019 Dec 26.

The network approach to psychopathology: a review of the literature 2008-2018 and an agenda for future research

Affiliations
Review

The network approach to psychopathology: a review of the literature 2008-2018 and an agenda for future research

Donald J Robinaugh et al. Psychol Med. 2020 Feb.

Abstract

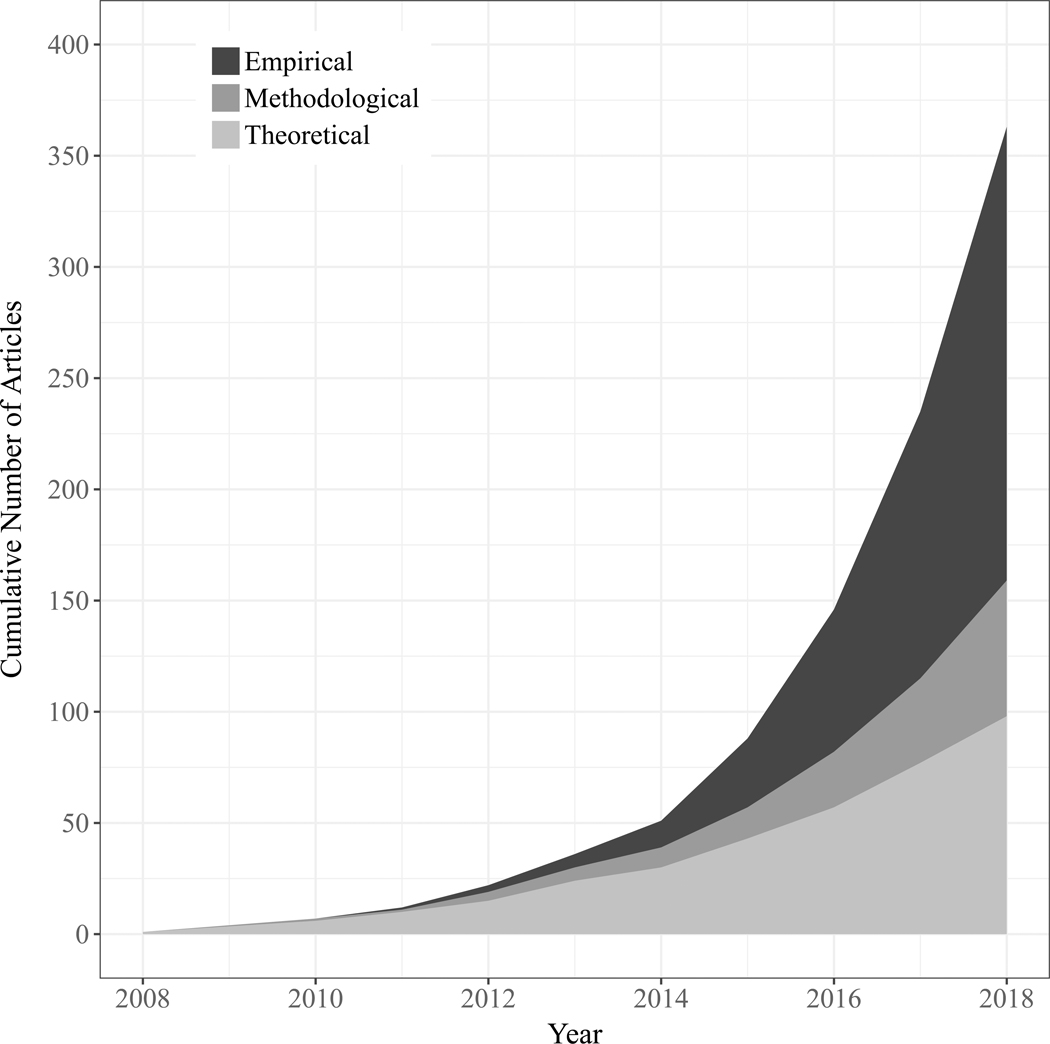
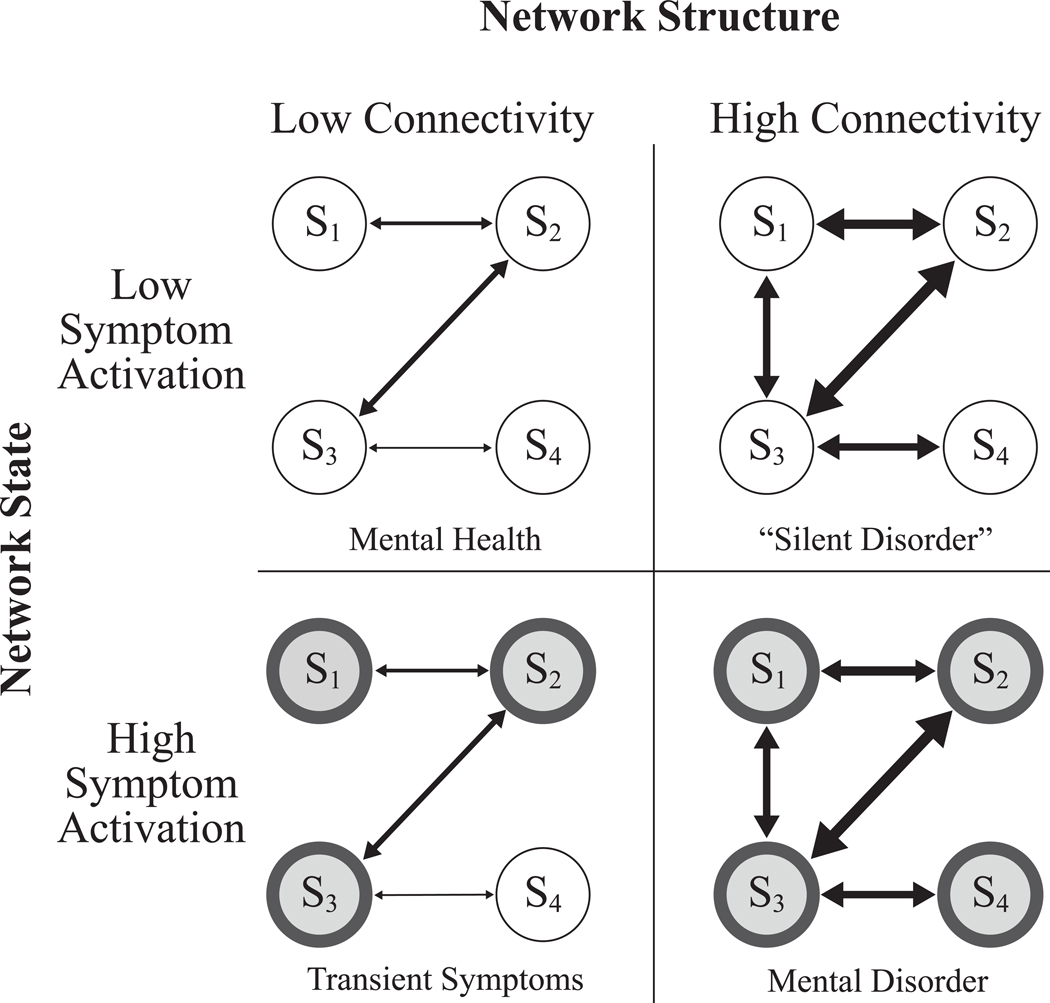
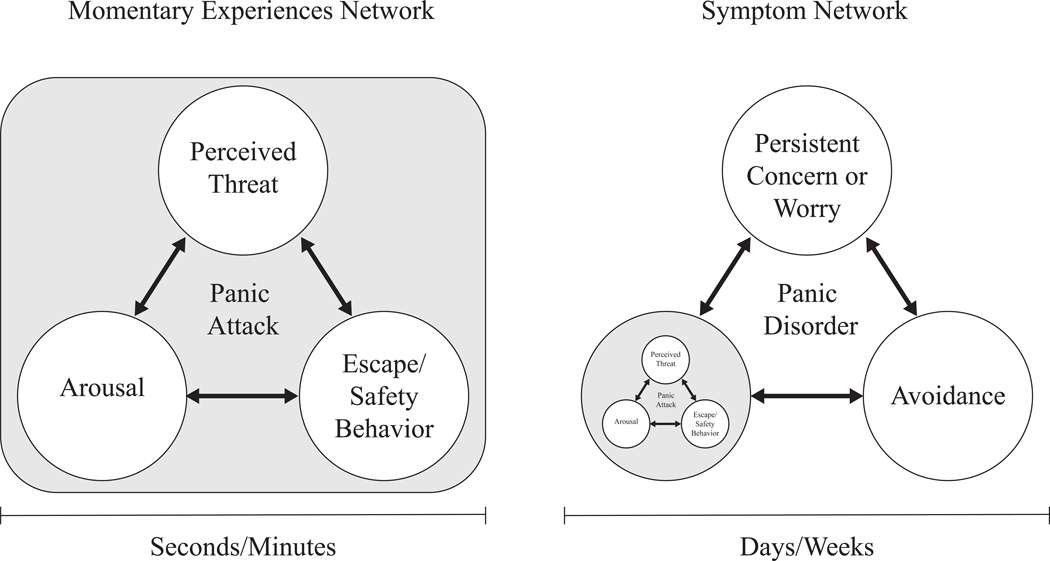
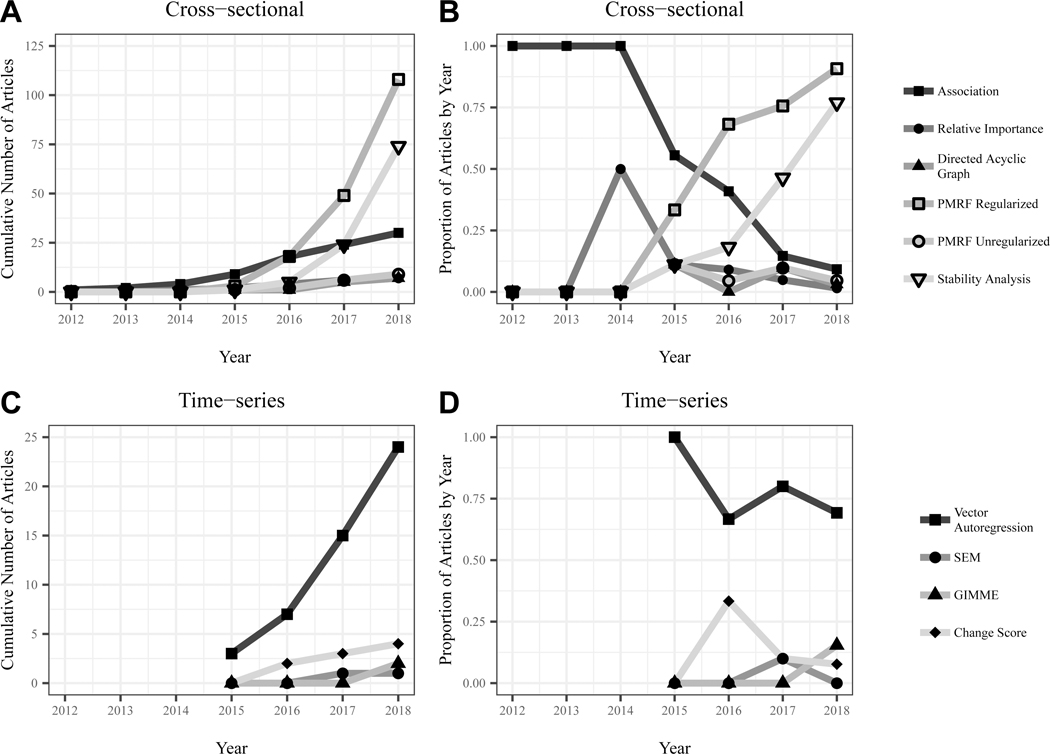
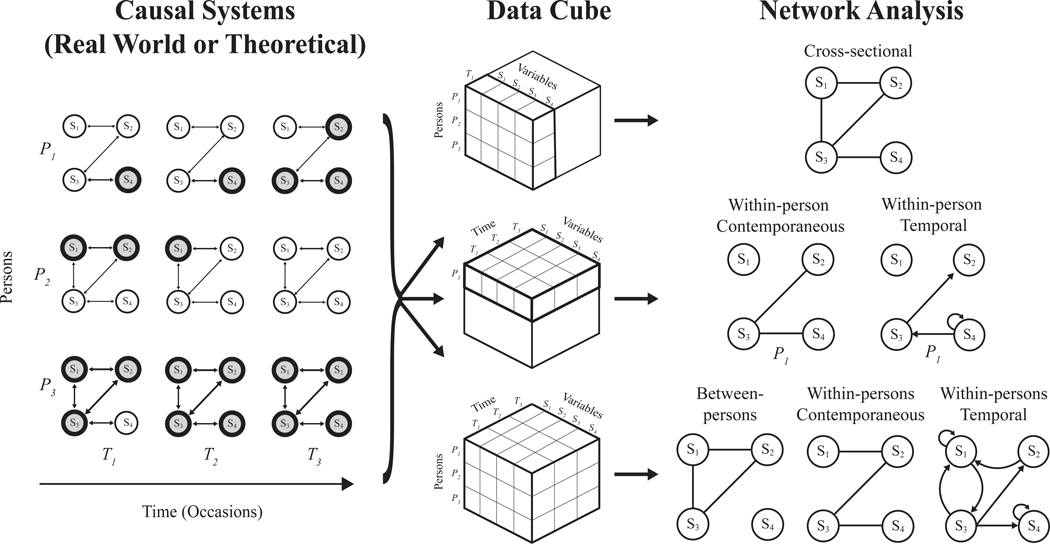
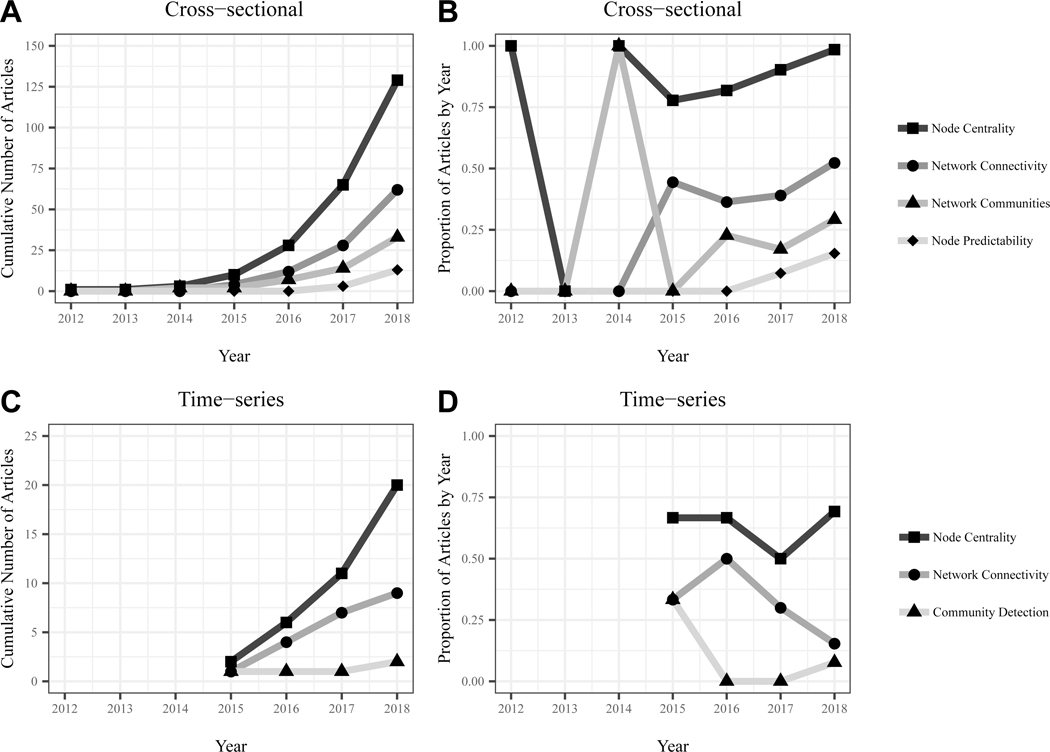
The network approach to psychopathology posits that mental disorders can be conceptualized and studied as causal systems of mutually reinforcing symptoms. This approach, first posited in 2008, has grown substantially over the past decade and is now a full-fledged area of psychiatric research. In this article, we provide an overview and critical analysis of 363 articles produced in the first decade of this research program, with a focus on key theoretical, methodological, and empirical contributions. In addition, we turn our attention to the next decade of the network approach and propose critical avenues for future research in each of these domains. We argue that this program of research will be best served by working toward two overarching aims: (a) the identification of robust empirical phenomena and (b) the development of formal theories that can explain those phenomena. We recommend specific steps forward within this broad framework and argue that these steps are necessary if the network approach is to develop into a progressive program of research capable of producing a cumulative body of knowledge about how specific mental disorders operate as causal systems.

Keywords: Causal systems; network approach; network psychometrics; network theory; psychopathology; symptom networks.


Figures

Figure 1.
Figure 1.. An overview of the network approach literature.
Examining the cumulative number of empirical, methodological, and theoretical papers published in the network literature from 2008–2018.
Figure 2.
Figure 2.. Network structure, network state, and the definition of mental disorder.
Network structure (high vs. low connectivity) and network state (low vs. high symptom activation) can be used to form concrete definitions of mental health and mental disorder (Borsboom, 2017, Cramer et al., 2010b). A weakly connected network with low symptom activation is in a state of mental health (top left panel). If elevated symptom activation arises (for example, due to the effects of time-limited external stressor) the system will no longer be in a state of mental health, but will also not be in a state of mental disorder as symptoms will diminish once the external stressor is removed (bottom left panel). In contrast, a strongly connected network is vulnerable to the persistence of symptom activation even absent the effects of an external stressor. It is this stable state of elevated symptom activation that we refer to as a mental disorder (bottom right panel). Finally, strongly connected networks with minimal symptom activation are perhaps not in a state of mental disorder, but are in a state of vulnerability to the onset or recurrence of a disorder (top right panel). Such a system may thus represent a “silent disorder” where symptoms are not currently manifest, but the risk for such symptoms remains high (Cramer et al., 2010b).
Figure 3.
Figure 3.. Illustrating symptom networks and momentary experiences with the example of panic disorder.
Panic disorder comprises three core symptoms (recurrent panic attacks, persistent concern or worry about those attacks, and avoidance behavior) that play out on a time scale of days, weeks, or even months (e.g., to meet criteria for panic disorder, these symptoms must persist for at least one month). Panic attacks, in turn, comprise momentary experiences of arousal-related bodily sensations, a sense of impending threat (e.g., fear of having a heart attack), and an urge to escape from or mitigate that threat. These momentary experiences play out over the course of seconds of minutes (e.g., to meet criteria for a panic attack, these experiences must surge to a peak within 10 minutes). Cognitive behavioral theories posit that causal relations at both of these time scales play critical roles in panic attacks (Clark, 1986) and panic disorder (Goldstein and Chambless, 1978). A critical challenge for the network approach literature will be determining precisely how processes at these different time scales interact with one another (cf. Wichers, 2014).
Figure 4.
Figure 4.. Network estimation methods commonly utilized in empirical network studies.
This figure depicts methods commonly used in estimating network structure from cross-sectional (panels A & B) and time-series data (panels C & D). Panels A & C depict the cumulative number of articles applying a given estimation method for cross-sectional and time-series data, respectively. Panels B & D depict the proportion of articles in a given year that utilized these estimation methods. For the purposes of this summary, we considered any network based on multiple time points to be based on “time-series” data, thus incorporating change score networks into this category. Note that the earliest cross-sectional (Cramer et al., 2010a) and time-series (Bringmann et al., 2013) networks were regarded as theoretical and methodological contributions, respectively, given their substantial contributions in these domains, and thus are not included in this report. PMRF = Pairwise Markov Random Field; SEM = Structural Equation Modeling; GIMME = Group Iterative Multiple Model Estimation
Figure 5.
Figure 5.. An overview of network methodology, with a focus on the relationship between causal systems, data, and the empirical networks most commonly used in the network approach literature (Pairwise Markov Random Fields).
In many areas of network science, both the elements of the network and the connections among them can be directly observed (e.g., train stations and the tracks that connect them). In psychiatry, symptoms can be assessed, but the relationships among them must be inferred. Network psychometrics aims to infer those relationships using statistical associations. The method by which this is done depends on the data collected (for a discussion of Cattell’s data cube and its relation to specific analyses, see Wardenaar and de Jonge, 2013). For cross-sectional data, a single network is estimated based on the covariation of symptoms between-persons at that point in time. For n=1 time-series data, networks are estimated based on the covariation of symptoms over time within one individual, and can be used to inform contemporaneous and temporal (lagged) associations among symptoms. In time series data in larger samples, networks can be estimated using both within- and between-person information. Importantly, the network structure derived from between-person analyses and within-person analyses are unlikely to be equivalent and, for many plausible causal systems, it remains unclear how the structured derived from either analysis corresponds to the “true structure” of the causal system. The relationships among between-person networks, within-person networks, and the “true structure” of different types of causal systems are critical directions for future research.
Figure 6.
Figure 6.. Network characteristics commonly examined in empirical network studies.
This figure depicts characteristics commonly examined in empirical network studies utilizing cross-sectional (panels A & B) and time-series data (panels C & D). Panels A & C depict the cumulative number of articles reporting a given characteristic for cross-sectional and time-series data, respectively. Panels B & D depict the proportion of articles in a given year that examined those characteristics. In both cross-sectional and time-series networks, node centrality and network connectivity were the most examined network characteristics.

References

    1. Anderson GM (2015). Autism biomarkers: challenges, pitfalls and possibilities. Journal of Autism and Developmental Disorders 45, 1103–13. - PubMed
    1. Armour C, Fried EI & Olff M (2017). PTSD symptomics: network analyses in the field of psychotraumatology. European Journal of Psychotraumatology 8, 1398003. - PMC - PubMed
    1. Barabasi AL (2012). The network takeover. Nature Physics 8, 14–16.
    1. Beard C, Millner AJ, Forgeard MJ, Fried EI, Hsu KJ, Treadway MT, Leonard CV, Kertz SJ & Bjorgvinsson T (2016). Network analysis of depression and anxiety symptom relationships in a psychiatric sample. Psychological Medicine 46, 3359–3369. - PMC - PubMed
    1. Beltz AM & Gates KM (2017). Network mapping with GIMME. Multivariate Behavioral Research 52, 789–804. - PMC - PubMed

Publication types