. 2020 Jan;577(7790):410-415.
doi: 10.1038/s41586-019-1865-0. Epub 2019 Dec 25.

Microbial bile acid metabolites modulate gut RORγ+ regulatory T cell homeostasis

Affiliations

Microbial bile acid metabolites modulate gut RORγ+ regulatory T cell homeostasis

Xinyang Song et al. Nature. 2020 Jan.

Abstract

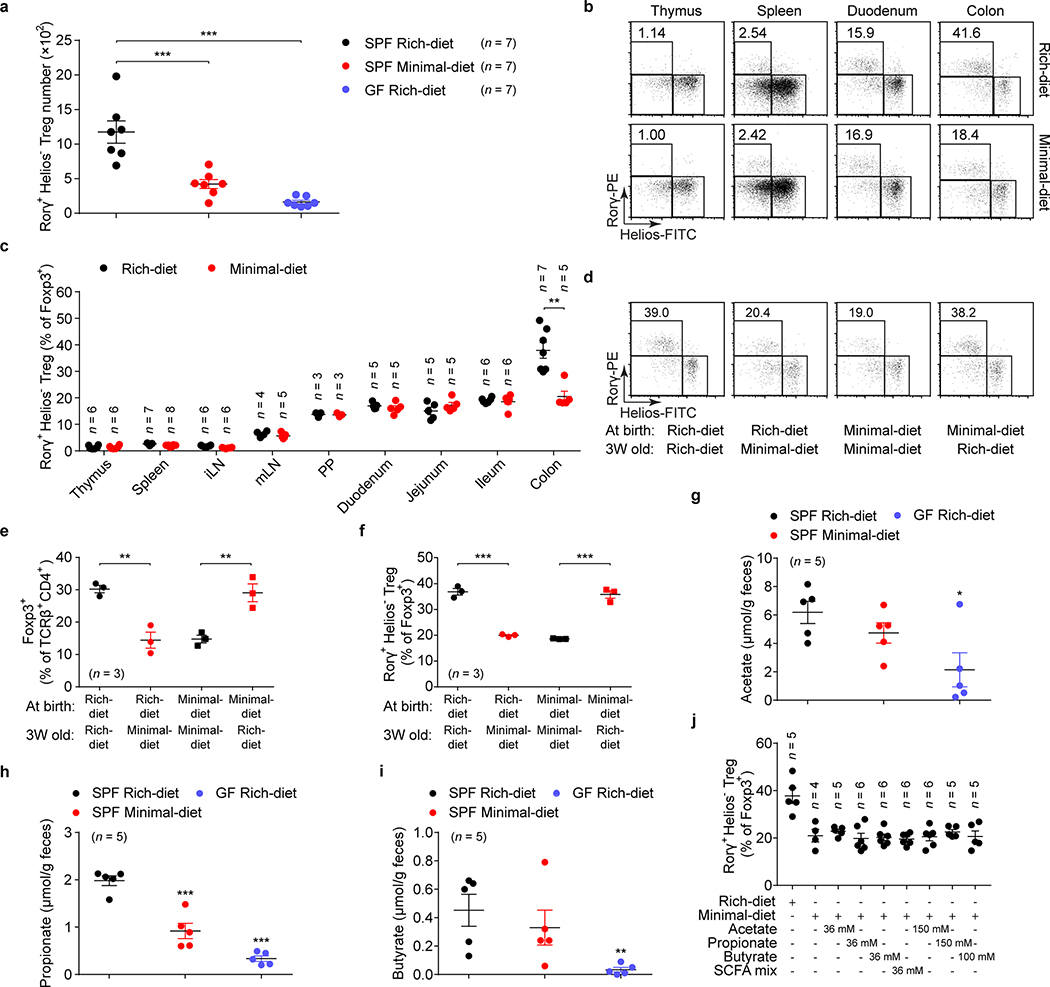
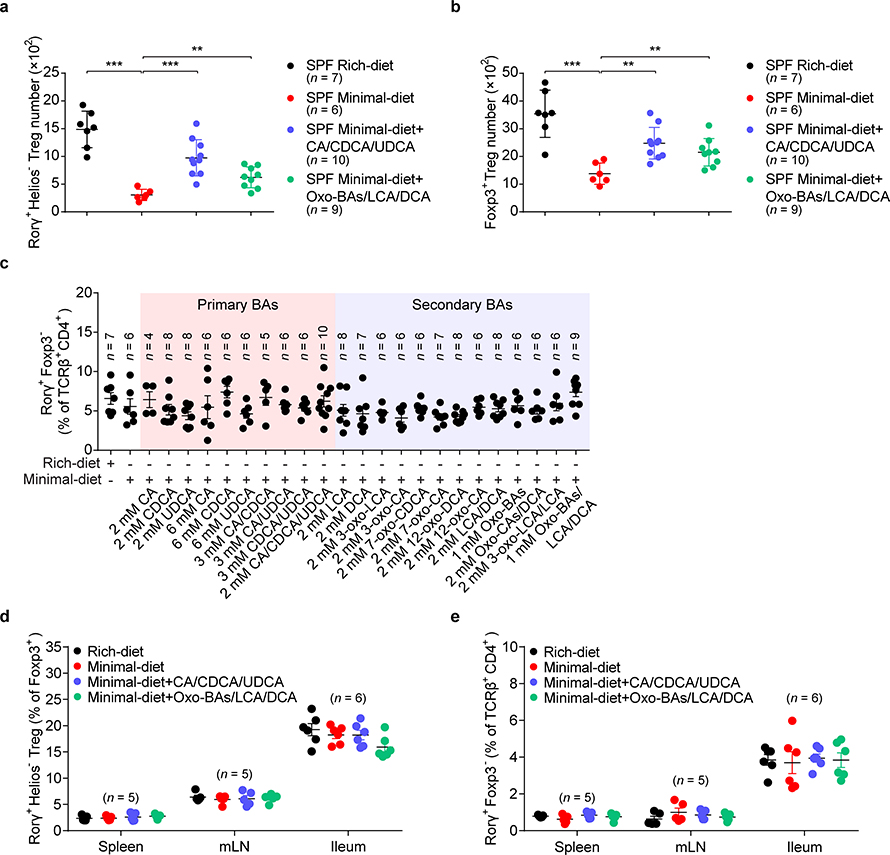
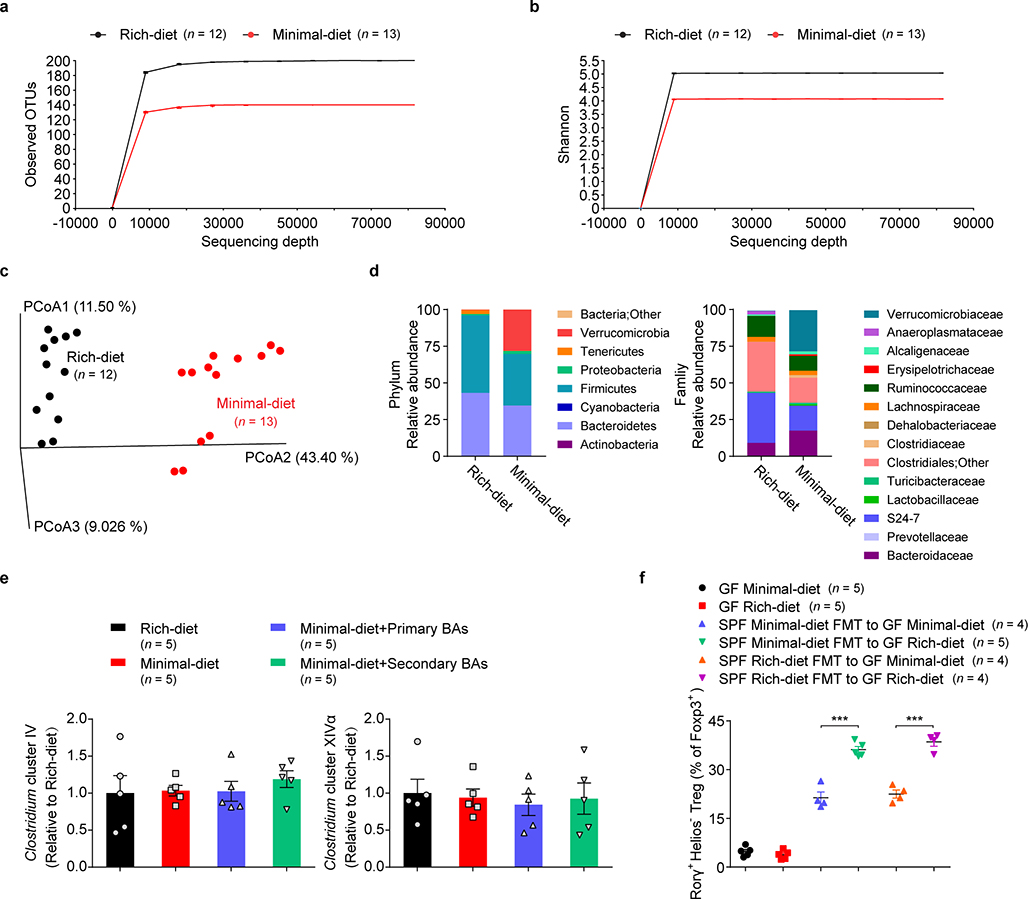
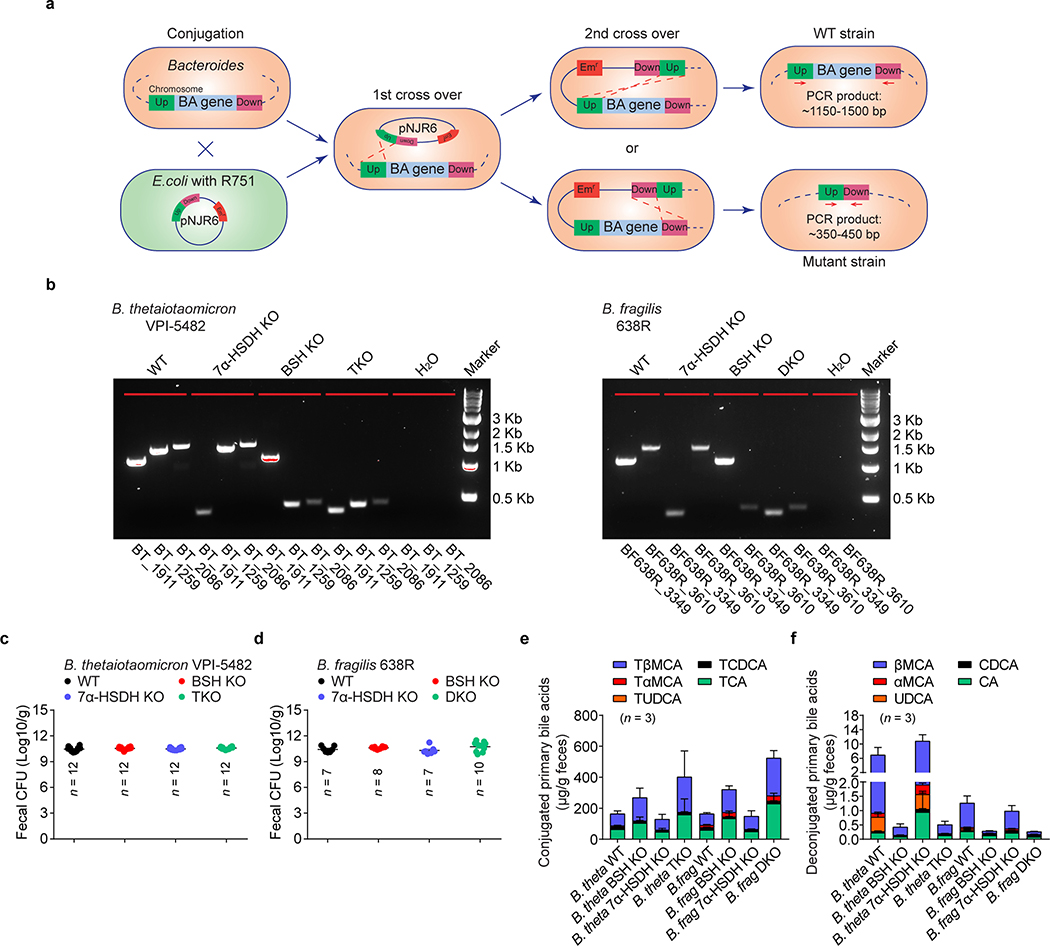
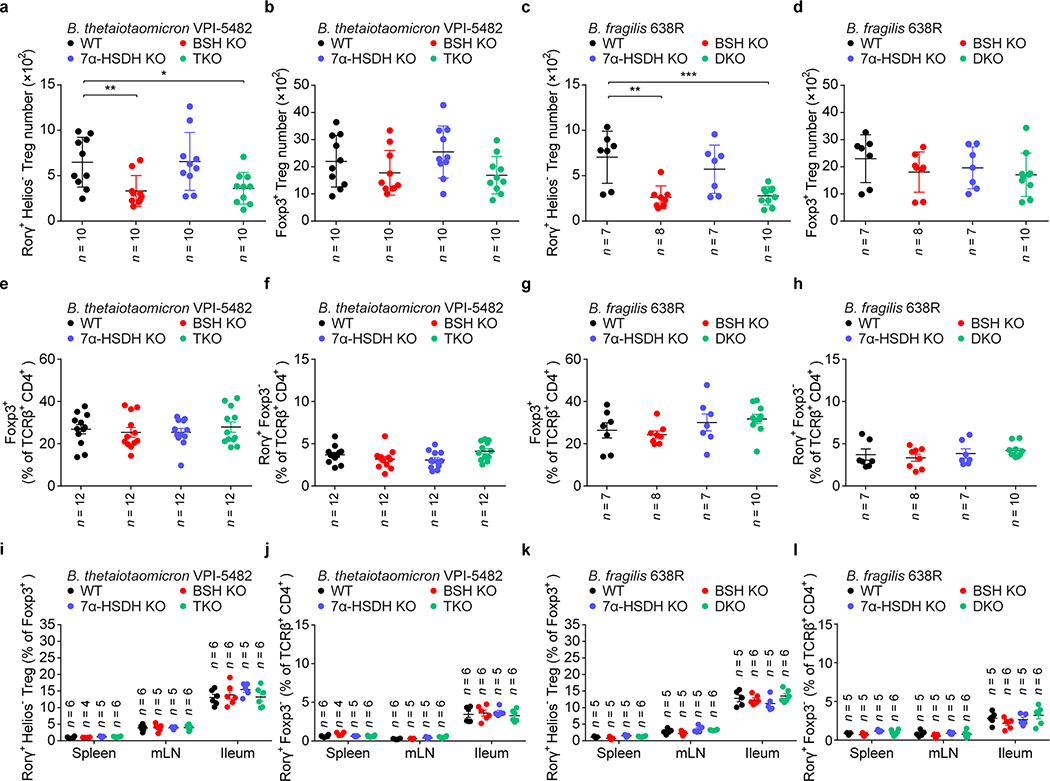
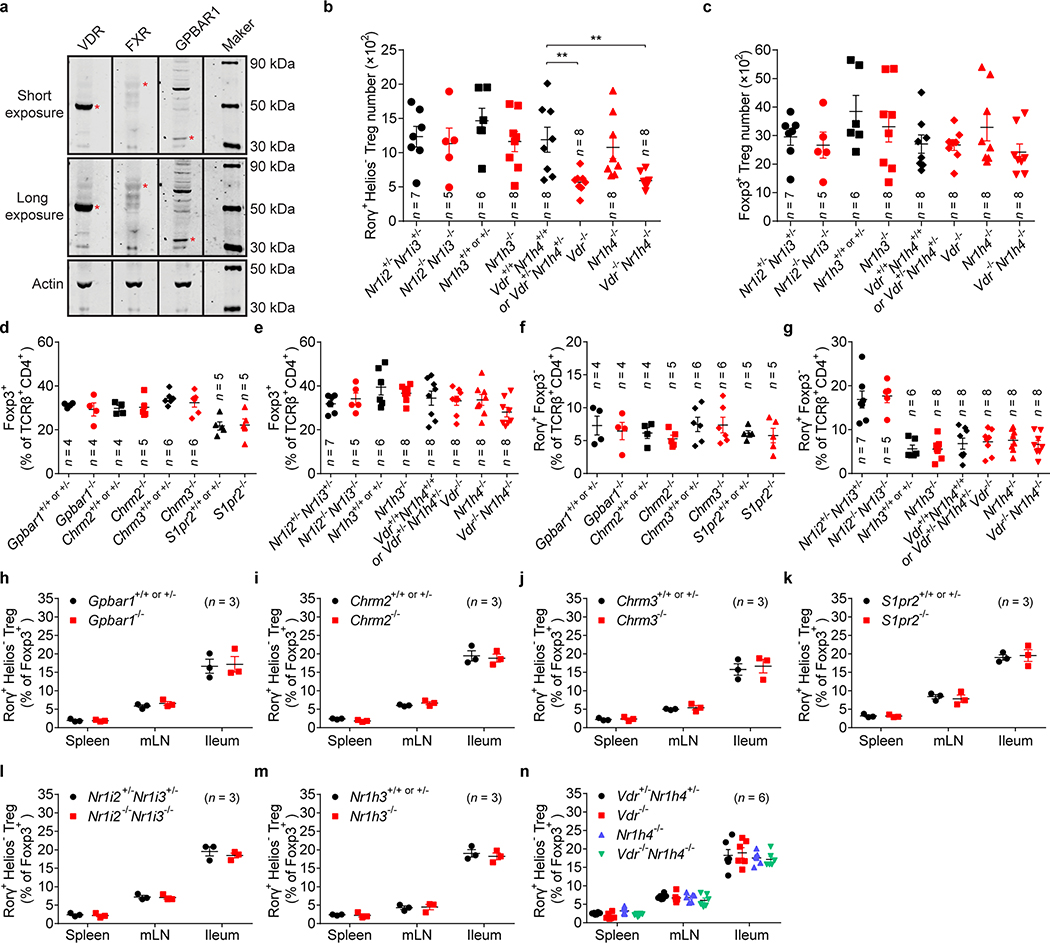
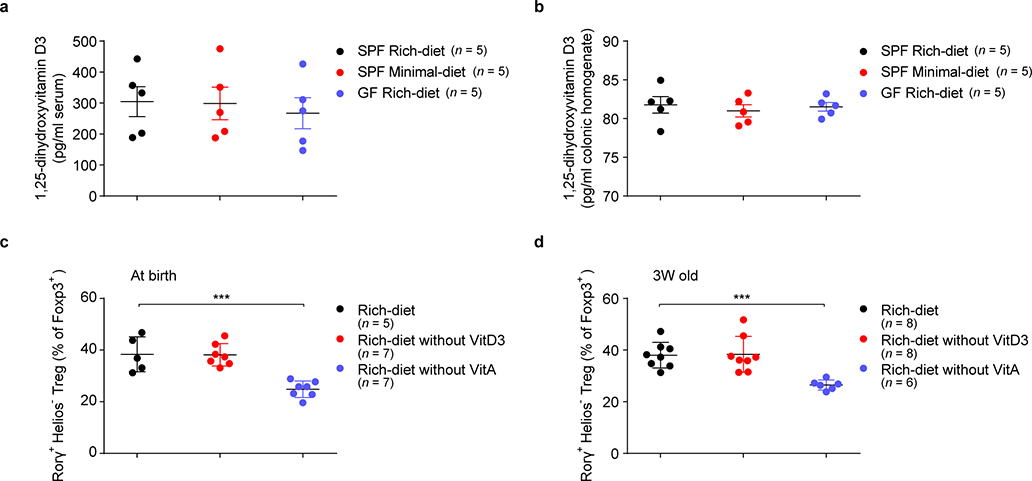
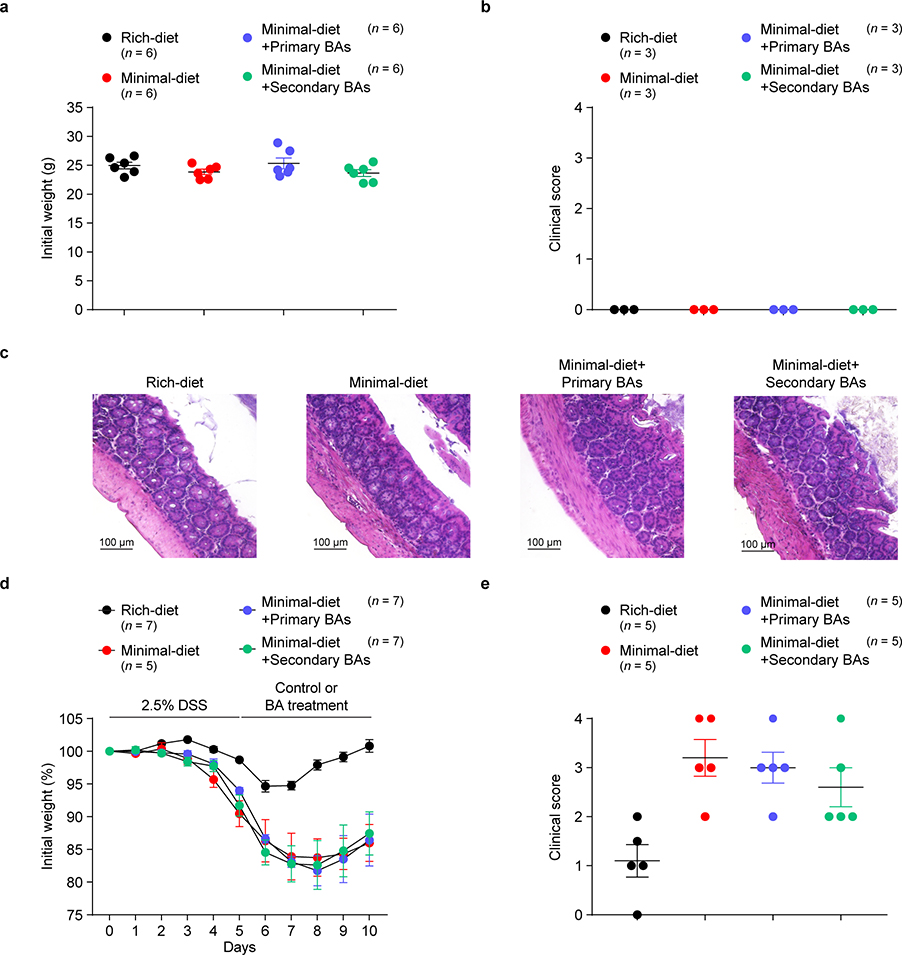
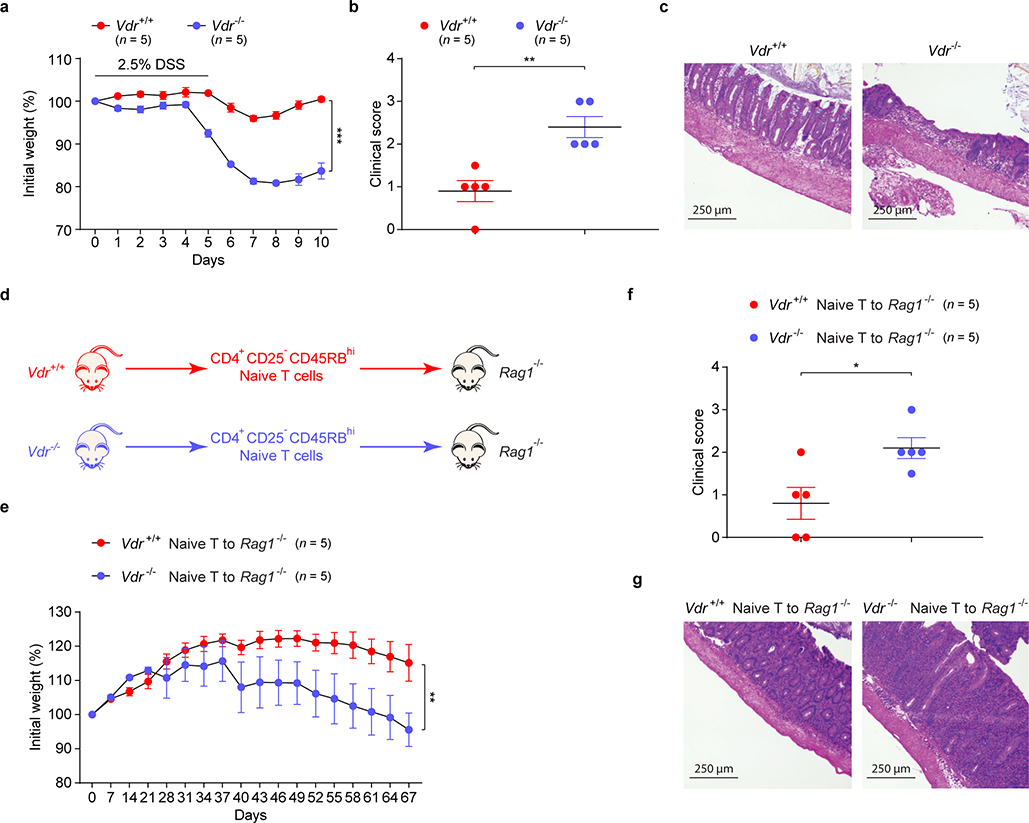
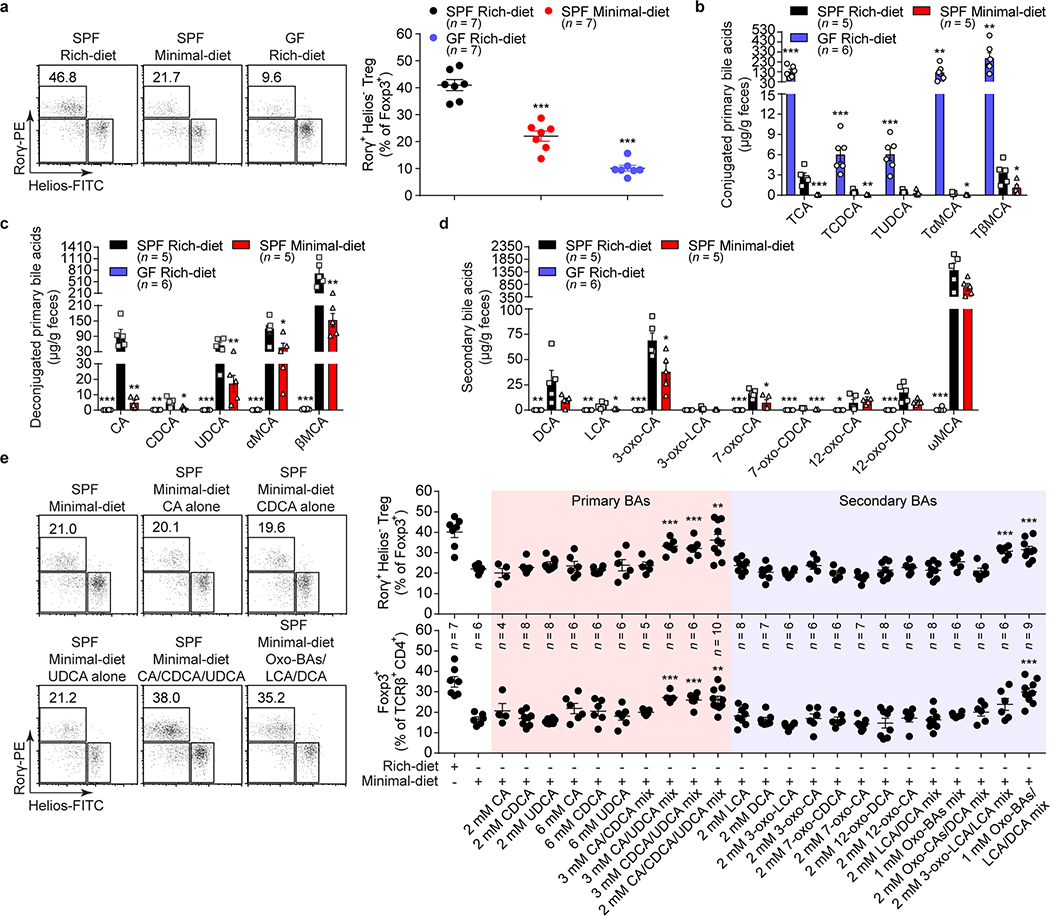
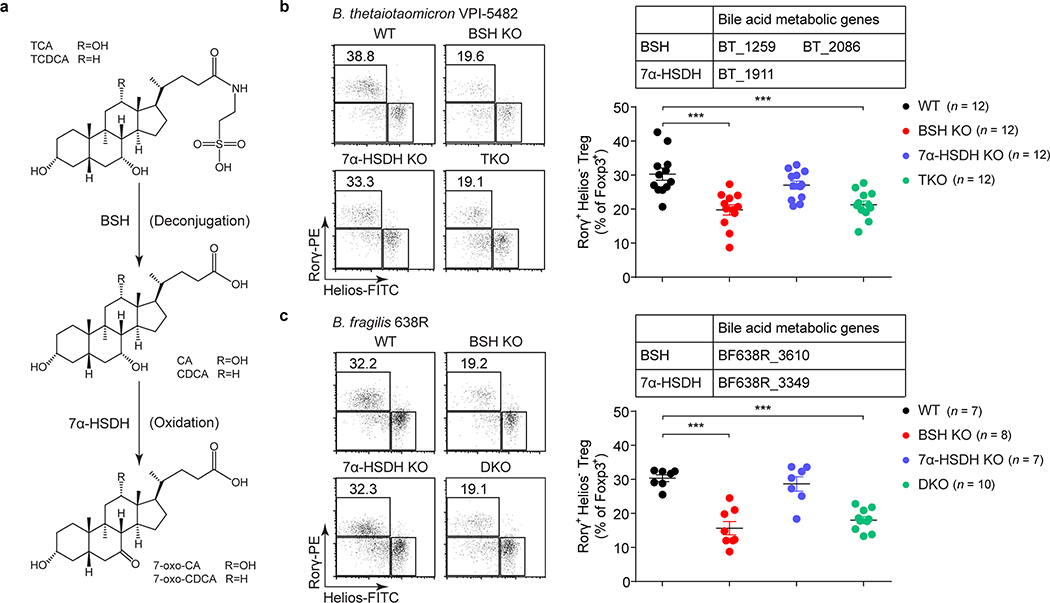
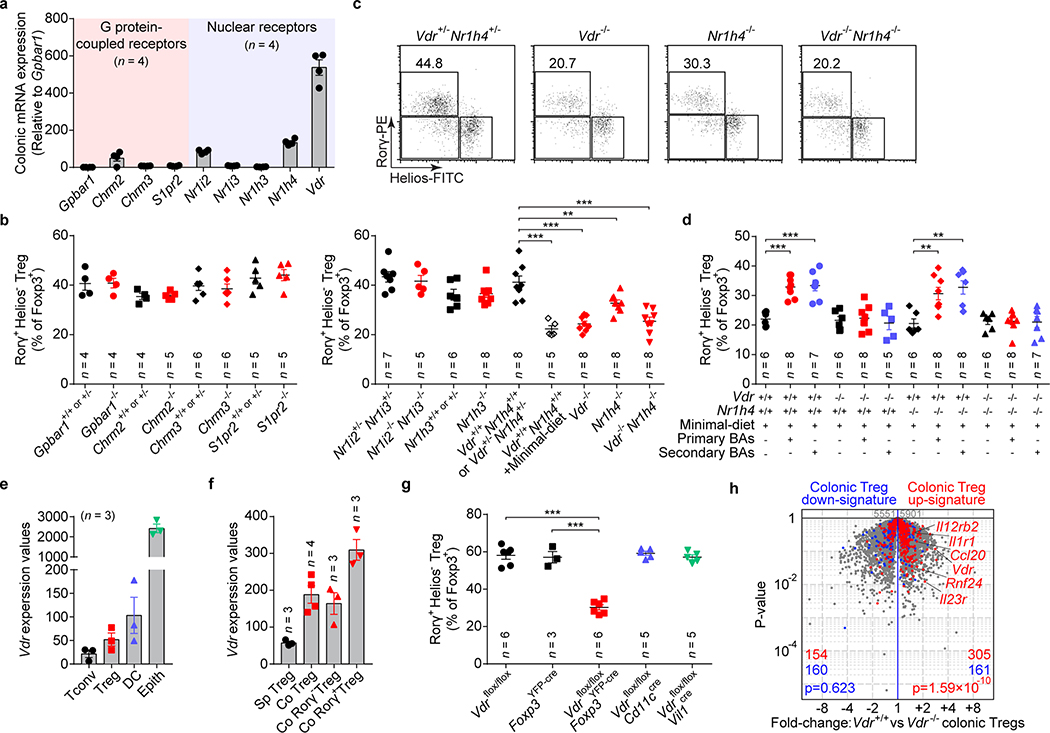
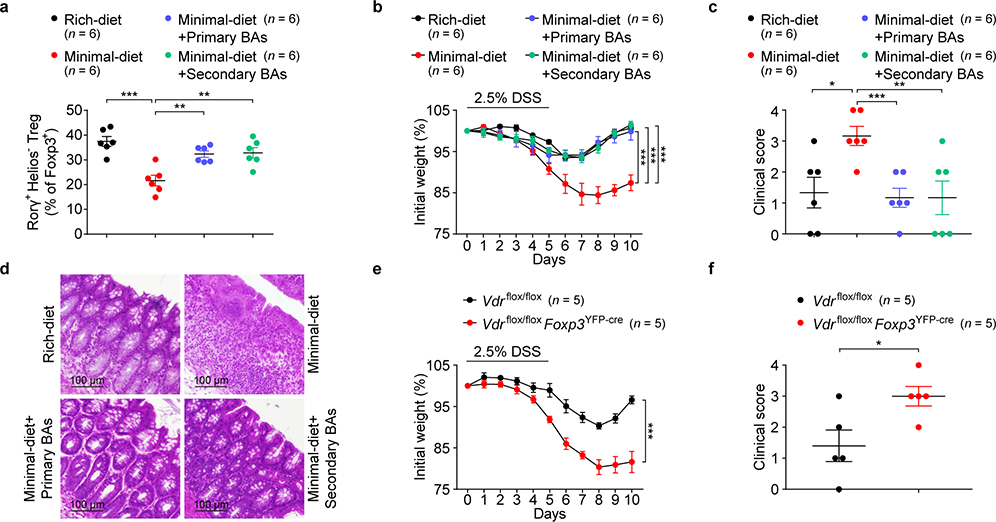
The metabolic pathways encoded by the human gut microbiome constantly interact with host gene products through numerous bioactive molecules1. Primary bile acids (BAs) are synthesized within hepatocytes and released into the duodenum to facilitate absorption of lipids or fat-soluble vitamins2. Some BAs (approximately 5%) escape into the colon, where gut commensal bacteria convert them into various intestinal BAs2 that are important hormones that regulate host cholesterol metabolism and energy balance via several nuclear receptors and/or G-protein-coupled receptors3,4. These receptors have pivotal roles in shaping host innate immune responses1,5. However, the effect of this host-microorganism biliary network on the adaptive immune system remains poorly characterized. Here we report that both dietary and microbial factors influence the composition of the gut BA pool and modulate an important population of colonic FOXP3+ regulatory T (Treg) cells expressing the transcription factor RORγ. Genetic abolition of BA metabolic pathways in individual gut symbionts significantly decreases this Treg cell population. Restoration of the intestinal BA pool increases colonic RORγ+ Treg cell counts and ameliorates host susceptibility to inflammatory colitis via BA nuclear receptors. Thus, a pan-genomic biliary network interaction between hosts and their bacterial symbionts can control host immunological homeostasis via the resulting metabolites.


Conflict of interest statement

Competing Interests

The authors declare no competing interests.

Figures

Extended Data Fig. 1
Extended Data Fig. 1. Both dietary and microbial factors control the level of colonic RORγ+ Tregs.
(a) Beginning at 3 weeks of age, 3 groups of mice were fed special diets for 4 weeks. SPF mice were fed either a nutrient-rich or a minimal diet, and GF mice were fed the nutrient-rich diet. Colonic Tregs were analyzed, and absolute numbers of RORγ+Helios in the Foxp3+CD4+TCRβ+ Treg population are shown. (b, c) Three-week-old SPF mice were fed as in a, and Tregs in different tissues were analyzed after 4 weeks. Representative plots (b) and frequencies of RORγ+Helios in the Foxp3+CD4+TCRβ+ Treg population (c) are shown. iLN, inguinal lymph nodes; mLN, mesenteric lymph nodes; PP, Peyer’s patches. (d-f) SPF mice were fed a nutrient-rich diet or a minimal diet at birth and were either maintained on that diet or switched to the opposite diet at 3 weeks of age. Colonic Tregs were analyzed after 4 weeks. Representative plots of RORγ+Helios in the Foxp3+CD4+TCRβ+ Treg population (d), frequencies of Foxp3+ in the CD4+TCRβ+ cell population (e), and RORγ+Helios in the colonic Foxp3+CD4+TCRβ+ Treg population (f) are shown. (g-i) LC/MS quantitation of fecal acetate (g), propionate (h), and butyrate (i) from SPF mice fed a nutrient-rich diet, or a minimal diet, and from GF mice fed a nutrient-rich diet. (j) Three-week-old SPF mice were fed a nutrient-rich diet, a minimal diet, or a minimal diet supplemented with individual or mixed SCFAs in drinking water. Colonic Tregs were analyzed after 4 weeks. Frequencies of RORγ+Helios in the Foxp3+CD4+TCRβ+ Treg population are shown. Data are representative of two independent experiments. n represents biologically independent animals. In a, c, e-j, bars indicate mean ± SEM values. ∗p < 0.05, ∗∗p < 0.01, and ∗∗∗p < 0.001 in one-way analysis of variance followed by the Bonferroni post hoc test in a, e-i, or ∗∗p < 0.01 in two-tailed Student’s t test in c.
Extended Data Fig. 2
Extended Data Fig. 2. Intestinal bile acids regulate the level of colonic Tregs.
(a, b) Absolute numbers of RORγ+Helios in the colonic Foxp3+CD4+TCRβ+ Treg population (a) and of Foxp3+ Tregs in the CD4+TCRβ+ population (b) in SPF mice fed a nutrient-rich diet, a minimal diet, or a minimal diet supplemented with mixtures of primary or secondary BAs in drinking water. The primary BAs were cholic acid (CA), chenodeoxycholic acid (CDCA), and ursodeoxycholic acid (UDCA) (2 mM of each). The secondary BAs were 3-oxo-cholic acid (3-oxo-CA), 3-oxo-lithocholic acid (3-oxo-LCA), 7-oxo-cholic acid (7-oxo-CA), 7-oxo-chenodeoxycholic acid (7-oxo-CDCA), 12-oxo-cholic acid (12-oxo-CA), 12-oxo-deoxycholic acid (12-oxo-DCA), deoxycholic acid (DCA), and lithocholic acid (LCA) (1 mM of each). (c) Three-week-old SPF mice were fed a nutrient-rich diet, a minimal diet, or a minimal diet supplemented with one or more primary or secondary bile acids in drinking water. Colonic Th17 cells were analyzed after 4 weeks. CA, CDCA, UDCA, DCA, LCA, 3-oxo-CA, 3-oxo-LCA, 7-oxo-CA, 7-oxo-CDCA, 12-oxo-CA, 12-oxo-DCA, and the indicated BA combinations were tested. Frequencies of RORγ+Foxp3 in the CD4+TCRβ+ population are shown. (d, e) Three-week-old SPF mice were fed a nutrient-rich diet, a minimal diet, or a minimal diet supplemented with the indicated primary BAs (CA/CDCA/UDCA, 2 mM of each) or secondary BAs (Oxo-BAs/LCA/DCA, 1 mM of each) in drinking water. Tregs and Th17 cells in spleen, mesenteric lymph node (mLN), and ileum were analyzed after 4 weeks. Frequencies of RORγ+Helios in the Foxp3+CD4+TCRβ+ Treg population (d) and of RORγ+Foxp3 in the CD4+TCRβ+ cell population (e) are shown. Data are pooled from two or three independent experiments. n represents biologically independent animals. Bars indicate SEM values. ∗∗p < 0.01 and ∗∗∗p < 0.001 in one-way analysis of variance followed by the Bonferroni post hoc test in a, b.
Extended Data Fig. 3
Extended Data Fig. 3. Colonic microbial profiling of rich-diet mice versus minimal-diet mice.
(a-d) Three-week-old SPF mice were fed a nutrient-rich diet or a minimal diet, and the microbial compositions in colonic lumen were analyzed after 4 weeks by 16S rRNA sequencing. Observed OTUs (a), Shannon index (b), PCoA analysis (c), and relative abundance of bacteria at the phylum and family levels (d) are shown. (e) Quantitative PCR analysis of 16S rDNA of Clostridium cluster IV and Clostridium cluster XIVα in colonic luminal specimens from SPF mice fed a nutrient-rich diet, a minimal diet, or a minimal diet supplemented with the indicated primary BAs (CA/CDCA/UDCA, 2 mM of each) or secondary BAs (Oxo-BAs/LCA/DCA, 1 mM of each) in drinking water. (f) Four-week-old GF mice or GF mice receiving transferred fecal materials (FMT) from minimal-diet or rich-diet SPF mice were fed a nutrient-rich diet or a minimal diet, and colonic Tregs were analyzed after 2 weeks. Frequencies of colonic RORγ+Helios in the Foxp3+CD4+TCRβ+ Treg population are shown. Data are pooled from three independent experiments in a-d. Data are representative of two independent experiments in e, f. n represents biologically independent animals. Bars indicate mean ± SEM value, and ∗∗∗p < 0.001 in one-way analysis of variance followed by the Bonferroni post hoc test.
Extended Data Fig. 4
Extended Data Fig. 4. Generation of bile acid metabolic pathway mutants in Bacteroides.
(a) Schematic diagram of pNJR6 suicide vector–mediated BA gene deletion in Bacteroides. (b) Genotyping of B. thetaiotaomicron and B. fragilis BA metabolic pathway mutants by PCR. PCR primers were designed to target the flanking regions of an intact gene. PCR of an untouched gene plus its flanking regions generated a PCR product of ~1150–1500 bp, while deletion of an interested BA metabolic gene resulted in only a ~350- to 450-bp PCR amplicon of its two flanking regions. (c, d) Bacterial load (measured as CFU/g of feces) of B. thetaiotaomicron (c) and B. fragilis (d) BA metabolic pathway mutants and their wild-type (WT) control strains in monocolonized GF mice. (e, f) LC/MC quantitation of fecal conjugated primary BAs (e) and deconjugated primary BAs (f) in GF mice monocolonized with B. thetaiotaomicron or B. fragilis BA metabolic pathway mutants and their wild-type (WT) control strains. Data are representative of two independent experiments in b, e, f. Data are pooled from three independent experiments in c, d. n represents biologically independent animals. Bars indicate mean ± SEM values in c-f.
Extended Data Fig. 5
Extended Data Fig. 5. Gut bacteria modulate colonic RORγ+ Tregs via their bile acid metabolic pathways.
(a, b) Each of 4 groups of GF mice was colonized with one of the following microbes: 1) a wild-type (WT) strain of B. thetaiotaomicron; 2) a BSH mutant strain; 3) a 7α-HSDH mutant strain; or 4) a triple-mutant strain. Colonic Tregs were analyzed after 2 weeks. Absolute numbers of RORγ+Helios in the colonic Foxp3+CD4+TCRβ+ Treg population (a) and of Foxp3+ Tregs in the CD4+TCRβ+ population (b) are shown. (c, d) Each of 4 groups of GF mice was colonized with one of the following microbes: 1) a WT strain of B. fragilis; 2) a BSH KO strain; 3) a 7α-HSDH KO strain; or 4) a double-mutant strain. Absolute numbers of colonic Tregs are shown as in a, b. (e, f) GF mice were colonized with B. thetaiotaomicron BA metabolic pathway mutants or their wild-type (WT) control strains. Colonic Tregs and Th17 were analyzed after 2 weeks. Frequencies of Foxp3+ in the CD4+TCRβ+ cell population (e) or RORγ+Foxp3 in the CD4+TCRβ+ cell population (f) are shown. (g, h) GF mice were colonized with B. fragilis BA metabolic pathway mutants or their wild-type control strains. Frequencies of colonic Tregs and Th17 are shown as in e, f. (i, j) GF mice were colonized with B. thetaiotaomicron BA metabolic pathway mutants or their wild-type (WT) control strains. Tregs and Th17 cells in the spleen, mesenteric lymph node (mLN), and ileum were analyzed after 2 weeks. Frequencies of RORγ+Helios in the Foxp3+CD4+TCRβ+ Treg population (i) and RORγ+Foxp3 in the CD4+TCRβ+ cell population (j) are shown. (k, l) GF mice were colonized with B. fragilis BA metabolic pathway mutants or their wild-type control strains. Frequencies of Tregs and Th17 in spleen, mLN, and ileum are shown as in i, j. Data are pooled from two or three independent experiments. n represents biologically independent animals. Bars indicate mean ± SEM values. ∗p < 0.05, ∗∗p < 0.01, and ∗∗∗p < 0.001 in one-way analysis of variance followed by the Bonferroni post hoc test in a, c.
Extended Data Fig. 6
Extended Data Fig. 6. The impact of bile acid receptor deficiency on Tregs or Th17 cells in gut and peripheral lymphoid organs.
(a) Protein expression of VDR, FXR (NR1H4), and GPBAR1 in the colonic tissue of SPF C57BL/6J mice was analyzed by western blot. The red asterisks indicate the corresponding molecular weight of VDR (53 kDa), FXR (69 kDa), and GPBAR1 (33 kDa). For gel source data, see Supplementary Figure 1. (b, c) Absolute numbers of RORγ+Helios in the colonic Foxp3+CD4+TCRβ+ Treg population (b) and of Foxp3+ Tregs in the CD4+TCRβ+ population (c) from mice deficient in nuclear receptors (Nr1i2–/–Nr1i3–/–, Nr1h3–/–, Vdr–/–, Nr1h4–/–, and Vdr–/–Nr1h4–/–) and their littermate controls. (d, e) Frequencies of Foxp3+ in the CD4+TCRβ+ cell population from mice deficient in G protein-coupled receptors (Gpbar1–/–, Chrm2–/–, Chrm3–/–, and S1pr2–/–) and their littermate controls (d) and from mice deficient in nuclear receptors (Nr1i2–/–Nr1i3–/–, Nr1h3–/–, Vdr–/–, Nr1h4–/–, and Vdr–/–Nr1h4–/–) and their littermate controls (e). (f, g) Frequencies of RORγ+Foxp3 in the CD4+TCRβ+ cell population from mice described in d, e. (h-n) Tregs in the spleen, mesenteric lymph node (mLN), and ileum from the indicated mice were analyzed. Frequencies of RORγ+Helios in the Foxp3+CD4+TCRβ+ Treg population from Gpbar1–/– (h), Chrm2–/– (i), Chrm3–/– (j), S1pr2–/– (k), Nr1i2–/–Nr1i3–/– (l), Nr1h3–/– (m), and Vdr–/–, Nr1h4–/–, and Vdr–/–Nr1h4–/– (n) mice and their littermate controls are shown. Data are representative of two or three independent experiments in a, d-n, or are pooled from two or three independent experiments in b, c. n represents biologically independent animals. Bars indicate mean ± SEM values. ∗∗p < 0.01 in one-way analysis of variance followed by the Bonferroni post hoc test in b.
Extended Data Fig. 7
Extended Data Fig. 7. Dietary vitamin D3 does not alter the frequency of colonic RORγ+ Tregs.
(a, b) Beginning at 3 weeks of age, 3 groups of mice were fed special diets for 4 weeks. SPF mice were fed either a nutrient-rich or a minimal diet, and GF mice were fed the nutrient-rich diet. The levels of 1,25-dihydroxyvitamin D3 in serum (a) and colon (b) of these mice were determined by ELISA. (c) SPF mice were fed a nutrient-rich diet or a vitamin D3 or a vitamin A deficient-rich diet at birth. Colonic Tregs were analyzed after 7 weeks. Frequencies of RORγ+Helios in the colonic Foxp3+CD4+TCRβ+ Treg population are shown. (d) SPF mice were fed a nutrient-rich-diet at birth and were either maintained on that diet or switched to a vitamin D3 or vitamin A-deficient rich diet at 3 weeks of age. Colonic Tregs were analyzed after 4 weeks. Frequencies of RORγ+Helios in the colonic Foxp3+CD4+TCRβ+ Treg population are shown. Data are representative of two independent experiments. n represents biologically independent animals. Bars indicate mean ± SEM values. ∗∗∗p < 0.001 in one-way analysis of variance followed by the Bonferroni post hoc test in c, d.
Extended Data Fig. 8
Extended Data Fig. 8. Comparison of RORγ+ Treg signature genes of colonic Tregs from Vdr+/+ and Vdr–/– mice.
Volcano plots comparing transcriptomes of colonic Tregs from Vdr+/+Foxp3mRFP and Vdr–/–Foxp3mRFP mice (n = 3). Colonic RORγ+ Treg signature genes are highlighted in red (up-regulated) or blue (down-regulated). The number of genes from each signature preferentially expressed by one or the other population is shown at the bottom. Data are pooled from two independent experiments. n represents biologically independent animals. To determine the enrichment of certain gene signatures in RNA-seq data sets, a Chi-square test was used. p values of < 0.05 were considered statistically significant.
Extended Data Fig. 9
Extended Data Fig. 9. BA supplementation does not cause gut inflammation and cannot ameliorate gut inflammation after the development of colitis.
(a-c) Three-week-old SPF mice were fed a nutrient-rich diet, a minimal diet, or a minimal diet supplemented with mixtures of primary BAs (CA/CDCA/UDCA, 2 mM of each) or secondary BAs (Oxo-BAs/LCA/DCA, 1 mM of each) in drinking water. Initial body weights were recorded before DSS challenge (a). Clinical scores (b) and hematoxylin and eosin histology (c) for representative colons from mice not challenged with DSS are shown. (d, e) Three-week-old SPF mice fed a nutrient-rich diet or a minimal diet for 4 weeks were then challenged in the DSS-induced colitis model. After the development of colitis at day 5 of the model, the DSS containing drinking water was switched to regular drinking water or to drinking water supplemented with mixtures of primary or secondary BAs. The primary BAs were CA, CDCA, and UDCA (2 mM of each). The secondary BAs were 3-oxo-CA, 3-oxo-LCA, 7-oxo-CA, 7-oxo-CDCA, 12-oxo-CA, 12-oxo-DCA, DCA, and LCA (1 mM of each). Daily weight loss (d) of mice during the course of DSS-induced colitis and clinical scores (e) on day 10 of colitis are shown. Data are representative of two independent experiments. n represents biologically independent animals. Bars indicate mean ± SEM values in a, b, d, e.
Extended Data Fig. 10
Extended Data Fig. 10. VDR signaling controls gut inflammation.
(a-c) Daily weight loss (a) of Vdr+/+ and Vdr–/– mice during the course of DSS-induced colitis. Clinical scores (b) and hematoxylin and eosin histology (c) of representative colons on day 10 of colitis are shown. (d) Schematic representation of the T cell adaptive transfer model of colitis. Rag1–/– mice are transferred with either Vdr+/+ or Vdr–/– naïve T cells. (e-g) Weight loss (e) of Rag1–/– mice in d during the course of T cell adaptive transfer-induced colitis. Clinical scores (f) and hematoxylin and eosin histology (g) of representative colons on day 67 of colitis are shown. Data are representative of two independent experiments. n represents biologically independent animals. Bars indicate mean ± SEM values in a, b, e, f. ∗∗p < 0.01 and ∗∗∗p < 0.001 in two-way analysis of variance followed by the Bonferroni post hoc test in a, e, or ∗p < 0.05 and ∗∗p < 0.01 in two-tailed Student’s t test in b, f.
Fig. 1
Fig. 1. Gut bile acid metabolites are essential for colonic RORγ+ Treg maintenance.
(a) Beginning at 3 weeks of age, 3 groups of mice were fed special diets for 4 weeks. SPF mice were fed either a nutrient-rich or a minimal diet, and GF mice were fed the nutrient-rich diet. Representative plots and frequencies of RORγ+Helios in the Foxp3+CD4+TCRβ+ Treg population are shown. (bd) LC/MS quantitation of fecal conjugated primary BAs (b), deconjugated primary BAs (c), and secondary BAs (d) from groups of mice fed as in a. The BAs determined were cholic acid (CA), chenodeoxycholic acid (CDCA), ursodeoxycholic acid (UDCA), α-muricholic acid (αMCA), β-muricholic acid (βMCA), deoxycholic acid (DCA), lithocholic acid (LCA), 3-oxo-cholic acid (3-oxo-CA), 3-oxo-lithocholic acid (3-oxo-LCA), 7-oxo-cholic acid (7-oxo-CA), 7-oxo-chenodeoxycholic acid (7-oxo-CDCA), 12-oxo-cholic acid (12-oxo-CA), 12-oxo-deoxycholic acid (12-oxo-DCA), ω-muricholic acid (ωMCA), and taurine-conjugated species (TCA, TCDCA, TUDCA, TαMCA, and TβMCA). (e) Three-week-old SPF mice were fed a nutrient-rich diet, a minimal diet, or a minimal diet supplemented with one or more primary or secondary bile acids in drinking water for 4 weeks. Representative plots and frequencies of RORγ+Helios in the Foxp3+CD4+TCRβ+ Treg population and of Foxp3+ in the CD4+TCRβ+ population are shown. The BAs used in the feed were CA, CDCA, UDCA, DCA, LCA, 3-oxo-CA, 3-oxo-LCA, 7-oxo-CA, 7-oxo-CDCA, 12-oxo-CA, 12-oxo-DCA, and various indicated BA combinations. Data are representative of at least two independent experiments in a-d, Data are pooled from three independent experiments in e. n represents biologically independent animals. Bars indicate mean ± SEM values. ∗p < 0.05, ∗∗p < 0.01, and ∗∗∗p < 0.001 in one-way analysis of variance followed by the Bonferroni post hoc test.
Fig. 2
Fig. 2. Gut bacteria control colonic RORγ+ Tregs through their bile acid metabolic pathways.
(a) Schematic diagram of BA metabolic pathways in B. thetaiotaomicron and B. fragilis. (b) Each of 4 groups of GF mice was colonized with one of the following microbes for 2 weeks: 1) a wild-type (WT) strain of B. thetaiotaomicron; 2) a BSH mutant strain (BSH KO, in which both the BT_1259 and BT_2086 genes are deleted); 3) a 7α-HSDH mutant strain (7α-HSDH KO, in which the BT_1911 gene is deleted); or 4) a triple-mutant strain (TKO, in which all three genes are deleted). Representative plots and frequencies of RORγ+Helios in the Foxp3+CD4+TCRβ+ Treg population are shown. (c) Each of 4 groups of GF mice was colonized with one of the following microbes for 2 weeks: 1) a WT strain of B. fragilis; 2) a BSH KO strain (in which the BF638R_3610 gene is deleted); 3) a 7α-HSDH KO strain (in which the BF638R_3349 gene is deleted); or 4) a double-mutant strain (DKO, in which both genes are deleted). Colonic Tregs were analyzed as in b. Data are pooled from three independent experiments in b, c. n represents biologically independent animals. Bars indicate mean ± SEM values in b, c. ∗∗∗p < 0.001 in one-way analysis of variance followed by the Bonferroni post hoc test.
Fig. 3
Fig. 3. Bile acid metabolites modulate colonic RORγ+ Tregs via bile acid receptors.
(a) Quantitative mRNA expression of BA receptors in the colon of SPF mice. (b) Frequencies of colonic RORγ+Helios in the Foxp3+CD4+TCRβ+ Treg population from mice deficient in G protein–coupled receptors (Gpbar1–/–, Chrm2–/–, Chrm3–/–, and S1pr2–/–) and their littermate controls. (c) Representative plots and frequencies of colonic RORγ+Helios in the Foxp3+CD4+TCRβ+ Treg population from mice deficient in nuclear receptors (Nr1i2–/–Nr1i3–/–, Nr1h3–/–, Vdr–/–, Nr1h4–/–, and Vdr–/–Nr1h4–/–), their littermate controls, and minimal-diet Vdr+/+Nr1h4+/+ mice. (d) Three-week-old Vdr+/+Nr1h4+/+, Vdr–/–, Nr1h4–/–, and Vdr–/–Nr1h4–/– mice were fed a minimal diet or a minimal diet supplemented with primary BAs (CA/CDCA/UDCA, 2 mM of each) or secondary BAs (DCA/LCA/3-oxo-CA/3-oxo-LCA/7-oxo-CA/7-oxo-CDCA/12-oxo-CA/12-oxo-DCA, 1 mM of each) in their drinking water for 4 weeks. Frequencies of RORγ+Helios in the Foxp3+CD4+TCRβ+ Treg population are shown. (e) Normalized expression values of Vdr in colonic T conventional cells (Tconv), Foxp3+ Tregs, dendritic cells (DC), and epithelial cells (Epith). (f) Normalized expression values of Vdr in splenic Tregs (Sp Treg), colonic Tregs (Co Treg), colonic RORγ Tregs (Co RORγ Treg), and colonic RORγ+ Tregs (Co RORγ+ Treg). (g) Frequencies of colonic RORγ+Helios in the Foxp3+CD4+TCRβ+ Treg population from Vdrflox/floxFoxp3YFP-cre, Vdrflox/floxCd11ccre, Vdrflox/floxVil1cre mice and from Vdrflox/flox and Foxp3YFP-cre mice. (h) Volcano plots comparing transcriptomes of colonic Tregs from Vdr+/+Foxp3mRFP or Vdr–/–Foxp3mRFP mice (n = 3). Colonic Treg signature genes are highlighted in red (up-regulated) or blue (down-regulated). Data are pooled from two or three independent experiments. n represents biologically independent animals. Bars indicate mean ± SEM values. ∗∗p < 0.01 and ∗∗∗p < 0.001 in one-way analysis of variance followed by the Bonferroni post hoc test in c, d, g or Chi-square test in h.
Fig. 4
Fig. 4. Bile acids ameliorate gut inflammation.
(a) Frequencies of RORγ+Helios in the colonic Foxp3+CD4+TCRβ+ Treg population on day 2 of DSS-induced colitis in mice fed a nutrient-rich diet, a minimal diet, or a minimal diet supplemented with mixtures of primary or secondary BAs in drinking water. The primary BAs were CA, CDCA, and UDCA (2 mM of each). The secondary BAs were DCA, LCA, 3-oxo-CA, 3-oxo-LCA, 7-oxo-CA, 7-oxo-CDCA, 12-oxo-CA, and 12-oxo-DCA (1 mM of each). (b) Daily weight loss of mice described in a during the course of DSS-induced colitis. (c) Clinical scores and (d) hematoxylin and eosin–stained histologic sections for representative colons on day 10 of colitis (see b). (e) Daily weight loss of Vdrflox/flox and Vdrflox/floxFoxp3YFP-cre mice during the course of DSS-induced colitis. (f) Clinical scores for representative colons on day 10 of colitis (see e). Data are representative of two or three independent experiments. n represents biologically independent animals. Bars indicate mean ± SEM values in a-c, e, f. ∗p < 0.05, ∗∗p < 0.01, and ∗∗∗p < 0.001 in one-way (a, c) or two-way (b, e) analysis of variance followed by the Bonferroni post hoc test or two-tailed Student’s t test (f).

Comment in

References

    1. Postler TS & Ghosh S Understanding the Holobiont: How Microbial Metabolites Affect Human Health and Shape the Immune System. Cell metabolism 26, 110–130, doi:10.1016/j.cmet.2017.05.008 (2017). - DOI - PMC - PubMed
    1. Ridlon JM, Kang DJ & Hylemon PB Bile salt biotransformations by human intestinal bacteria. Journal of lipid research 47, 241–259, doi:10.1194/jlr.R500013-JLR200 (2006). - DOI - PubMed
    1. Wahlstrom A, Sayin SI, Marschall HU & Backhed F Intestinal Crosstalk between Bile Acids and Microbiota and Its Impact on Host Metabolism. Cell metabolism 24, 41–50, doi:10.1016/j.cmet.2016.05.005 (2016). - DOI - PubMed
    1. Fiorucci S & Distrutti E Bile Acid-Activated Receptors, Intestinal Microbiota, and the Treatment of Metabolic Disorders. Trends in molecular medicine 21, 702–714, doi:10.1016/j.molmed.2015.09.001 (2015). - DOI - PubMed
    1. Brestoff JR & Artis D Commensal bacteria at the interface of host metabolism and the immune system. Nature immunology 14, 676–684, doi:10.1038/ni.2640 (2013). - DOI - PMC - PubMed

Publication types

MeSH terms

Substances