. 2020 Jan;577(7790):376-380.
doi: 10.1038/s41586-019-1864-1. Epub 2019 Dec 25.

A sensory appendage protein protects malaria vectors from pyrethroids

Affiliations

A sensory appendage protein protects malaria vectors from pyrethroids

Victoria A Ingham et al. Nature. 2020 Jan.

Abstract

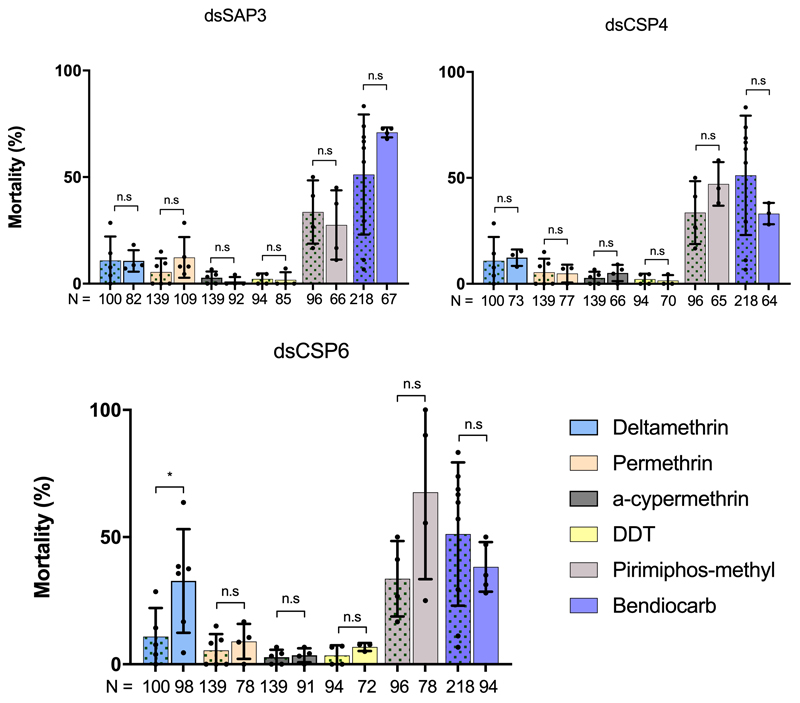
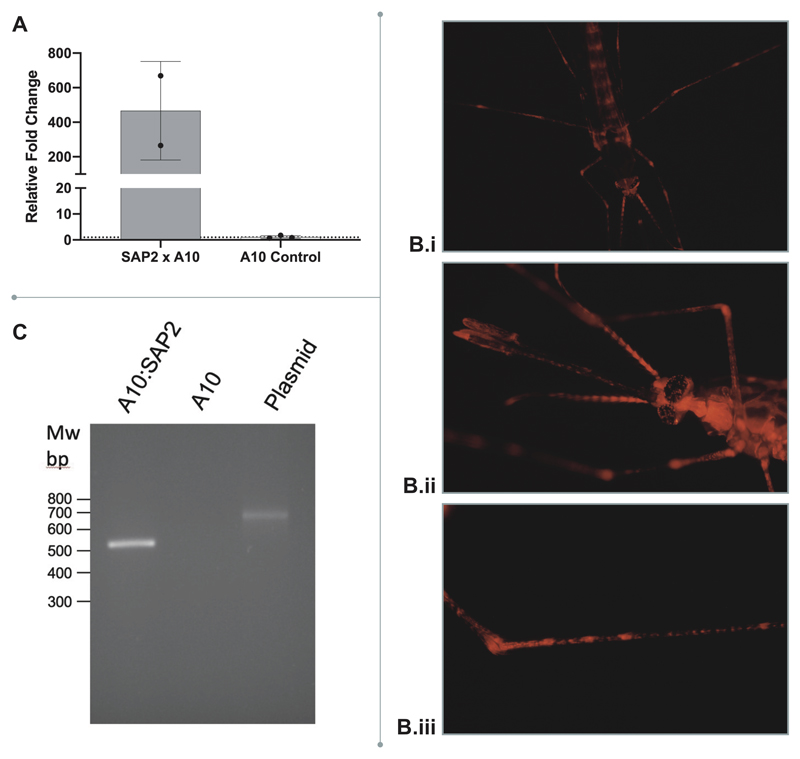
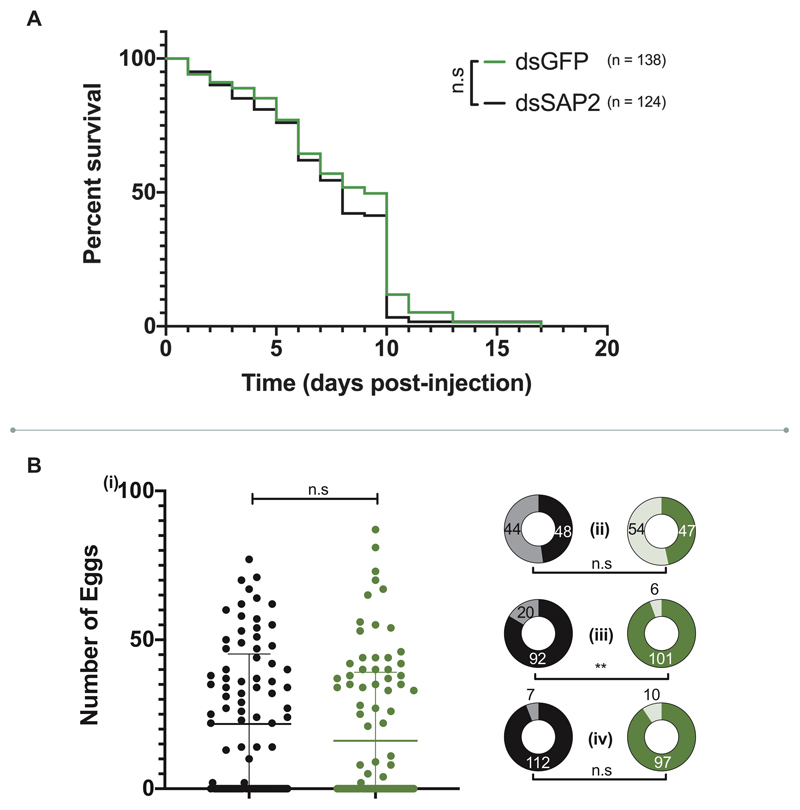
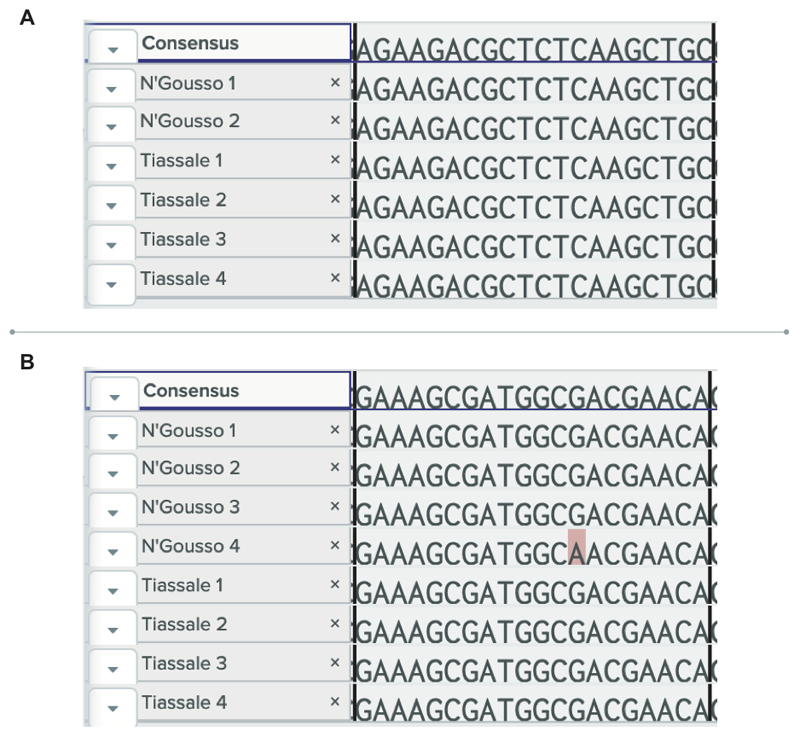
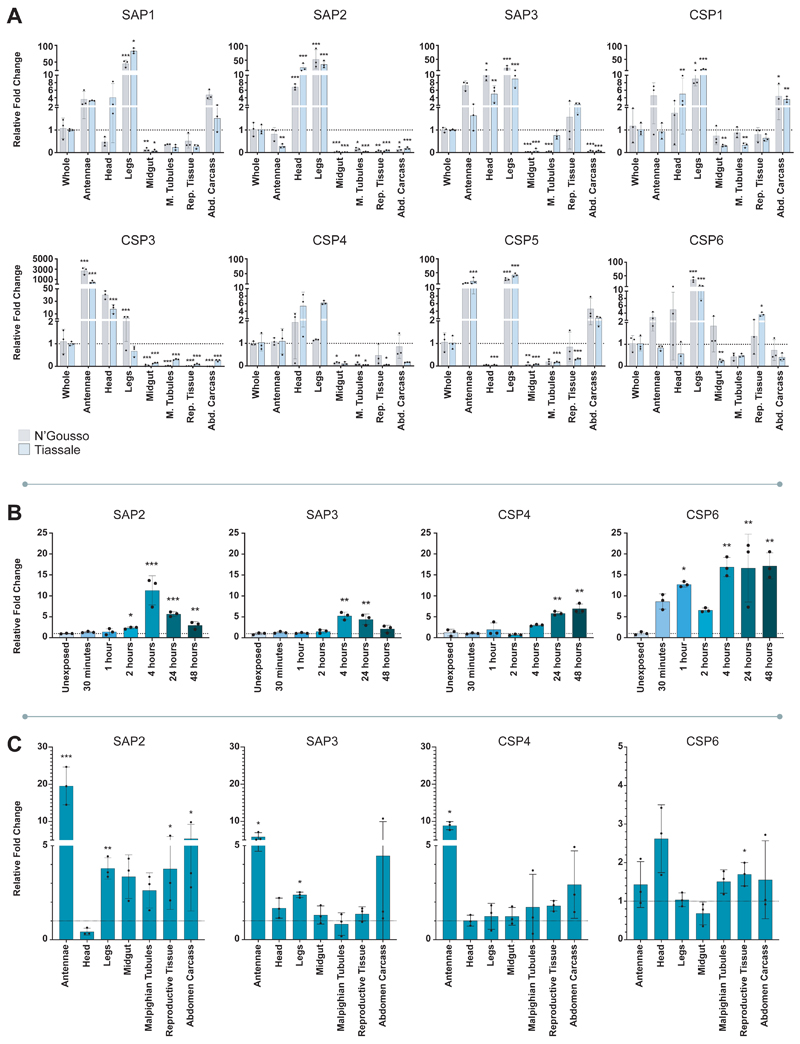
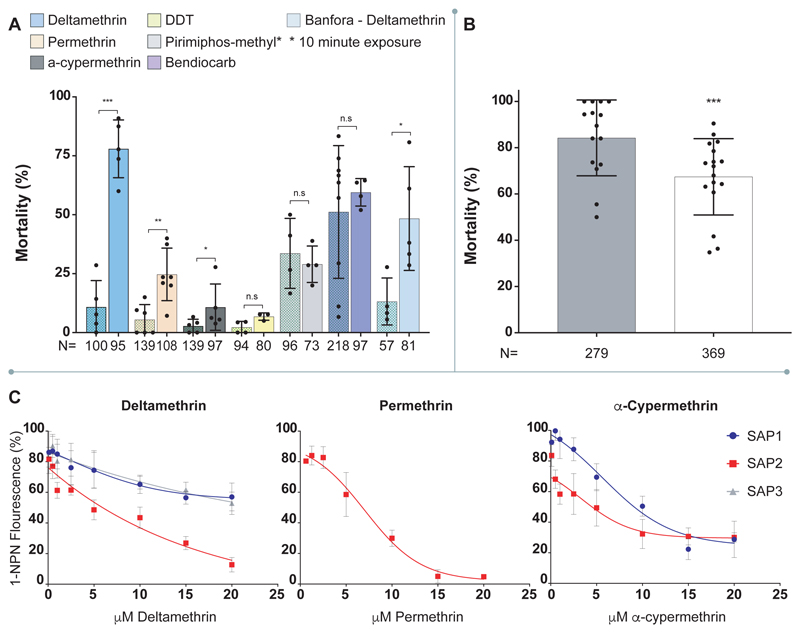
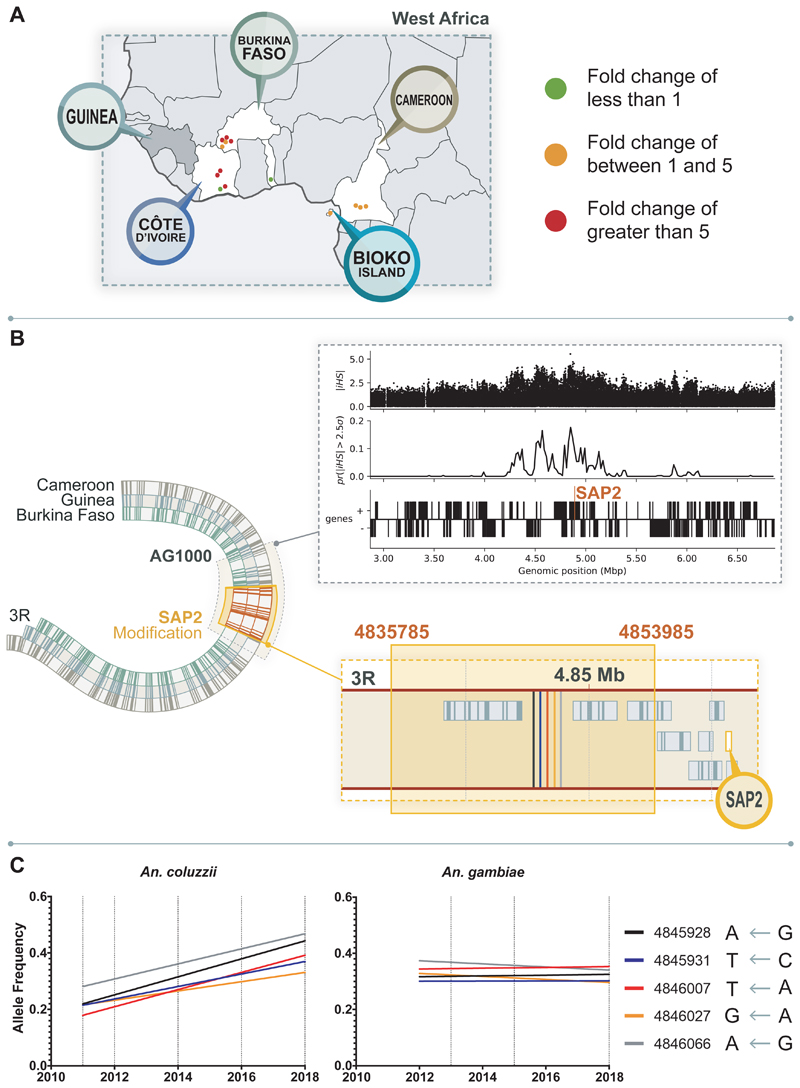
Pyrethroid-impregnated bed nets have driven considerable reductions in malaria-associated morbidity and mortality in Africa since the beginning of the century1. The intense selection pressure exerted by bed nets has precipitated widespread and escalating resistance to pyrethroids in African Anopheles populations, threatening to reverse the gains that been made by malaria control2. Here we show that expression of a sensory appendage protein (SAP2), which is enriched in the legs, confers pyrethroid resistance to Anopheles gambiae. Expression of SAP2 is increased in insecticide-resistant populations and is further induced after the mosquito comes into contact with pyrethroids. SAP2 silencing fully restores mortality of the mosquitoes, whereas SAP2 overexpression results in increased resistance, probably owing to high-affinity binding of SAP2 to pyrethroid insecticides. Mining of genome sequence data reveals a selective sweep near the SAP2 locus in the mosquito populations of three West African countries (Cameroon, Guinea and Burkina Faso) with the observed increase in haplotype-associated single-nucleotide polymorphisms mirroring the increasing resistance of mosquitoes to pyrethroids reported in Burkina Faso. Our study identifies a previously undescribed mechanism of insecticide resistance that is likely to be highly relevant to malaria control efforts.


Conflict of interest statement

The authors declare that they have no competing interests.

Figures

Extended Data Figure 1
Extended Data Figure 1. Chemosensory protein cluster.
A. Schematic of the region surrounding the shared haplotype block found in the 1000 genomes data with all chemosensory proteins in the cluster highlighted in yellow. Genes displayed in order of appearance, left to right, are as follows: AGAP008046, AGAP013713, AGAP008047, AGAP008048, AGAP008049, AGAP008050, AGAP008051 (SAP1), AGAP008052 (SAP2), AGAP008053, AGAP008054 (SAP3), AGAP008055 (CSP3), AGAP008056, AGAP029127 (CSP5, previously AGAP008058), AGAP008059 (CSP1), AGAP008060, AGAP008061 and AGAP008062 (CSP4). B. cDNA bootstrap consensus tree inferred from 1000 replicates using the maximum likelihood method; the percentage of replicate trees with the associated clustering are shown next to the branches. Yellow indicates the sensory appendage proteins, orange the remaining chemosensory proteins in the 3R cluster and black dotted lines show CSP6, which is located on 2R. Alternative isoforms are represented with -RX, with X proceeding alphabetically dependent on number of splice variants.
Extended Data Figure 2
Extended Data Figure 2. Overexpression of CSP family in a multi-resistant Anopheles population.
The left panel shows mean relative fold change of each CSP in Tiassalé mosquitoes (blue) compared to the susceptible control N’Gousso (grey) as determined by qPCR, the right panel compared to the susceptible population Kisumu (grey). Points show 3 biological replicates and error bars show standard deviation. * p ≤ 0.05; ** p ≤ 0.01; *** p ≤ 0.001. Statistical significance calculated by an ANOVA followed by Dunnett’s post hoc test; p-values are in Supplementary Table 2.
Extended Data Figure 3
Extended Data Figure 3. Expression levels of non-induced chemosensory proteins post-deltamethrin exposure in Tiassalé.
A. Expression levels of the remaining four CSPs at various time points post-deltamethrin exposure in the multi-resistant population Tiassalé. B. Tissue specific induction of these four CSPs 4-hours post-deltamethrin exposure. The data show mean of 3 biological replicates ± standard deviation. * p ≤ 0.05; ** p ≤ 0.01; *** p ≤ 0.001. Statistical significance calculated by an ANOVA followed by Dunnett’s post hoc test. If the data was non-normal, data was analysed using Kruskall-Wallis followed by a Dunn’s post hoc test; p-values are in Supplementary Table 2.
Extended Data Figure 4
Extended Data Figure 4. Efficacy of RNAi.
mRNA knockdown of whole female mosquitoes 72-hours post injection compared to GFP injected controls. Mean of 3 biological replicates and standard deviation shown.
Extended Data Figure 5
Extended Data Figure 5. Phenotype of other induced CSPs to a panel of insecticides.
Effect of attenuation of (a) dsSAP3 (ndeltamethrin = 4; npermethrin = 5; nα-cypermethrin = 3; nDDT = 3; npirimiphos-methyl = 3; nbendiocarb = 4) (b) dsCSP4 (ndeltamethrin = 3; npermethrin = 3; nα-cypermethrin = 3; nDDT = 3; npirimiphos-methyl = 3; nbendiocarb = 3) and (c) dsCSP6 (ndeltamethrin = 6; npermethrin = 4; nα-cypermethrin = 4; nDDT = 3; npirimiphos-methyl = 4; nbendiocarb = 5) on mortality after insecticide exposure in Tiassalé mosquitoes (right bars) compared to dsGFP injected controls (left bars, green patterned; ndeltamethrin = 5; npermethrin = 5; nα-cypermethrin = 5; nDDT = 4; npirimiphos-methyl = 4; nbendiocarb = 8). Analysis of mortality data was done using an ANOVA test followed by a Tukey post hoc test, n.s indicates a non-significant change in mortality, * p ≤ 0.05. dsCSP6 μmortality = 11.7% to 31.6%, p = 0.0474. N shows number of individual mosquitoes used for phenotyping; points show the number of bioassay replicates per group. Error bars show standard deviation.
Extended Data Figure 6
Extended Data Figure 6. Characterisation of SAP2 in the transgenic line.
A. Mean mRNA expression of SAP2 overexpression in the SAP2 x A10 transgenic line (n=2) compared to SAP2 in the A10 x G3 control (n = 3). Error bars represent standard deviation and points show each biological replicate. B. mCherry under the Polyubiquitin c A10 promoter demonstrating (i) ubiquitous expression; (ii) expression in the head; (iii) expression in the legs as shown previously by Adolfi et al. 2018; these results were tested across over a hundred independent mosquito screenings. C. Intron splicing confirmed by PCR in A10 x SAP2 and negative control A10 mosquitoes compared to plasmid DNA: pUAS-SAP2. Size of PCR product with and without synthetic intron 647bp and 534bp, respectively. MW: 100bp DNA ladder. 2 samples A10 x SAP2 and 2 control samples A10 (each sample: pool of 5 females, 4 days old, unfed) were tested and repeated in two PCRs.
Extended Data Figure 7
Extended Data Figure 7. Effect of dsSAP2 injection on Tiassalé fitness.
A. Longevity of dsSAP2 (black) compared to dsGFP controls (green). N shows number of individual mosquitoes used in each group; n.s represents p = 0.113 as calculated by a Mantel-Cox test (two-sided). B. Life history traits in dsSAP2 injected (black) and dsGFP injected (green) females (i) Number of eggs in each group 72-hours post-blood meal, median and interquartile range displayed; (ii) Proportion of females with eggs (Dark shading are females with eggs, light without; p = 0.4382); (iii) Mortality post-blood meal (Dark shading are females alive post-blood meal, light those dead; p = 0.0052); (iv) Blood feeding proportions (Dark shading are blood fed females, light non-blood fed; p = 0.3257); for dsSAP2 injected and dsGFP injected controls (green). Numbers show total individual females in each group. Significance in (i) as calculated by a two tailed Mann-Whitney U test (n.s represents p = 0.0657); (ii), (iii) and (iv) through a chi-squared test. ** p ≤ 0.01.
Extended Data Figure 8
Extended Data Figure 8. Mortality of An. coluzzii field populations.
Temporal plot of mortality from 2011 to 2018 of An. coluzzii mosquitoes to 0.05% WHO tube deltamethrin exposure, Δ is the posterior median change in mortality from 2011 to 2018, N is number of experiments included (minimum sample size for any given data point = 14), P the posterior probability that resistance (the proportion of posterior samples where the April 2018 mean exceeds the corresponding value in January 2011) has increased over the time period. The blue line indicates the posterior median of a logistic model fit to binomial test results; the two parameters of the logistic function were assigned uninformative (Cauchy(0, 1)) priors. The model was fit using Stan using 4 chains and 800 iterations per chain (400 of which were discarded as warm-up in each case); all parameters had Rhat < 1.1 indicating convergence. The shading indicates the 90% predictive interval on the mean. Data and Figure kindly provided by Dr Hyacinthe Toé, Dr Ben Lambert and Dr Thomas Churcher.
Extended Data Figure 9
Extended Data Figure 9. Sequencing of SAP2 primer binding sites.
4 N’Gousso individuals and 4 Tiassale individuals were sequenced across the primer binding sites. (a) Complete conservation of sequence was seen in the forward binding site (b) one N’Gousso individual was heterozygous at one base in the centre of the reverse primer binding site.
Figure 1
Figure 1. CSP expression profiles.
A. Constitutive expression of CSPs in resistant and susceptible strains. mRNA localisation in antennae, head, legs, midgut, Malpighian tubules, reproductive tissue and the remaining abdominal tissues (abdomen carcass) in N’Gousso (grey) and Tiassalé (blue) for each member of the CSP family compared to whole body. B. Induction of CSPs in Tiassalé following pyrethroid exposure. Four CSPs show significant induction of mRNA expression at different time points post-exposure to the pyrethroid insecticide deltamethrin in Tiassalé (results for the non-induced CSPs are shown in Extended Data Figure 3a). C. Tissue-specific profile of CSPs induction in Tiassalé. Tissue-specific induction for the four significantly induced CSPs in the Tiassalé strain, shown 4-hours post deltamethrin exposure, each data point shows exposed compared to unexposed tissues from the same generation (see Extended Data Figure 3b for remaining CSPs). The qPCR data show mean ± standard deviation of three biological replicates. * p ≤ 0.05; ** p ≤ 0.01; *** p ≤ 0.001. Statistical significance was calculated by an ANOVA followed by Dunnett’s post hoc test; where normalisation was not possible, data was analysed using Kruskall-Wallis followed by a Dunn’s post hoc test in A. and B. In C. significance was calculated by a two-tailed t-test; p-values are provided in Supplementary Table 2; n = 3 for each replicate.
Figure 2
Figure 2. SAP2 mediates resistance to pyrethroid insecticides.
A. Effect of SAP2 knock down on mortality in multi-resistant Anopheles populations in response to a panel of insecticides (rightmost bar) compared to GFP-injected controls (leftmost bar; patterned). Tiassalé: Deltamethrin (blue; nGFP;SAP2 = 5;5); Permethrin (pink; nGFP;SAP2 = 6;7); α-cypermethrin (dark grey; nGFP;SAP2 = 5;5); DDT (yellow; nGFP;SAP2 = 4;3), primiphos-methyl (light grey; nGFP;SAP2 = 4;4) and Bendiocarb (dark blue nGFP;SAP2 = 9;4). Banfora: Deltamethrin (light blue; nGFP;SAP2 = 4;5). N represents the total number of females used across all replicates. B. Transgenic over-expression of SAP2 in susceptible G3 mosquitoes reduces mortality after permethrin exposure. Bars represent control (grey; n = 15) and SAP2 overexpression (white; n = 17). N represents the total number of females used across all replicates. C. Competitive binding assays of the three SAP proteins to three pyrethroid insecticides. Only instances with binding shown; no binding for: SAP3 nor SAP1 with permethrin; SAP3 with α-cypermethrin; any SAP with bendiocarb or pirimiphos-methyl. The data show mean ± standard deviation. * p ≤ 0.05; ** p ≤ 0.01; *** p ≤ 0.001; ns p > 0.05. Statistical significance in 2A and 2B calculated by an ANOVA test followed by a Tukey post hoc test; p-values are provided in Supplementary Table 2
Figure 3
Figure 3. SAP2 is up-regulated and under selection in multiple countries across West Africa.
A. Points represent significantly differential expression of SAP2 in pyrethroid resistant mosquitoes in two sister species (An. coluzzii or An. gambiae) compared to susceptible populations (Extended Table 1, from ). Significant (plimma;BH-corrected ≤ 0.05) fold changes are represented by a traffic light system. Countries with SAP2 either (i) significantly up-regulated and/or (ii) involved in the selective sweep are highlighted with a pin. No transcriptomic data is available for Guinea. Map created expressly for this manuscript by Manuela Bernardi. B. Schematic representation of the range of the selective sweep found in Guinea, Burkina Faso and Cameroon with selective sweep found across these regions in the Anopheles 1000 genomes highlighted in grey . Observed iHS signal from Guinea is shown as follows, from top to bottom panels: Raw iHS statistics per SNP, normalised by chromosome in allele frequency bins; summarised iHS in windows of 20kbp by proportion of SNPs exceeding 2.5 standard deviations ; and genes in this region with SAP2 annotated. Highlighted in yellow are the range of the 55 SNPs tagging this haplotype across the three countries. A zoomed in area shows the approximate location of the five haplotype tagging SNPs in proximity to SAP2 (more detail in Extended Data Figure 1A). (C) Fitted trend in frequency of the derived haplotype associated SNPs in field populations from Burkina Faso: (i) An. coluzzii populations collected from Tengrela from 2011 to 2018 and (ii) An. gambiae s.s. samples collected in 2013 and 2015 from Bakaridjan, Burkina Faso and 2018 from Tiefora, Burkina Faso. Dates when samples were sequenced are indicated by a dotted line. SNP data is shown in the legend, including the locus and the alternate allele (left) and PEST allele (right).

Comment in

References

    1. Bhatt S, et al. The effect of malaria control on Plasmodium falciparum in Africa between 2000 and 2015. Nature. 2015;526:207–211. - PMC - PubMed
    1. WHO. World Malaria Report. Geneva: 2018.
    1. Hawley WA, et al. Community-wide effects of permethrin-treated bed nets on child mortality and malaria morbidity in western Kenya. Am J Trop Med Hyg. 2003;68:121–127. - PubMed
    1. Churcher TS, Lissenden N, Griffin JT, Worrall E, Ranson H. The impact of pyrethroid resistance on the efficacy and effectiveness of bednets for malaria control in Africa. Elife. 2016;5:e16090. - PMC - PubMed
    1. Protopopoff N, et al. Effectiveness of a long-lasting piperonyl butoxide-treated insecticidal net and indoor residual spray interventions, separately and together, against malaria transmitted by pyrethroid-resistant mosquitoes: a cluster, randomised controlled, two-by-two fact. Lancet. 2018;391:1577–1588. - PMC - PubMed

Publication types

LinkOut - more resources