. 2020 Sep;72(3):965-981.
doi: 10.1002/hep.31092. Epub 2020 Aug 16.

Identification of Four Immune Subtypes Characterized by Distinct Composition and Functions of Tumor Microenvironment in Intrahepatic Cholangiocarcinoma

Affiliations

Identification of Four Immune Subtypes Characterized by Distinct Composition and Functions of Tumor Microenvironment in Intrahepatic Cholangiocarcinoma

Sylvie Job et al. Hepatology. 2020 Sep.

Abstract

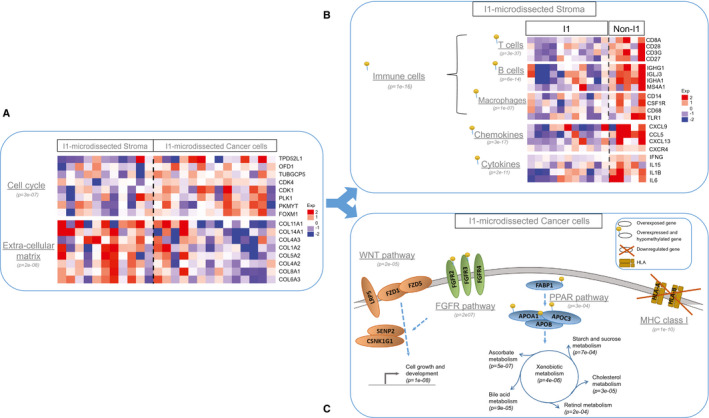
Background and aims: Intrahepatic cholangiocarcinoma (ICC) is a severe malignant tumor in which the standard therapies are mostly ineffective. The biological significance of the desmoplastic tumor microenvironment (TME) of ICC has been stressed but was insufficiently taken into account in the search for classifications of ICC adapted to clinical trial design. We investigated the heterogeneous tumor stroma composition and built a TME-based classification of ICC tumors that detects potentially targetable ICC subtypes.

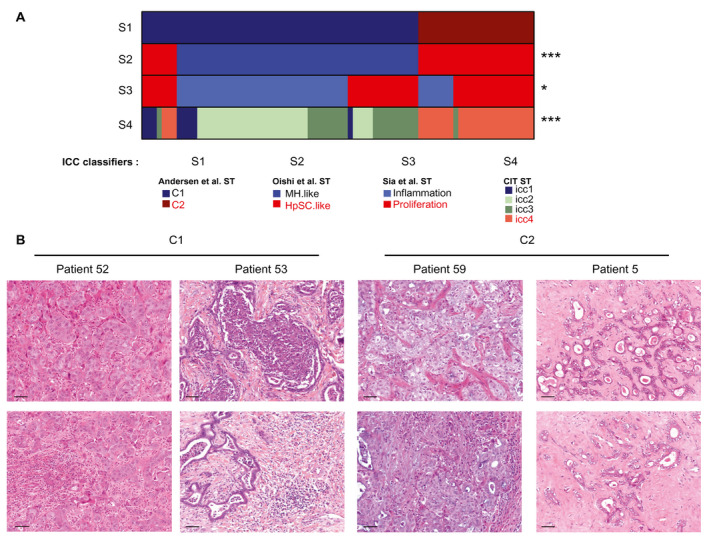
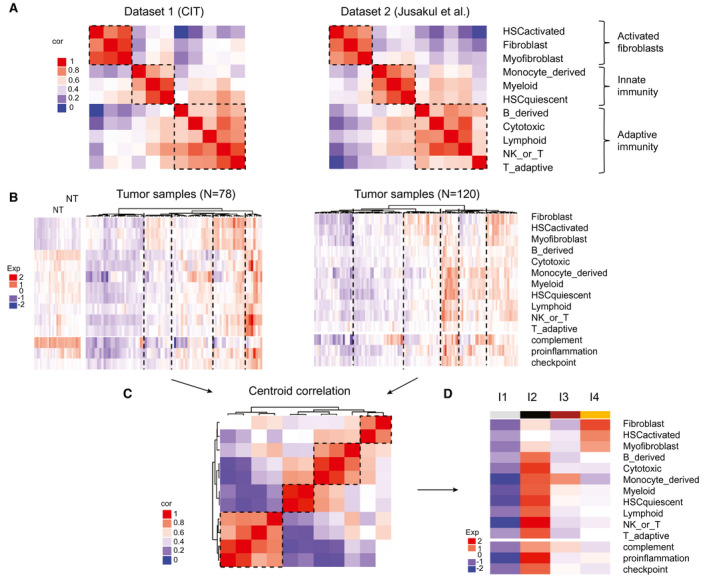
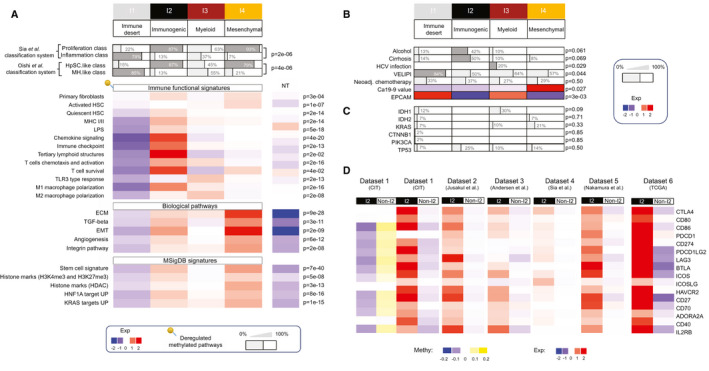
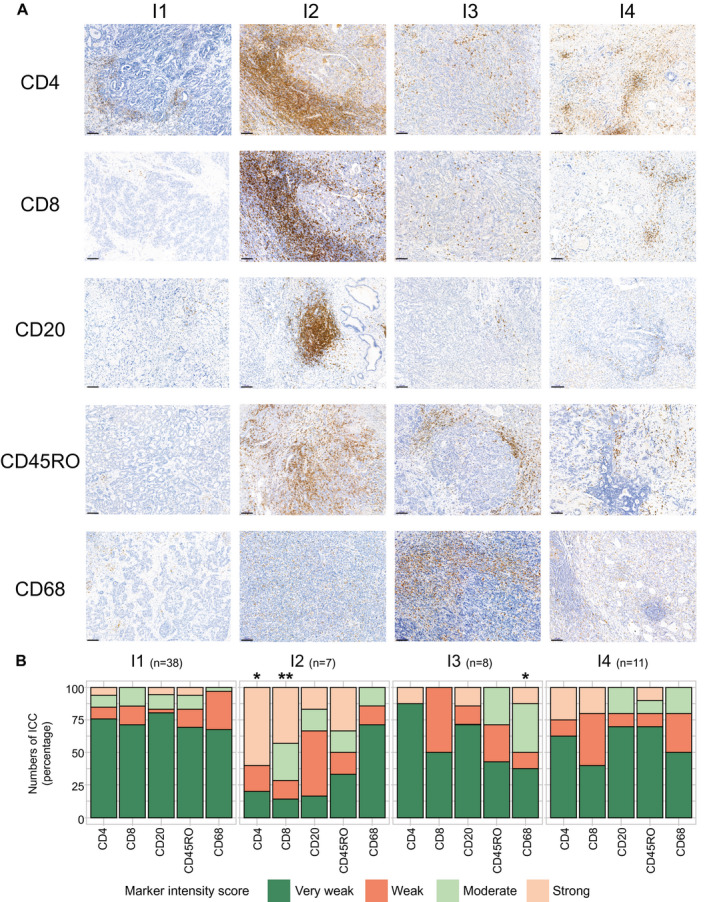
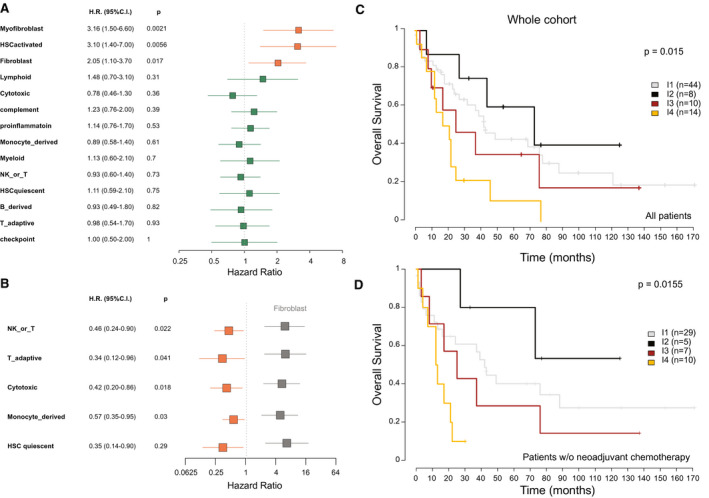
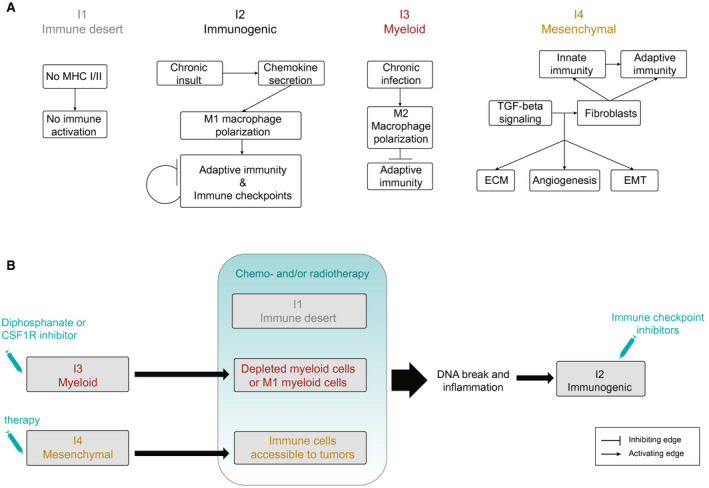
Approach and results: We established the bulk gene expression profiles of 78 ICCs. Epithelial and stromal compartments of 23 ICCs were laser microdissected. We quantified 14 gene expression signatures of the TME and those of 3 functional indicators (liver activity, inflammation, immune resistance). The cell population abundances were quantified using the microenvironment cell population-counter package and compared with immunohistochemistry. We performed an unsupervised TME-based classification of 198 ICCs (training set) and 368 ICCs (validation set). We determined immune response and signaling features of the different immune subtypes by functional annotations. We showed that a set of 198 ICCs could be classified into 4 TME-based subtypes related to distinct immune escape mechanisms and patient outcomes. The validity of these immune subtypes was confirmed over an independent set of 368 ICCs and by immunohistochemical analysis of 64 ICC tissue samples. About 45% of ICCs displayed an immune desert phenotype. The other subtypes differed in nature (lymphoid, myeloid, mesenchymal) and abundance of tumor-infiltrating cells. The inflamed subtype (11%) presented a massive T lymphocyte infiltration, an activation of inflammatory and immune checkpoint pathways, and was associated with the longest patient survival.

Conclusion: We showed the existence of an inflamed ICC subtype, which is potentially treatable with checkpoint blockade immunotherapy.


Figures

Figure 1
Figure 1
The existing molecular subtypes of ICC display highly variable TME patterns. (A) Visualization of the contingency tables of four ICC classifiers (S1‐S4) applied to the 78 ICC transcriptomes of this study. S1: Andersen et al.’s classification.11 S2: Oishi et al.’s classification.12 S3: Sia et al.’s classification.13 S4: this study. S1 was used as reference. The order of ICC tumors along the horizontal axis is the same for all the classifications. ST, subtypes. *P < 0.05, ***P < 0.001. P: Chi‐square‐test P value. (B) Histological analysis of tumors assigned to the C1 and C2 molecular subtypes of Andersen et al.’s classification. Representative tumor cells (top) and TMEs (bottom) for a given ICC patient. Scale bar: 50 µm. HpSC.like, hepatic stem cell; MH.like, Mature hepatocyte; ST, subtype.
Figure 2
Figure 2
A TME‐based classification stratifies ICCs into four immune subtypes. (A) Correlation matrices of 11 signatures of immune and stromal cell populations in two data sets. Dataset1 (CIT): this study; Dataset2 (Jusakul et al.): GSE89749.20 Color scale: Pearson correlation coefficient from 0 (blue) to 1 (red). (B) Hierarchical clustering of the ICCs of the 2 data sets using expression levels of 14 stromal and immune signatures. The number of TME‐based clusters for each data set was determined by the silhouette metric. Color scale: expression level from −2 (blue) to +2 (red). (C) Centroid correlation of the clusters identified in (B) highlighting the existence of four TME‐based subtypes. Color scale: Pearson correlation coefficient from 0 (blue) to 1 (red). (D) Heatmap of the centroids of the four TME‐based subtypes labeled from I1 to I4. Color scale: expression level from low (blue) to high (red). Cor, correlation; exp, expression; NK, natural killer; NT, nucleotide.
Figure 3
Figure 3
Functional orientation of the different ICC immune subtypes. (A‐C) Clinico‐molecular covariates attributed to the different immune subtypes with their phenotypic denominations. (A) Top: proportion of samples belonging to the reported ICC molecular classification. Bottom: heatmap of the mean expression levels of gene sets involved in the indicated pathways and Molecular Signatures Database signatures. Color scale: from low (blue) to high (red). P values: hypergeometric test. Pins: deregulated methylated pathways. (B) Proportion of samples harboring the indicated clinical covariate in a given immune subtype. VELIPI; vascular emboli, lymphatic invasion, and perineural invasion histological criteria. Ca19‐9 value: serum concentration of the tumor marker carbohydrate antigen 19‐9. Neoadj: neoadjuvant. Color scale: expression level from −2 (blue) to +2 (red). (C) Proportion of samples harboring the indicated mutated genes. (D) Mean expression levels of a set of immune checkpoint molecules in the I2 compared with the non‐I2 subtypes in all six ICC data sets. Color scale: expression level (Exp) from −2 (blue) to +2 (red). DNA methylation levels of the immune checkpoints in the data set from this study (CIT). Color scale: beta value (methylation [Methy]) from −0.2 (blue) to +0.2 (yellow). ADORA2A, adenosine A2A receptor; BTLA, B and T lymphocyte attenuator; EMT, epithelial‐mesenchymal transition; EPCAM, epithelial cell adhesion molecule; Exp, expression; HAVCR2, hepatitis A virus cellular receptor 2; HDAC, histone deacetylase; ICOS, inducible T cell costimulatory; ICOSLG, inducible T cell costimulatory ligand; IL2RB, interleukin 2 receptor subunit beta; LAG3, lymphocyte activation gene 3; PDCD, programmed cell‐death; PDCD1LG2, Programmed Cell Death 1 Ligand 2; PIK3CA, phosphatidylinositol‐4,5‐bisphosphate 3‐kinase catalytic subunit alpha; TP53, tumor protein 53.
Figure 4
Figure 4
Tissue immunostaining supports the existence of distinct ICC immune subtypes. (A) Representative immunohistochemical images of formalin‐fixed paraffin‐embedded ICC samples belonging to the indicated TME‐based subtypes and stained with the indicated specific antibodies. Visualization of different areas of the same tumor sample belonging to the indicated subtypes. Scale bar: 100 µm. (B) Quantification of staining intensities for the indicated immune markers performed in 64 ICC samples grouped into immune subtypes labeled from I1 to I4. *P < 0.05, **P < 0.01 (analysis of variance test).
Figure 5
Figure 5
Functional features of laser microdissected stromal and tumor cells of immunologically silent ICCs. (A) Mean expression levels of genes involved in cell cycle regulation or extracellular matrix remodeling in I1 ICC samples enriched in stromal or cancer cells. (B) Mean expression levels of the immune response genes most differentially expressed in I1 and non‐I1 ICCs in microdissected stromal cells. (C) Sketch of the genes and pathways most differentially expressed in I1 and non‐I1 microdissected cancer cells. Gray stripe: plasma membrane. (A‐C) P values: hypergeometric test. Color scale: expression level (Exp) from −2 (blue) to +2 (red). Pins: deregulated methylated pathways. APO, apolipoprotein; CDK, cyclin‐dependent kinase; COL11A1, collagen type XI alpha 1 chain; COL14A1, collagen type XIV alpha 1 chain; CSNK1G1, casein kinase 1 gamma 1; FABP1, fatty acid–binding protein 1; FOXM1, forkhead box M1; FZD1, frizzled homolog 1; HLA, human leukocyte antigen; LRP5, low‐density lipoprotein receptor‐related protein 5; OFD1, oral‐facial‐digital syndrome type 1; PKMYT, protein kinase, membrane associated tyrosine/threonine 1; PLK1, polo‐like kinase 1; PPAR, peroxisome proliferator‐activated receptor; SENP2, sentrin‐specific protease 2; TPD52L1, tumor protein D52 like 1; TUBGCP5, tubulin gamma complex associated protein 5.
Figure 6
Figure 6
Correlation between ICC immune subtype and patient overall survival. Relationship between immune and stromal signatures and patient overall survival in the Paul‐Brousse patient cohort as revealed by Cox analysis. H.R., hazard ratio. Blue squares: P ≥ 0.05. Orange squares: P < 0.05. (A) Univariate Cox analysis. P: logrank‐test P values. (B) Bivariate Cox analysis. P: Wald‐test P values. Gray squares: fibroblast hazard ratios. Orange squares: hazard ratios of the indicated stromal and immune signatures (P < 0.05). (C,D) Kaplan–Meier curves of overall patient survival for the indicated ICC immune subtypes. P: logrank‐test P value. (C) Whole cohort: Paul‐Brousse cohort (n = 78). (D) Paul‐Brousse patients who were not given neoadjuvant chemotherapy (n = 51). C.I., confidence interval; NK, natural killer; w/o, without.
Figure 7
Figure 7
Outline of (A) the mechanisms to evade tumor immune elimination and (B) the possible therapeutic strategies for the different ICC immune subtypes. CSF1R, colony‐stimulating factor 1 receptor; ECM, extracellular matrix; EMT, epithelial‐mesenchymal transition.

References

    1. Poultsides GA, Zhu AX, Choti MA, Pawlik TM. Intrahepatic cholangiocarcinoma. Surg Clin North Am 2010;90:817‐837. - PubMed
    1. Rizvi S, Khan SA, Hallemeier CL, Kelley RK, Gores GJ. Cholangiocarcinoma—evolving concepts and therapeutic strategies. Nat Rev Clin Oncol 2018;15:95‐111. - PMC - PubMed
    1. Valle J, Wasan H, Palmer DH, Cunningham D, Anthoney A, Maraveyas A, et al. Cisplatin plus gemcitabine versus gemcitabine for biliary tract cancer. N Engl J Med 2010;362:1273‐1281. - PubMed
    1. Sirica AE. The role of cancer‐associated myofibroblasts in intrahepatic cholangiocarcinoma. Nat Rev Gastroenterol Hepatol 2011;9:44‐54. - PubMed
    1. Sirica AE, Gores GJ. Desmoplastic stroma and cholangiocarcinoma: clinical implications and therapeutic targeting. Hepatol Baltim Md 2014;59:2397‐2402. - PMC - PubMed

Publication types

MeSH terms

Substances