

Generation of models from existing models composition: An application to agrarian sciences
- PMID: 31877130
- PMCID: PMC6932759
- DOI: 10.1371/journal.pone.0214778
Generation of models from existing models composition: An application to agrarian sciences
Abstract
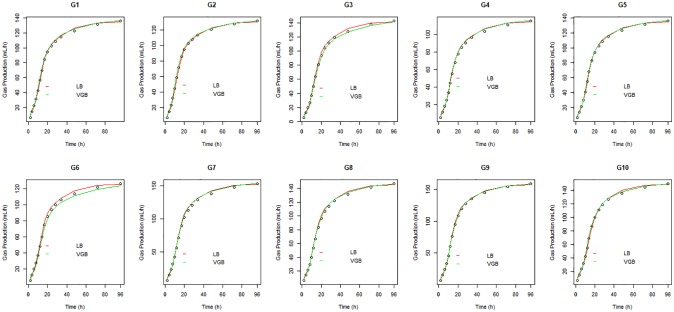
Mathematical models that describe gas production are widely used to estimate the rumen degradation digestibility and kinetics. The present study presents a method to generate models by combining existing models and to propose the von Bertalanffy-Gompertz two-compartment model based on this method. The proposed model was compared with the logistic two-compartment one to indicate which best describes the kinetic curve of gas production through the semi-automated in vitro technique from different pinto peanut cultivars. The data came from an experiment grown and harvested at the Far South Animal Sciences station (Essul) in Itabela, BA, Brazil and gas production was read at 2, 4, 6, 8, 10, 12, 14, 17, 20, 24, 28, 32, 48, 72, and 96 h after the start of the in vitro fermentation process. The parameters were estimated by the least squares method using the iterative Gauss-Newton process in the software R version 3.4.1. The best model to describe gas accumulation was based on the adjusted coefficient of determination, residual mean squares, mean absolute deviation, Akaike information criterion, and Bayesian information criterion. The von Bertalanffy-Gompertz two-compartment model had the best fit to describe the cumulative gas production over time according to the methodology and conditions of the present study.
Conflict of interest statement
The authors have declared that no competing interests exist.
Figures


References
-
- JACOVETTI R. Agronomic and nutritional performance of "Mulato II" grass under doses and nitrogen sources. Tese, Goias Federal University. 2016. https://repositorio.bc.ufg.br/tede/handle/tede/6793
-
- MERTENS DR. Rate and extension of digestion In: FORBES J.M.; FRANCE J. (Eds.). QUALITATIVE ASPECTS OF RUMINANT DIGESTION AND METABOLISM, Cambridge. [Proceedings …], Cambridge-UK: CAB International; 1993. pp. 13–51.
-
- FARIAS LN, VASCONCELOS VR, CARVALHO FFR, SARMENTO JLR. Avaliation of two-compartment logistic and Gompertz mathematical models to estimate gas production from babassu (Orbignya martiana) meal and pie using the semi-automated in vitro technique. Arquivo Brasileiro de Medicina Veterinária e Zootecnia, 2011; 63:136–142.
-
- SILVA NA, LIMA RR, SILVA FF, MUNIZ JA. Bayesian hierarchical model applied to genetic evaluation of beef cattle growth curves. Arquivo Brasileiro de Medicina Veterinária e Zootecnia, 2010; 62:409–418.
-
- KOOPS WJ. Multiphasic growth curve analysis. Growth, Bar Harbor, 1986; 50:169–177. . - PubMed
MeSH terms
LinkOut - more resources
Full Text Sources
