. 2019 Dec 26;14(12):e0226246.
doi: 10.1371/journal.pone.0226246. eCollection 2019.

Flock sensitivity and specificity of pooled fecal qPCR and pooled serum ELISA for screening ovine paratuberculosis

Affiliations

Flock sensitivity and specificity of pooled fecal qPCR and pooled serum ELISA for screening ovine paratuberculosis

Yoann Mathevon et al. PLoS One. .

Abstract

The aim of our study was to evaluate the flock sensitivity and specificity of fecal qPCR and serum ELISA using pooled samples for screening paratuberculosis in French sheep. Using individual feces with low or high qPCR Ct values from ewes sampled in 14 infected flocks, a total of 555 pools of size 5, 10 and 20 were created by diluting individual materials in negative feces and analysed using a commercial IS900 qPCR kit. The relative performances of pooled serum ELISA analysis were evaluated based on the analysis of 181 different pools of size 5 and 10, composed of individual serum samples of various individual S/P values. Results showed that for pools of size 5, 10 or 20, individual fecal samples with low Ct values were invariably detected. Conversely fecal samples with high Ct values were associated with a lower detection rate in both pools of size 5 (87.0% to 90.0%), 10 (63.0% to 70.7%) and 20 (46.7% to 60.0%). After lowering the decision threshold to 25% and 15% for serum pools of size 5 and 10 respectively, the pooled serum ELISA relative sensitivity ranged between 62.2% and 100.0% depending on the composition of the pools. Finally, a simulation study was carried out to evaluate the performances of 16 screening strategies at flock level, with varying pool size (5 to 20) and number (5 to 60). The use of pooled serum ELISA led to very false positive detection rate ranging between 37.6% and 91.8% in paratuberculosis free flocks and prevents its further use in that context. For infection prevalence ≤ 5%, the flock sensitivity based on pooled fecal qPCR ranged between 39.0% (5 pools of size 10) and 99.9% (300 sampled individuals, with pools of size 5,10 or20), and was always above 93% when the infection prevalence was greater or equal to 15%. We conclude that pooled-fecal qPCR but not pooled-serum ELISA could be a useful tool to detect sheep flocks infected with paratuberculosis.


Conflict of interest statement

The authors have declared that no competing interests exist.

Figures

Fig 1
Fig 1. Schematic representation of the simulation study approach for pooled-fecal qPCR.
ISeqPCR: individual sensitivity; ISpqPCR: individual specificity; PRSeqPCR: pooled-sample relative sensitivity for fecal qPCR; PRSpqPCR: pooled-sample relative specificity for fecal qPCR; LC sample: Low Contaminated (Ct ≥ 30) fecal sample; HC sample: Highly Contaminated (Ct < 30) fecal sample.
Fig 2
Fig 2. Distribution of individual serum ELISA S/P values and fecal qPCR Ct results in 14 paratuberculosis infected and 2 paratuberculosis-free sheep flocks.
A: fecal qPCR Ct in infected flocks; B: ELISA S/P values in infected flocks; C: ELISA S/P values in paratuberculosis-free flocks.
Fig 3
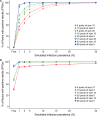
Fig 3. Proportion of flocks with at least one test-positive pool, according to number and size of tested pools and simulated infection prevalence.
A (top): screening strategies based on pooled-fecal qPCR; B (bottom): screening strategies based on pooled-serum ELISA. Red: 50 sampled animals; green: 100 sampled animals; blue: 300 sampled animals.
Fig 4
Fig 4. Number of qPCR-positive fecal pools detected, according to number and size of tested pools and simulated infection prevalence.
A: 10 pools of size 5; B: 5 pools of size 10; C: 20 pools of size 5; D: 10 pools of size 10. For a given simulated infection prevalence, figures in cells give the mean proportion of flocks that yield a given number of qPCR-positive fecal pools.

References

    1. Allworth MB, Kennedy DJ. Progress in national control and assurance programs for ovine Johne’s disease in Australia. Vet Microbiol 2000;77:415–422. 10.1016/S0378-1135(00)00326-6 - DOI - PubMed
    1. Benedictus G, Verhoeff J, Schukken YH, Hesselink JW. Dutch paratuberculosis programme history, principles and development. Vet Microbiol 2000;77:399–413. 10.1016/S0378-1135(00)00325-4 - DOI - PubMed
    1. Groenendaal H, Nielen M, Hesselink JW. Development of the Dutch Johne’s disease control program supported by a simulation model. Prev Vet Med 2003;60:69–90. 10.1016/S0167-5877(03)00083-7 - DOI - PubMed
    1. Kostoulas P, Leontides L, Enoe C, Billinis C, Florou M, Sofia M. Bayesian estimation of sensitivity and specificity of serum ELISA and faecal culture for diagnosis of paratuberculosis in Greek dairy sheep and goats. Prev Vet Med 2006;76:56–73. 10.1016/j.prevetmed.2006.04.006 - DOI - PubMed
    1. Nielsen SS, Toft N. Ante mortem diagnosis of paratuberculosis: a review of accuracies of ELISA, interferon-gamma assay and faecal culture techniques. Vet Microbiol 2008;129:217–35. 10.1016/j.vetmic.2007.12.011 - DOI - PubMed

Publication types

MeSH terms

Substances