. 2020 Mar 6:19:330-338.
doi: 10.1016/j.omtn.2019.10.045. Epub 2019 Nov 26.

Therapeutic Potential of LNP-Mediated Delivery of miR-634 for Cancer Therapy

Affiliations

Therapeutic Potential of LNP-Mediated Delivery of miR-634 for Cancer Therapy

Kentaro Gokita et al. Mol Ther Nucleic Acids. .

Abstract

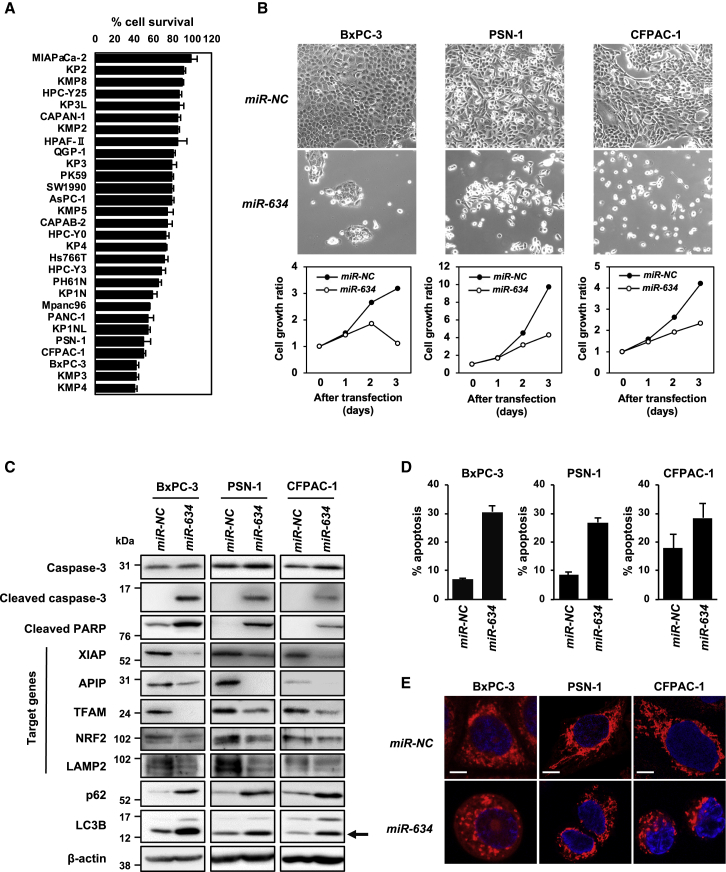
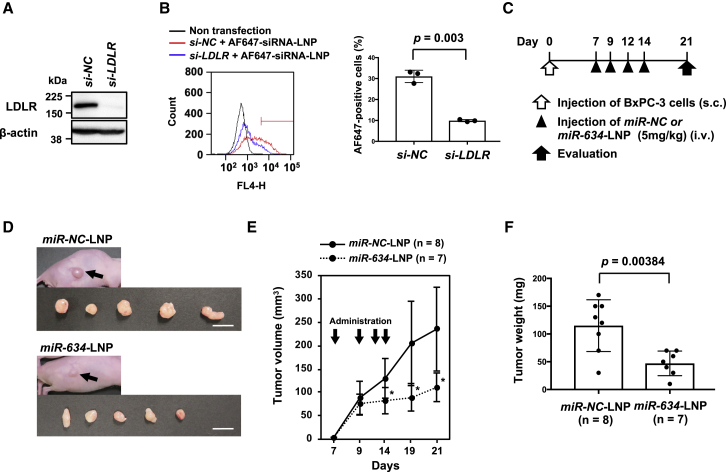
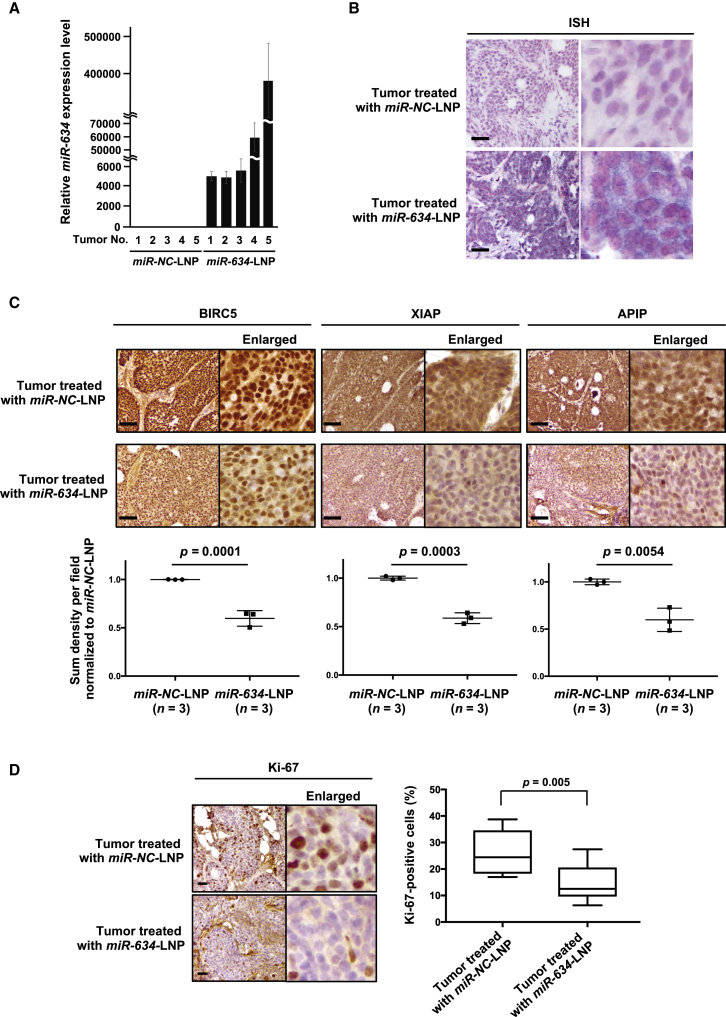
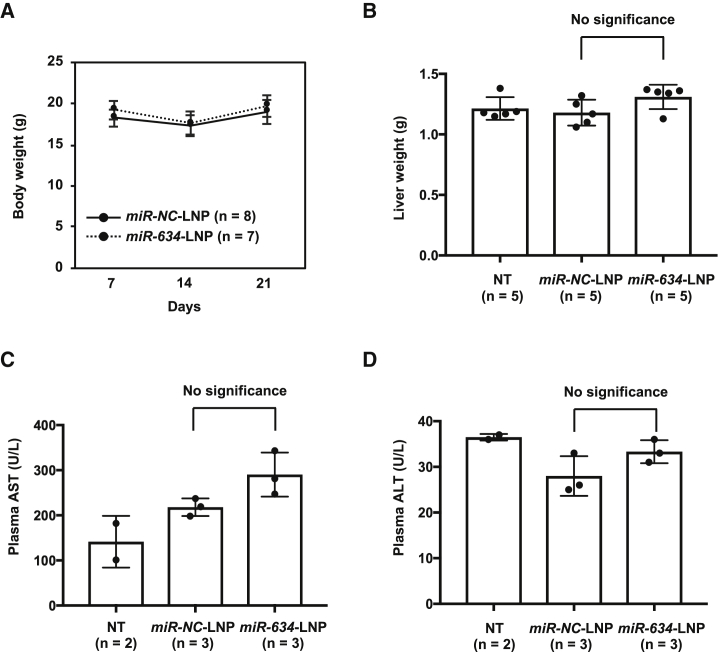
MicroRNAs (miRNAs) are endogenous small noncoding RNAs that negatively regulate gene expression by interfering with the translation or stability of target transcripts. Some tumor-suppressive miRNAs can concurrently target multiple cancer-promoting genes and may be useful as therapeutic anticancer agents. However, the development of drug delivery systems is critical for the implementation of miRNA-based therapeutics. We have previously demonstrated that the enforced expression of miR-634 effectively induces apoptosis by concurrently and directly targeting genes associated with mitochondrial homeostasis, antiapoptosis signaling, antioxidant ability, and autophagy in cancer cells. In the current study, we validated the therapeutic potential of lipid nanoparticle (LNP)-mediated delivery of miR-634 for cancer therapy. We confirmed the ability of enforced expression of miR-634 to induce apoptosis in various cancer cell lines, including pancreatic cancer cells. Intravenous administration of LNPs harboring miR-634 significantly reduced the xenograft tumor growth of BxPC-3 pancreatic cancer cells in mice. These findings suggest that LNP-mediated delivery of miR-634 can potentially be used for cancer therapy.

Keywords: DDS; LNP; cancer therapy; miR-634; microRNA.


Figures

Figure 1
Figure 1
Induction of Apoptosis by miR-634 in Pancreatic Cancer Cell Lines (A) Differential sensitivity to miR-634 overexpression in pancreatic cancer cell lines. (B) Phase-contrast images and growth rate of miR-634-transfected cells. Cells were transfected with 20 nmol/L miR-NC or miR-634, and images were obtained at 3 days after transfection (upper panels). Cell growth rate was assessed with the crystal violet (CV) staining assay, and results are reported as the relative ratio compared with day 0 (lower panels). Error bars indicate SD of triplicate experiments. The error bars are not visualized due to being too small. (C) Western blotting analysis of miR-634-transfected cells. Cell lysates were subjected to SDS-PAGE and immunoreacted with the indicated antibodies. For the detection of LAMP2, cell lysates were prepared under nonreducing conditions (without 2-mercaptoethanol [2-ME]). Arrow indicates the band for LC3B form-II, an autophagosome marker. (D) FACS analysis of the apoptotic cell population. FACS analysis was performed at 3 days after transfection. Cells were collected and stained with Annexin V and propidium iodide (PI). Cell population analysis was performed using an Accuri Flow Cytometer. The percentages of apoptotic cells are indicated in each graph. Error bars indicate SD of triplicate experiments. (E) Representative images of mitochondrial staining. After 3 days of transfection, the cells were stained with 100 nmol/L MitoTracker Red CMX ROS for 30 min at 37°C. After fixation, images were obtained by confocal fluorescence microscopy. Scale bars, 10 μm.
Figure 2
Figure 2
Antitumor Effect of miR-634-LNP Administration in the BxPC-3 Xenograft Model (A) Western blot analysis of LDLR in BxPC-3 cells. Cells were transfected with 20 nmol/L si-NC (negative control) or si-LDLR. Cell lysates were subjected to SDS-PAGE and immunoreacted with the indicated antibodies. (B) FACS analysis of the cellular uptake of LNP harboring Alexa Fluor 647-labeled siRNA. At 2 days after transfection with siRNA, the cells were incubated with 1 nmol/L LNPs harboring Alexa Fluor 647-labeled siRNA for 60 min at 37°C. Then the cells were collected, and the fluorescence intensity was measured using flow cytometry. The percentage of FL4-Hhigh cells was gated (left panel), and the average is indicated on the graph (right panel). Error bars indicate SD of triplicate experiments. (C) Experimental schedule for the administration of miR-634-LNPs. Tumors were formed by subcutaneous injection of BxPC-3 cells in nude mice. miR-NC-LNPs or miR-634-LNPs were administered intravenously a total of four times (at 7, 9, 12, and 14 days after the injection of cells). At 21 days after the injection of cells, the mice were sacrificed, and the tumors were evaluated. (D) Representative images of resected tumors at day 21. Arrows indicate subcutaneous tumors. Scale bars, 1 cm. (E) Tumor volume in mice treated with miR-NC-LNPs or miR-634-LNPs. Tumor volume in mice treated with miR-NC-LNPs (n = 8) or miR-634-LNPs (n = 7) was calculated. Error bars indicate SD. p values; p = 0.025 at Day 14, p = 0.0067 at Day 19, and p = 0.004 at Day 21. (F) Tumor weight in mice treated with miR-NC-LNPs or miR-634-LNPs. Tumor weight in mice treated with miR-NC-LNPs (n = 8) or miR-634-LNPs (n = 7) is shown. Error bars indicate SD.
Figure 3
Figure 3
Enforced Expression of miR-634 and Downregulation of Target Genes in Resected Tumors (A) Expression analysis of miR-634 in resected tumors by qRT-PCR. The expression level of miR-634 in tumors from mice treated with miR-NC-LNPs (n = 5) or miR-634-LNPs (n = 5) was measured by qRT-PCR. Error bars indicate SD. (B) In situ hybridization (ISH) analysis of miR-634 in resected tumors. Representative images of ISH in tumors from mice treated with miR-NC-LNPs or miR-634-LNPs. The miR-634-specific probe was visualized in purple in the cytoplasm, and the nucleus was counterstained with nuclear fast red. Scale bars, 100 μm. (C and D) Immunohistochemistry (IHC) analysis of target genes (C) and Ki-67 (D) in resected tumors. Representative IHC images of tumors from mice treated with miR-NC-LNPs or miR-634-LNPs. The sum density was calculated, and results were normalized according to the values of tumor treated with miR-NC-LNP and indicated as the dot plot. The percentage of Ki-67-positive cells is indicated as a boxplot (right panel). Scale bars: 100 μm (upper panels). p values are shown in two-tailed Student’s t test.
Figure 4
Figure 4
No Hepatotoxicity in Mice Treated with miR-634-LNP (A) Measurement of mouse body weight at 7, 14, and 21 days after the injection of BxPC-3 cells. Error bar, SD from values for miR-NC-LNP (n = 8) or miR-634-LNP (n = 7). (B–D) Liver weight (B), plasma AST levels (C), and plasma ALT levels (D) in mice treated with miR-NC-LNP or miR-634-LNP at 21 days and non-treated mice (NT). Error bar; SD form values for NT (n = 5 in B and n = 2 in C and D), miR-NC-LNP (n = 5 in B and n = 3 in C and D), and miR-634-LNP (n = 5 in B and n = 3 in C and D).

References

    1. Gebert L.F.R., MacRae I.J. Regulation of microRNA function in animals. Nat. Rev. Mol. Cell Biol. 2019;20:21–37. - PMC - PubMed
    1. O’Brien J., Hayder H., Zayed Y., Peng C. Overview of MicroRNA Biogenesis, Mechanisms of Actions, and Circulation. Front. Endocrinol. (Lausanne) 2018;9:402. - PMC - PubMed
    1. Lin S., Gregory R.I. MicroRNA biogenesis pathways in cancer. Nat. Rev. Cancer. 2015;15:321–333. - PMC - PubMed
    1. Peng Y., Croce C.M. The role of MicroRNAs in human cancer. Signal Transduct. Target. Ther. 2016;1:15004. - PMC - PubMed
    1. Rupaimoole R., Slack F.J. MicroRNA therapeutics: towards a new era for the management of cancer and other diseases. Nat. Rev. Drug Discov. 2017;16:203–222. - PubMed

LinkOut - more resources