. 2020 Jan:51:102572.
doi: 10.1016/j.ebiom.2019.11.033. Epub 2019 Dec 23.

Airway epithelial cell differentiation relies on deficient Hedgehog signalling in COPD

Affiliations

Airway epithelial cell differentiation relies on deficient Hedgehog signalling in COPD

Randa Belgacemi et al. EBioMedicine. 2020 Jan.

Abstract

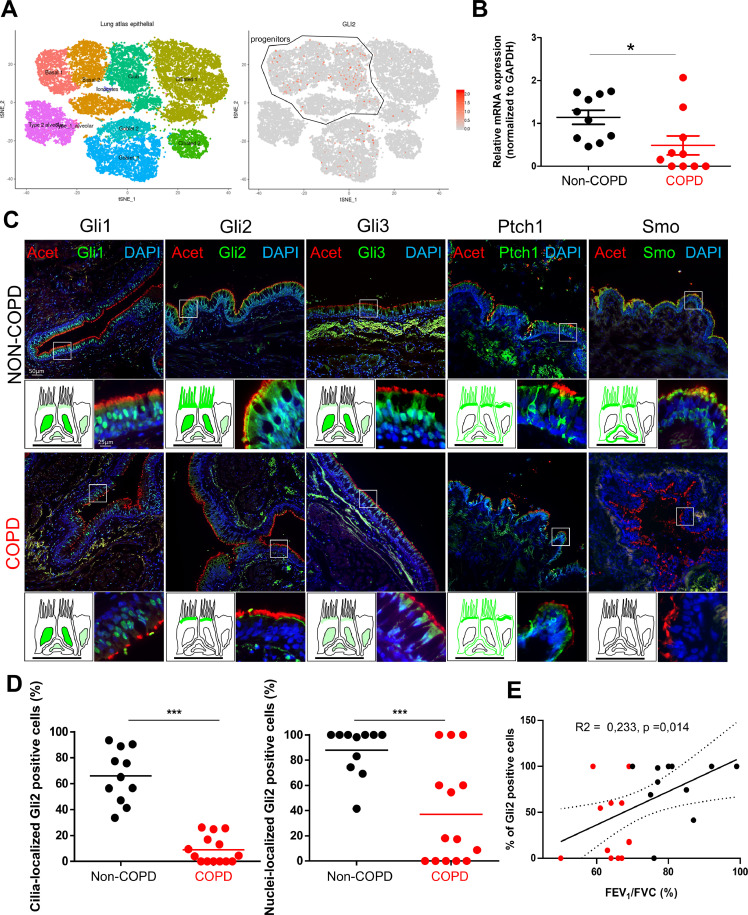
Background: Hedgehog (HH) pathway is constantly under scrutiny in the context of organ development. Lung morphogenesis requires HH signalling which participates thereafter to the pulmonary homeostasis by regulating epithelial cell quiescence and repair. Since epithelial remodelling is a hallmark of Chronic Obstructive Pulmonary Disease (COPD), we investigated whether the main molecular actors of HH pathway participate to airway epithelial cell differentiation and we analysed their alterations in COPD patients.

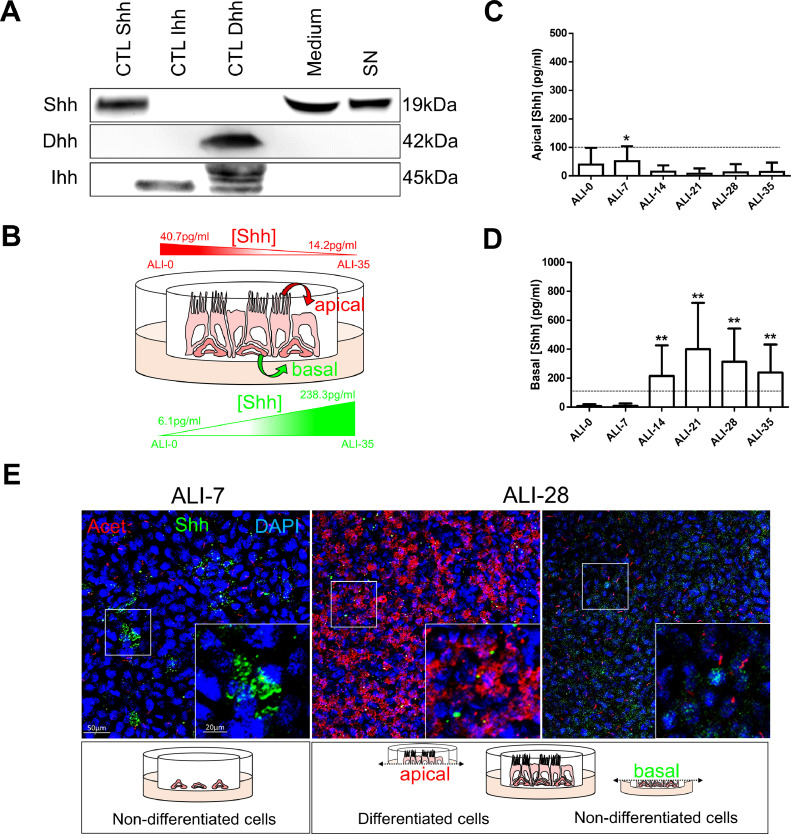
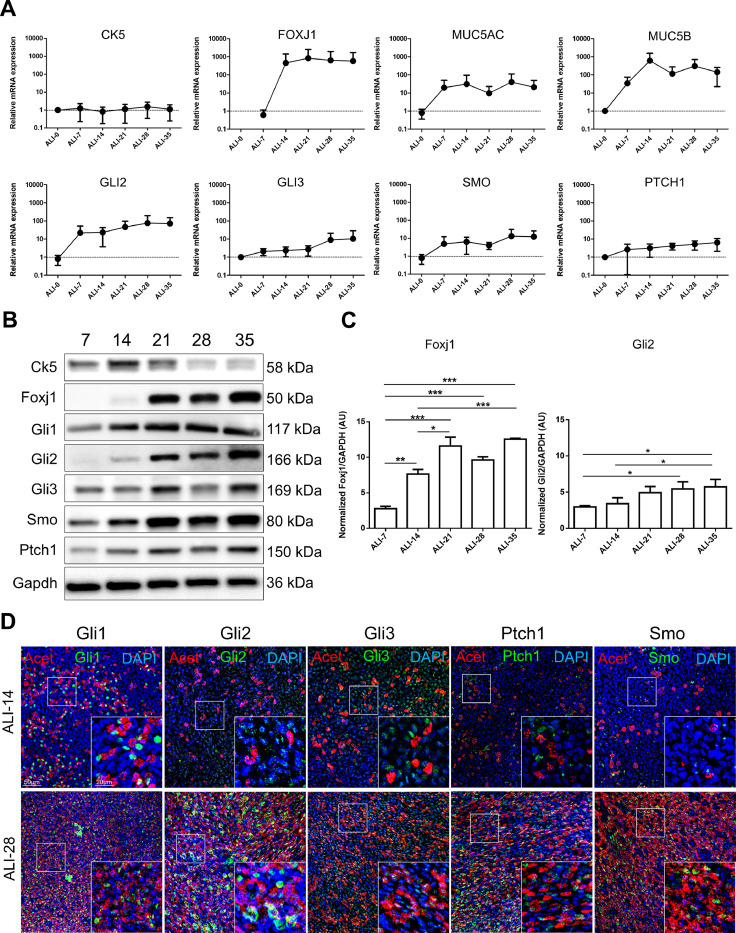
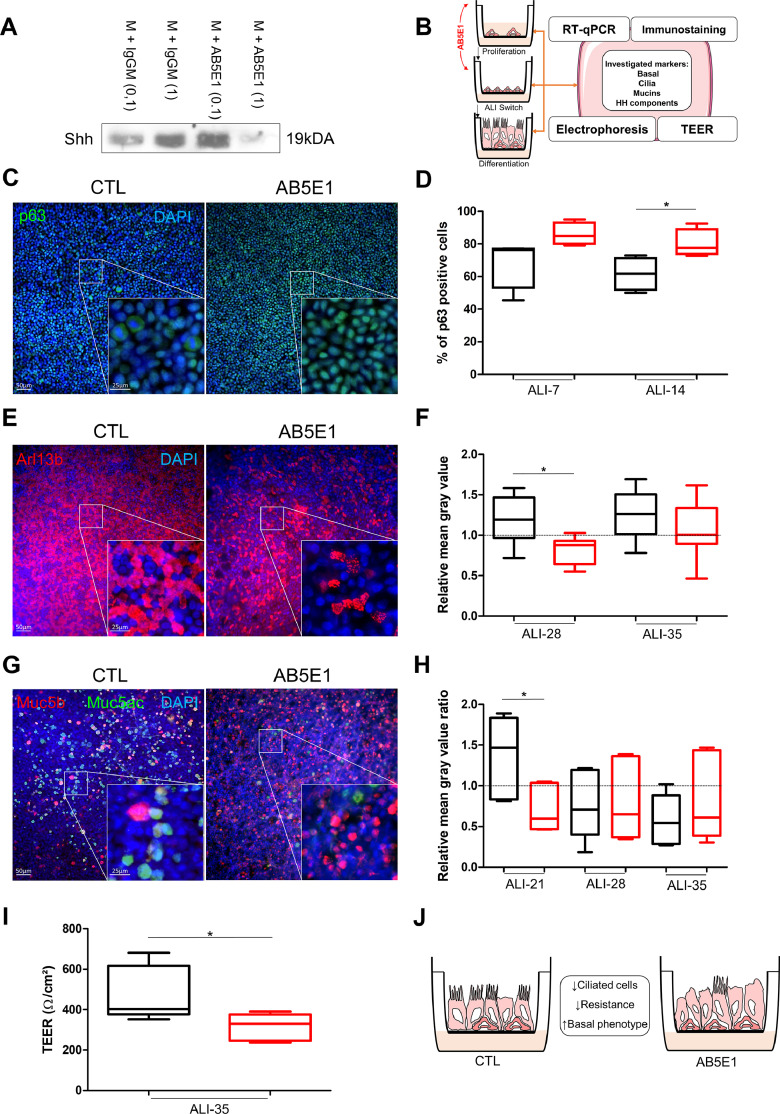
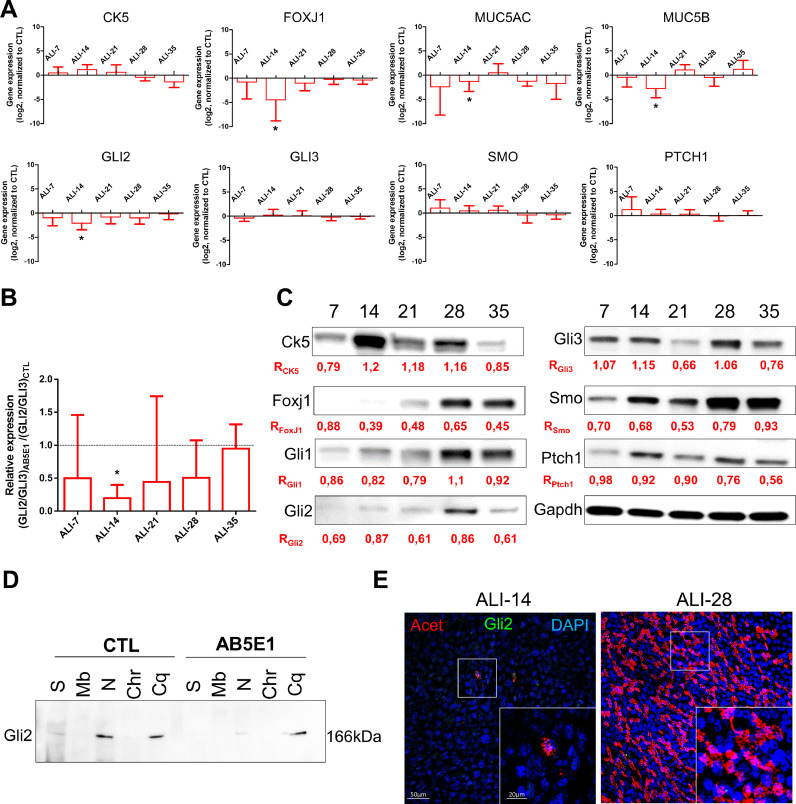
Methods: Sonic HH (Shh) secretion was assessed by ELISA in airway epithelial cell (AEC) air-liquid interface culture supernatants. HH pathway activation was evaluated by RT-qPCR, western blot and immunostaining. Inhibition of HH signalling was achieved upon Shh chelation during epithelial cell differentiation. HH pathway core components localization was investigated in lung tissues from non-COPD and COPD patients.

Findings: We demonstrate that progenitors of AEC produced Shh responsible for the activation of HH signalling during the process of differentiation. Preventing the ligand-induced HH activation led to the establishment of a remodelled epithelium with increased number of basal cells and reduced ciliogenesis. Gli2 activating transcription factor was demonstrated as a key-element in the regulation of AEC differentiation. More importantly, Gli2 and Smo were lost in AEC from COPD patients.

Interpretation: Our data suggest that HH pathway is crucial for airway epithelial cell differentiation and highlight its role in COPD-associated epithelial remodelling.

Keywords: Airway epithelial cells; Chronic obstructive pulmonary disease; Cilia; Differentiation; Hedgehog.


Conflict of interest statement

Declaration of competing interest Dr. Deslee reports personal fees from Nuvaira, personal fees from BTG/PneumRx, personal fees from Chiesi, personal fees from Boehringer, personal fees from Astra Zeneca, outside the submitted work.

Figures

Fig 1
Fig. 1
Shh is produced by AEC. A, Representative immunoblots (n = 3) of Shh, Dhh and Ihh on human bronchi (CTL Shh), murine colon (CTL Ihh) and testis (CTL Dhh), AEC ALI culture medium (Medium), AEC ALI culture supernatants (SN). B, The schematic represents the gradients of Shh on AEC ALI cultures C, Histogram representing the concentration of Shh measured by ELISA in AEC cultures supernatants (n = 11) at the apical side during the process of differentiation (from ALI-0 to ALI-35). Results show mean ±SEM, *p < 0.05 from reference value (8pg/ml). D, Histogram representing the concentration of Shh measured by ELISA in AEC cultures supernatants (n = 11) at the basal side during the process of differentiation (from ALI-0 to ALI-35). Results show mean ±SEM, **p < 0.01 from reference value (8pg/ml). E, Representative confocal acquisitions from AEC cultures at ALI-7 and ALI-28 for Shh (green); cilia (acetylated tubulin, red) and cell nuclei (DAPI, blue). Merged z-projections are shown with a magnification corresponding to the selected area. Cartoons depict the cell differentiation status at the time of analysis. (For interpretation of the references to colour in this figure legend, the reader is referred to the web version of this article.)
Fig 2
Fig. 2
HH pathway is activated during AEC differentiation. A, Curves representing the relative mRNAs levels normalized to GAPDH obtained during the course of ALI cultures by RT-qPCR (n = 5) for differentiation markers (CK5, non-differentiated cells; FOXJ1, ciliated cells; and MUC5AC/MUC5B, mucous-secreting cells) and HH pathway elements (GLI2/3; SMO and PTCH1). Means ±SEM of 2−ΔΔCt are shown for each ALI time point. B, Representative immunoblots of total proteins extracted from ALI AEC cultures from ALI-7 to ALI-35 for the differentiation markers (Ck5 and Foxj1), HH pathway elements (Gli1/2/3; Smo; Ptch1) and Gapdh (n = 3). C, Histograms showing the relative increased expressions of Foxj1 and Gli2 protein levels as evaluated by western blot analysis after processing on ImageJ (Gapdh normalized ratios) during the course of AEC differentiation (in arbitrary units, AU). Results show mean ±SEM, *p < 0.05, **p < 0.01, ***p < 0.001. D, Representative confocal acquisitions from AEC cultures at ALI-14 and ALI-28 for the core HH pathway components Gli1, Gli2, Gli3, Ptch1 and Smo (all green); cilia (acetylated tubulin, red) and cell nuclei (DAPI, blue). Merged z-projections are shown with a magnification corresponding to the selected area.(For interpretation of the references to colour in this figure legend, the reader is referred to the web version of this article.)
Fig 3
Fig. 3
HH pathway inhibition induced AEC remodelling. A, Representative immunoblots from Shh immunoprecipitations in AEC culture medium (n = 3) with control IgGM (0.1 µg/ml and 1 µg/ml) and AB5E1 (0.1 µg/ml and 1 µg/ml). B, Schema depicting AEC cultures in the ALI model and AB5E1 treatment in culture medium to investigate transcript levels, protein levels and localizations, and TEER during the process of differentiation. C, Examples of micrographs taken from AEC cultures at ALI-14 showing basal cells (p63, green). Nuclei are stained in blue (DAPI). D, Box and whiskers plot (median with IQR) represents the percentage of p63+ cells (n = 5) on total cell population (evaluated on DAPI-stained cells count) at ALI-7 and ALI-14 in normal condition (black) and AB5E1-treated cells (red). *p < 0.05 CTL vs AB5E1. E, Examples of micrographs taken from AEC cultures at ALI-28 showing cilia (Arl13b, red). Nuclei are stained in blue (DAPI). F, Box and whiskers plot (median with IQR) represents the relative mean grey values of cilia-associated fluorescence (n = 8) at ALI-28 and ALI-35 (the baseline is given by the average value obtained from ALI-21 in normal condition) in normal condition (black) and AB5E1-treated cells (red). *p < 0.05 CTL vs AB5E1. G, Examples of micrographs taken from AEC cultures at ALI-21 showing mucins (Muc5b, red; Muc5ac, green). Nuclei are stained in blue (DAPI). H, Box and whiskers plot (median with IQR) represents the relative mean grey values of the mucins associated fluorescence ratios Muc5ac/Muc5b (n = 6) at ALI-21, ALI-28 and ALI-35 (the baseline is given by the average value obtained from ALI-14 in normal condition for each mucin) in normal condition (black) and AB5E1-treated cells (red). *p < 0.05 CTL vs AB5E1. I, Box and whiskers plots (median with IQR) represent the TEER of AEC (n = 5) at ALI-35 in control condition (black) or treated with AB5E1 (red). *p < 0.05 CTL vs AB5E1. J, Schema summarizing Shh inhibition impact on cell differentiation. (For interpretation of the references to colour in this figure legend, the reader is referred to the web version of this article.)
Fig 4
Fig. 4
Shh depletion decreased Gli2 expression and prevented its nuclear translocation. A, Histograms representing the assessment of fold-change (log2) in the normalized expression to GAPDH of genes during the course of ALI cultures by RT-qPCR (n = 5) for differentiation markers (CK5, non-differentiated cells; FOXJ1, ciliated cells; and MUC5AC/MUC5B, mucous-secreting cells) and HH pathway elements (GLI2/3; SMO and PTCH1). Results show mean±SEM, *p < 0.05 AB5E1 vs CTL. B, Histogram of the ratios of the transcripts levels of GLI2/GLI3 normalized to GAPDH in AB5E1-treated cells in comparison to CTL (median ±SEM are shown). *p < 0.05 AB5E1-treated cells vs CTL. C, Representative immunoblots of total proteins extracted from ALI AEC cultures treated with AB5E1 from ALI-0 to ALI-35 for the differentiation markers (Ck5 and Foxj1), HH pathway elements (Gli1/2/3; Smo; Ptch1) and Gapdh (n = 3). Ratios (R) indicate the normalized quantitative analysis of the expression of each protein compared to CTL. D, Representative Immunoblot of the fractionated protein extractions on CTL and AB5E1 treated-cells at ALI-7. The fractions are in order: S, soluble proteins; Mb, membrane-bound proteins; N, nuclear proteins; Chr, chromatin-bound proteins; Cq, cytoskeleton-bound proteins. E, Representative confocal acquisitions from AEC cultures AB5E1-treated at ALI-14 and ALI-28 for Gli2 (green), cilia (acetylated tubulin, red) and cell nuclei (DAPI, blue). Merged z-projections are shown with a magnification corresponding to the selected area. (For interpretation of the references to colour in this figure legend, the reader is referred to the web version of this article.)
Fig 5
Fig. 5
Alteration of Gli2 localization in AEC is associated with COPD. A, Data extracted from the Human Lung Atlas. Left, cellular landscape along the airways in human lung analysed by single-cell RNA sequencing from 26154 cells collected from 17 donors to display specific cluster assignment of epithelial cells; right, identification of GLI2-expressing cells by t-distributed Stochastic Neighbour Embedding (tSNE). A progenitor cluster encompassing basal and club-like cells was added. B, Dot plot (mean) presenting the relative mRNAs levels normalized to GAPDH obtained on isolated AEC from bronchial brushings by RT-qPCR (n = 20 non-COPD and COPD patients) for GLI2. Means ±SEM of 2−ΔΔCt; *p < 0.05 non-COPD vs COPD patients. C, Representative micrographs showing the bronchi epithelia of non-COPD and COPD patients stained for the core HH pathway components Gli1, Gli2, Gli3, Ptch1 and Smo (all green); cilia (acetylated tubulin, red) and cell nuclei (DAPI, blue). Magnification corresponding to the selected area is shown. Cartoons depict the localization of each HH pathway element (in green). D, Dot plots (mean) showing the percentages of Gli2 positive cells in cilia (left panel) and nuclei (right panel) in non-COPD (black) and COPD patients (red). *** p < 0.001 non-COPD vs COPD. E, Linear regression of the percentages of nuclear Gli2 positive cells according to the FEV1/FVC (%) for non-COPD (black) and COPD patients (red). (For interpretation of the references to colour in this figure legend, the reader is referred to the web version of this article.)

References

    1. Criner R.N., Han M.K. COPD care in the 21st century: a public health priority. Respir Care. 2018;63:591–600. - PMC - PubMed
    1. Miravitlles M., Roche N., Cardoso J., Halpin D., Aisanov Z., Kankaanranta H. Chronic obstructive pulmonary disease guidelines in Europe: a look into the future. Respir Res. 2018;19:11. - PMC - PubMed
    1. Singh D., Agusti A., Anzueto A., Barnes P.J., Bourbeau J., Celli B.R. Global strategy for the diagnosis, management, and prevention of chronic obstructive lung disease: the gold science committee report 2019. Eur Respirat J. 2019 - PubMed
    1. Hangaard S., Helle T., Nielsen C., Hejlesen O.K. Causes of misdiagnosis of chronic obstructive pulmonary disease: a systematic scoping review. Respir Med. 2017;129:63–84. - PubMed
    1. Stockley J.A., Cooper B.G., Stockley R.A., Sapey E. Small airways disease: time for a revisit? Int J Chron Obstruct Pulmon Dis. 2017;12:2343–2353. - PMC - PubMed

MeSH terms