. 2019 Dec 21;9(1):10.
doi: 10.3390/antiox9010010.

Antagonistic Efficacy of Luteolin against Lead Acetate Exposure-Associated with Hepatotoxicity is Mediated via Antioxidant, Anti-Inflammatory, and Anti-Apoptotic Activities

Affiliations

Antagonistic Efficacy of Luteolin against Lead Acetate Exposure-Associated with Hepatotoxicity is Mediated via Antioxidant, Anti-Inflammatory, and Anti-Apoptotic Activities

Wafa A Al-Megrin et al. Antioxidants (Basel). .

Abstract

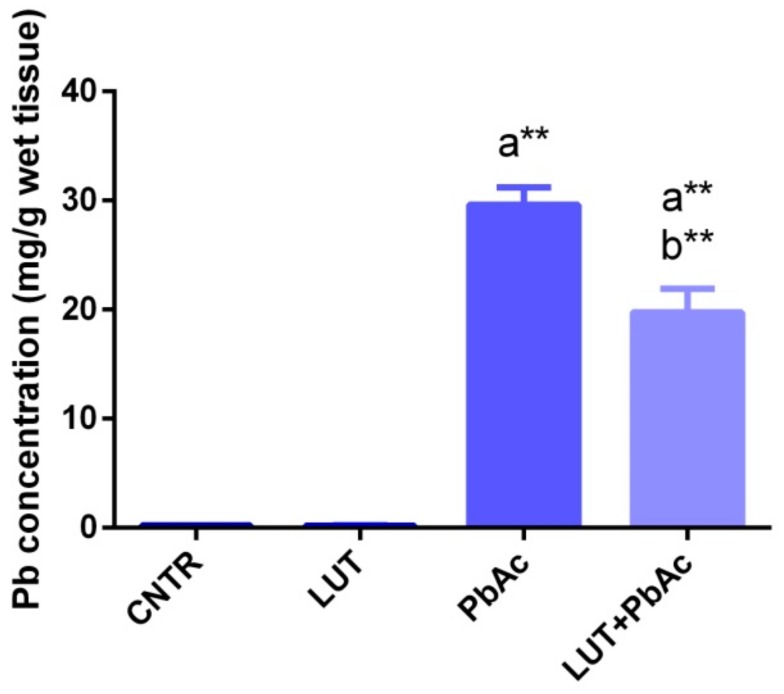
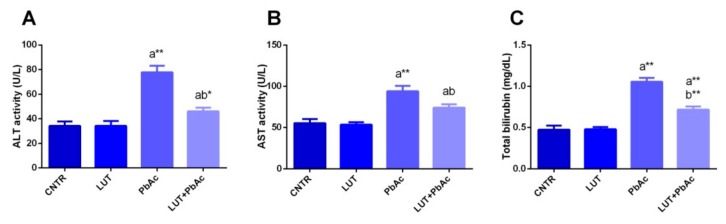
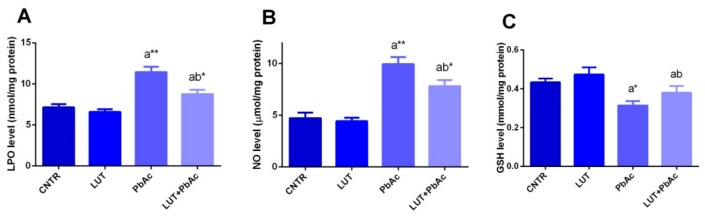
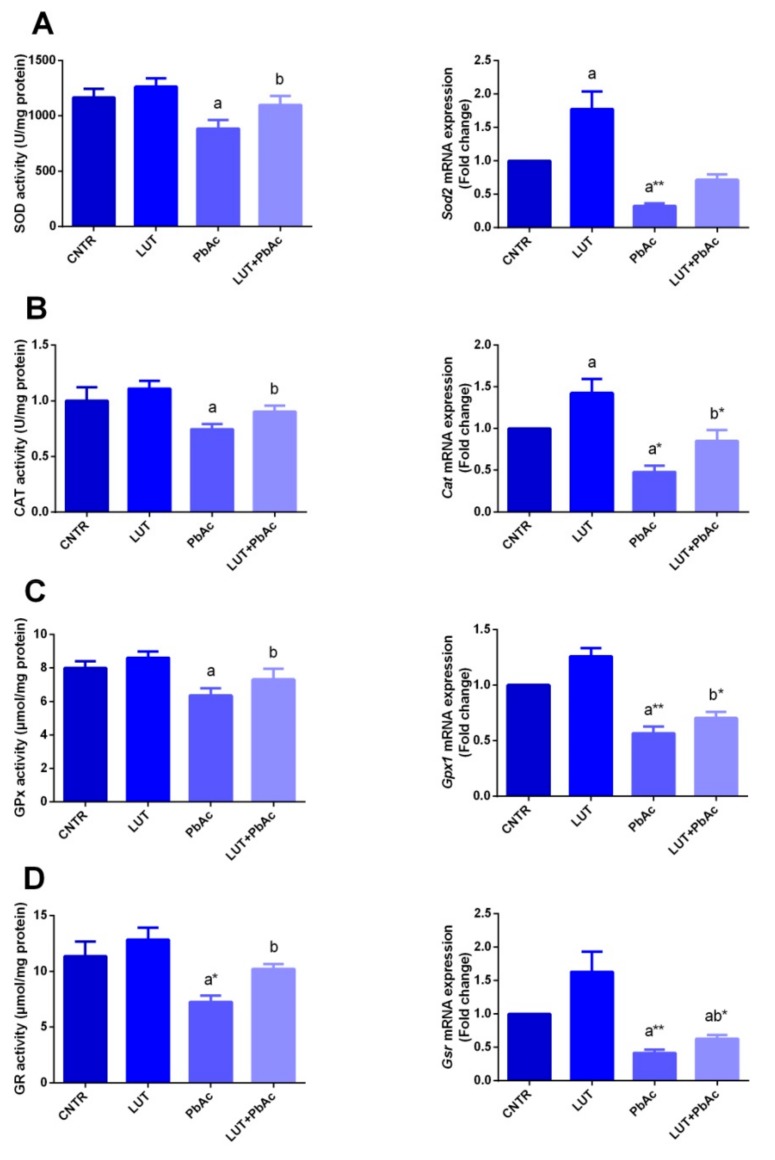
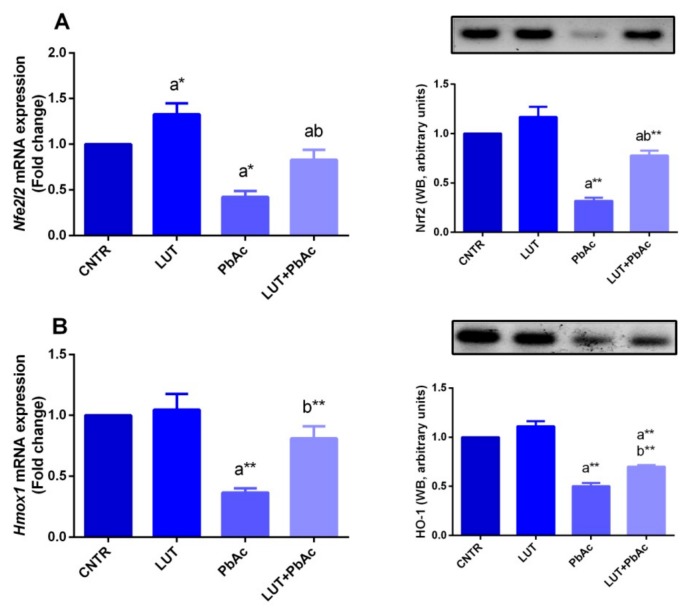
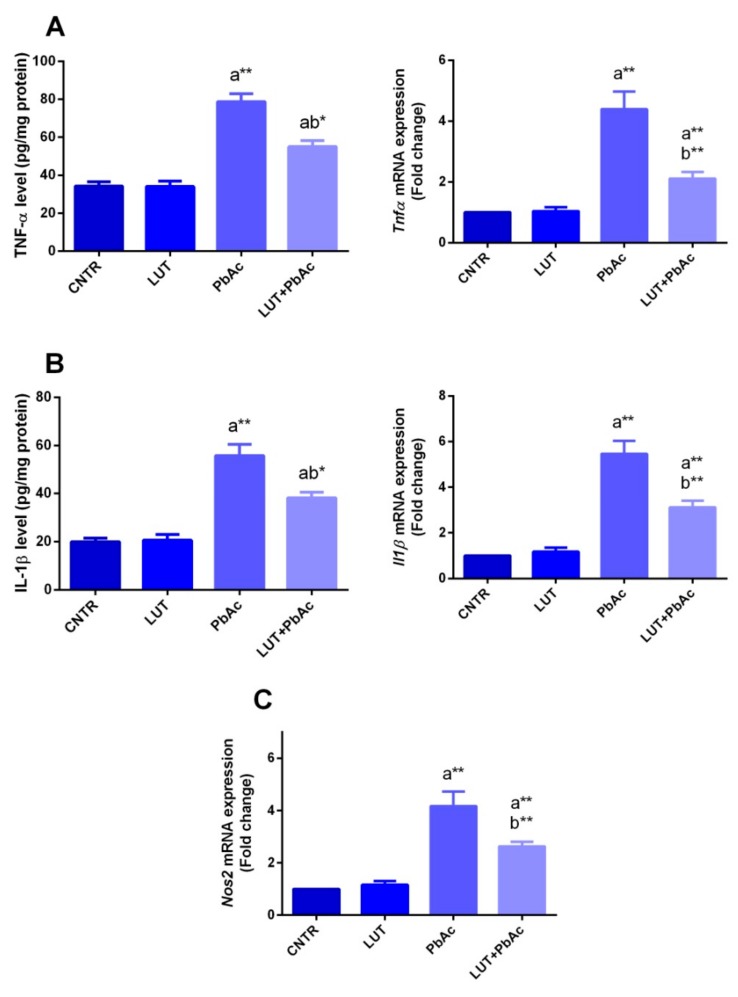
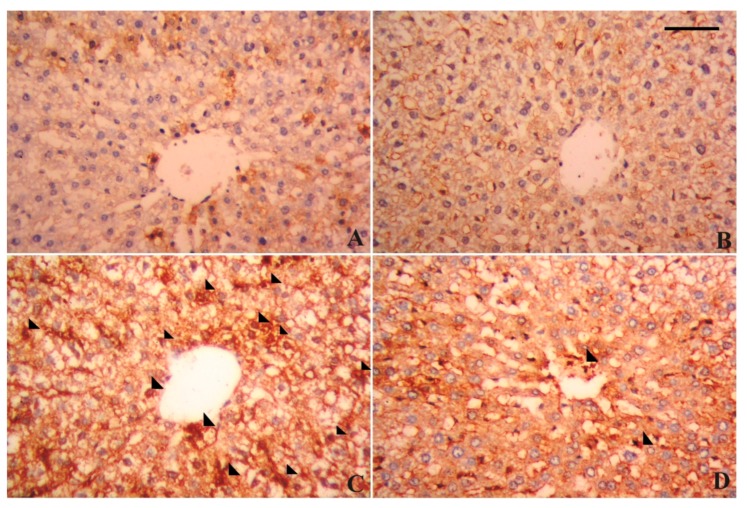
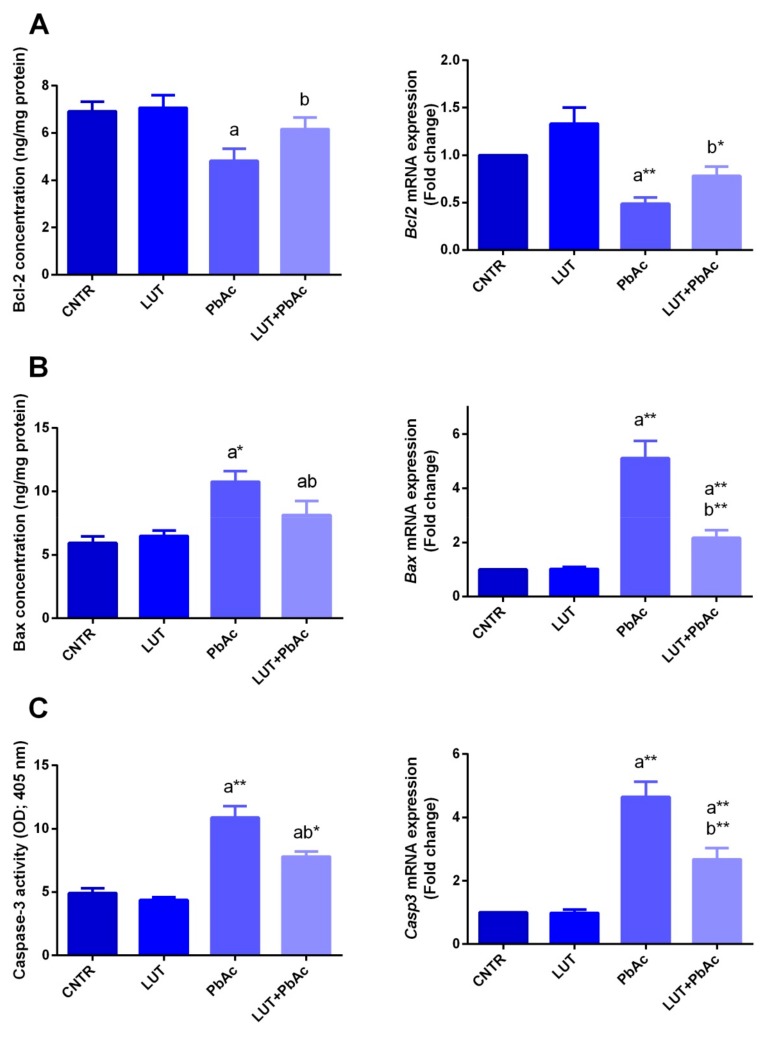
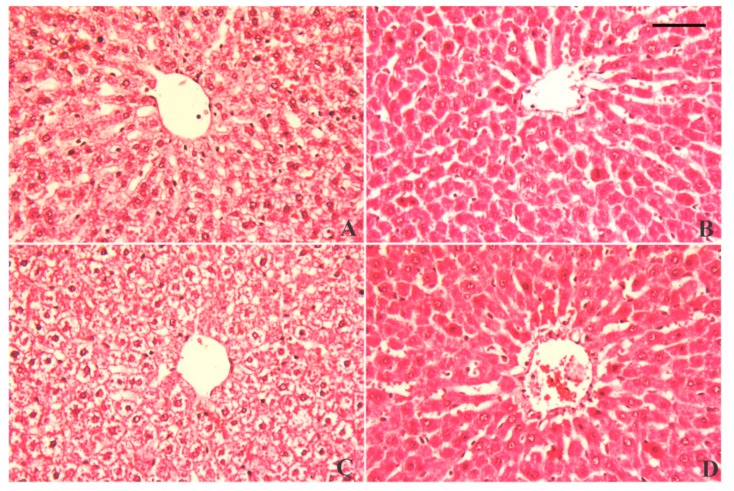
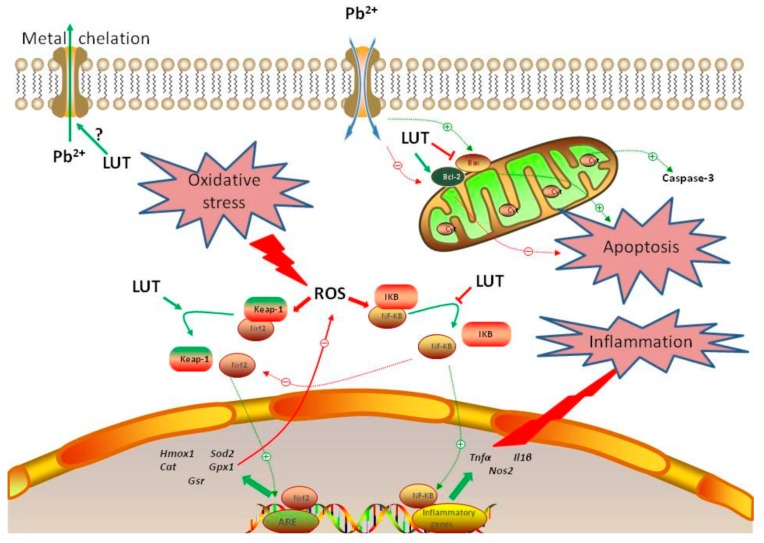
The abundant use of lead (Pb; toxic heavy metal) worldwide has increased occupational and ecosystem exposure, with subsequent negative health effects. The flavonoid luteolin (LUT) found in many natural foodstuffs possesses antioxidant and anti-inflammatory properties. Herein, we hypothesized that LUT could mitigate liver damage induced by exposure to lead acetate (PbAc). Male Wistar rats were allocated to four groups: control group received normal saline, LUT-treated group (50 mg/kg, oral, daily), PbAc-treated group (20 mg/kg, i.p., daily), and LUT+PbAc-treated group (received the aforementioned doses via the respective routes of administration); the rats were treated for 7 days. The results revealed that PbAc exposure significantly increased hepatic Pb residue and serum activities of aspartate aminotransferase (AST), alanine aminotransferase (ALT), and total bilirubin value. Oxidative reactions were observed in the liver tissue following PbAc intoxication, characterized by the depletion and downregulation of antioxidant proteins (glutathione, glutathione reductase, glutathione peroxidase, superoxide dismutase, catalase, nuclear factor erythroid 2-related factor 2, and heme oxygenase-1), and an increase in oxidants (malondialdehyde and nitric oxide). Additionally, PbAc increased the release and expression of the pro-inflammatory cytokines (tumor necrosis factor alpha and interleukin-1 beta), inducible nitric oxide synthase, and nuclear factor kappa B. Moreover, PbAc enhanced hepatocyte loss by increasing the expression of pro-apoptotic proteins (Bax and caspase-3) and downregulating the anti-apoptotic protein (Bcl-2). The changes in the aforementioned parameters were further confirmed by noticeable histopathological lesions. LUT supplementation significantly reversed all of the tested parameters in comparison with the PbAc-exposed group. In conclusion, our findings describe the potential mechanisms involved in the alleviation of PbAc-induced liver injury by luteolin via its potent anti-inflammatory, antioxidant, and anti-apoptotic properties.

Keywords: apoptosis; inflammation; lead acetate; liver; luteolin; oxidative stress.


Conflict of interest statement

The authors declare no conflict of interest.

Figures

Figure 1
Figure 1
Lead (Pb) residual levels in hepatic tissue following lead acetate (PbAc, 20 mg/kg, i.p.) and/or luteolin (LUT, 50 mg/kg, orally) exposure in male rats. The values represent the means ± SD (n = 7). a represents the statistical significance relative to that of the control group at p < 0.05. b represents the statistical significance relative to that of the PbAc-injected group at p < 0.05. ** reflects the statistical significant differences between groups at p-values < 0.001.
Figure 2
Figure 2
Aspartate aminotransferase (AST) (A), alanine aminotransferase (ALT) (B), and total bilirubin (C) levels following lead acetate (PbAc, 20 mg/kg, i.p.) and/or luteolin (LUT, 50 mg/kg, orally) exposure in male rats. The values are the means ± SD (n = 7). a represents the statistical significance relative to that of the control group at p < 0.05. b represents the statistical significance relative to that of the PbAc-injected group at p < 0.05. * reflects the statistical significant differences between groups at p-values < 0.01. Moreover, ** reflects the statistical significant differences between groups at p-values < 0.001.
Figure 3
Figure 3
Hepatic levels of lipid peroxidation (LPO; A), nitric oxide (NO; B), and glutathione (GSH; C) following lead acetate (PbAc, 20 mg/kg, i.p.) and/or luteolin (LUT, 50 mg/kg, orally) exposure in male rats. The values are the means ± SD (n = 7). a represents the statistical significance relative to that of the control group at p < 0.05. b represents the statistical significance relative to that of the PbAc-injected group at p < 0.05. * reflects the statistical significant differences between groups at p-values < 0.01. Moreover, ** reflects the statistical significant differences between groups at p-values < 0.001.
Figure 4
Figure 4
Effects of luteolin (LUT, 50 mg/kg, orally) on the activity of superoxide dismutase (SOD; A), and catalase (CAT; B), glutathione peroxidase (GPx; C), and glutathione reductase (GR; D), and their mRNA expression in the liver tissue following lead acetate (PbAc, 20 mg/kg, i.p.). The biochemical data are expressed as the mean ± SD (n = 7). mRNA expression results are recorded as the mean ± SD of five assays in duplicate referenced to Gapdh and represented as fold changes (log2 scale) as compared with the mRNA levels of the control group. a represents the statistical significance relative to that of the control group at p < 0.05. b represents the statistical significance relative to that of the PbAc-injected group at p < 0.05. * reflects the statistical significant differences between groups at p-values < 0.01. Moreover, ** reflects the statistical significant differences between groups at p-values < 0.001.
Figure 5
Figure 5
Hepatic protein and mRNA gene expression levels of Nrf2 (A) and HO-1 (B) following lead acetate (PbAc, 20 mg/kg, i.p.) and/or luteolin (LUT, 50 mg/kg, orally) exposure in male rats. Results of mRNA are recorded as the mean ± SD of five assays in duplicate and Gapdh was the housekeeping gene, whereas β-actin was used as the reference control for western blot analysis. a represents the statistical significance relative to that of the control group at p < 0.05. b represents the statistical significance relative to that of the PbAc-injected group at p < 0.05. * reflects the statistical significant differences between groups at p-values < 0.01. Moreover, ** reflects the statistical significant differences between groups at p-values < 0.001.
Figure 6
Figure 6
Hepatic levels of TNF-α (A) and IL-1β (B) and Nos2 (C) mRNA expression following lead acetate (PbAc, 20 mg/kg, i.p.) and/or luteolin (LUT, 50 mg/kg, orally) exposure in male rats. The biochemical data are expressed as the mean ± SD (n = 7). mRNA expression results are recorded as the mean ± SD of five assays in duplicate referenced to Gapdh and represented as fold changes (log2 scale) as compared with the mRNA levels of the control group. a represents the statistical significance relative to that of the control group at p < 0.05. b represents the statistical significance relative to that of the PbAc-injected group at p < 0.05. * reflects the statistical significant differences between groups at p-values < 0.01. Moreover, ** reflects the statistical significant differences between groups at p-values < 0.001.
Figure 7
Figure 7
Photomicrographs showing alterations in the hepatic nuclear factor kappa B (NF-κB) expression following lead acetate (PbAc, 20 mg/kg, i.p.) and/or luteolin (LUT, 50 mg/kg, orally) exposure in male rats. (A) Control group; (B) LUT administered group; (C) PbAc treated group; (D) LUT+PbAc-treated group; scale bar 80 um.
Figure 8
Figure 8
Apoptotic-related proteins (Bcl-2; A, Bax; B and caspases-3; C) level and expression following lead acetate (PbAc, 20 mg/kg, i.p.) and/or luteolin (LUT, 50 mg/kg, orally) exposure in male rats. Bcl-2, Bax and caspases-3 protein levels are expressed as the mean ± SD (n = 7). mRNA expression results are recorded as the mean ± SD of five assays in duplicate referenced to Gapdh and represented as fold changes (log2 scale) as compared with the mRNA levels of the control group. a represents the statistical significance relative to that of the control group at p < 0.05. b represents the statistical significance relative to that of the PbAc-injected group at p < 0.05. * reflects the statistical significant differences between groups at p-values < 0.01. Moreover, ** reflects the statistical significant differences between groups at p-values < 0.001.
Figure 9
Figure 9
Histopathological alterations of liver tissue following lead acetate (PbAc, 20 mg/kg, i.p.) and/or luteolin (LUT, 50 mg/kg, orally) exposure in male rats. Normal hepatic histological architecture was observed in the control and LUT groups, characterized by normal central veins surrounded by normal, intact hepatocytes (A and B, respectively). In contrast, PbAc-intoxicated rats exhibited necrotic liver cells associated with considerably degenerated and vacuolated peripheral hepatocytes, along with neutrophil and lymphocyte infiltrations around the peri-portal areas (C). However, pretreatment with LUT reversed the histological changes in response to PbAc intoxication (D). Scale bar 80 um.
Figure 10
Figure 10
Summary suggesting the mechanisms of LUT attenuated hepatotoxicity induced by PbAc. Pb2+ enhanced ROS formation in cytoplasm inducing oxidative stress, finally led to apoptosis and inflammation. However, LUT promoted the Nrf2/ARE pathway and triggered the activation of NF-κB/cell death signaling pathways and prevented liver injury induced by Pb2+. Green line denotes stimulatory and red line denotes inhibitory effect.

References

    1. Bischoff K., Mukai M., Ramaiah S.K. Veterinary Toxicology. Academic Press Elsevier; Amsterdam, The Netherlands: 2018. Liver toxicity; pp. 239–257.
    1. Wu X., Cobbina S.J., Mao G., Xu H., Zhang Z., Yang L. A review of toxicity and mechanisms of individual and mixtures of heavy metals in the environment. Environ. Sci. Pollut. Res. 2016;23:8244–8259. doi: 10.1007/s11356-016-6333-x. - DOI - PubMed
    1. Obeng-Gyasi E. Sources of lead exposure in various countries. Rev. Environ. Health. 2019;34:25–34. doi: 10.1515/reveh-2018-0037. - DOI - PubMed
    1. Mudipalli A. Lead hepatotoxicity & potential health effects. Indian J. Med Res. 2007;126:518. - PubMed
    1. Assi M.A., Hezmee M.N.M., Haron A.W., Sabri M.Y.M., Rajion M.A. The detrimental effects of lead on human and animal health. Vet. World. 2016;9:660. doi: 10.14202/vetworld.2016.660-671. - DOI - PMC - PubMed