. 2019 Dec 24;11(1):18.
doi: 10.3390/insects11010018.

Changes in Energy Reserves and Gene Expression Elicited by Freezing and Supercooling in the Antarctic Midge, Belgica antarctica

Affiliations

Changes in Energy Reserves and Gene Expression Elicited by Freezing and Supercooling in the Antarctic Midge, Belgica antarctica

Nicholas M Teets et al. Insects. .

Abstract

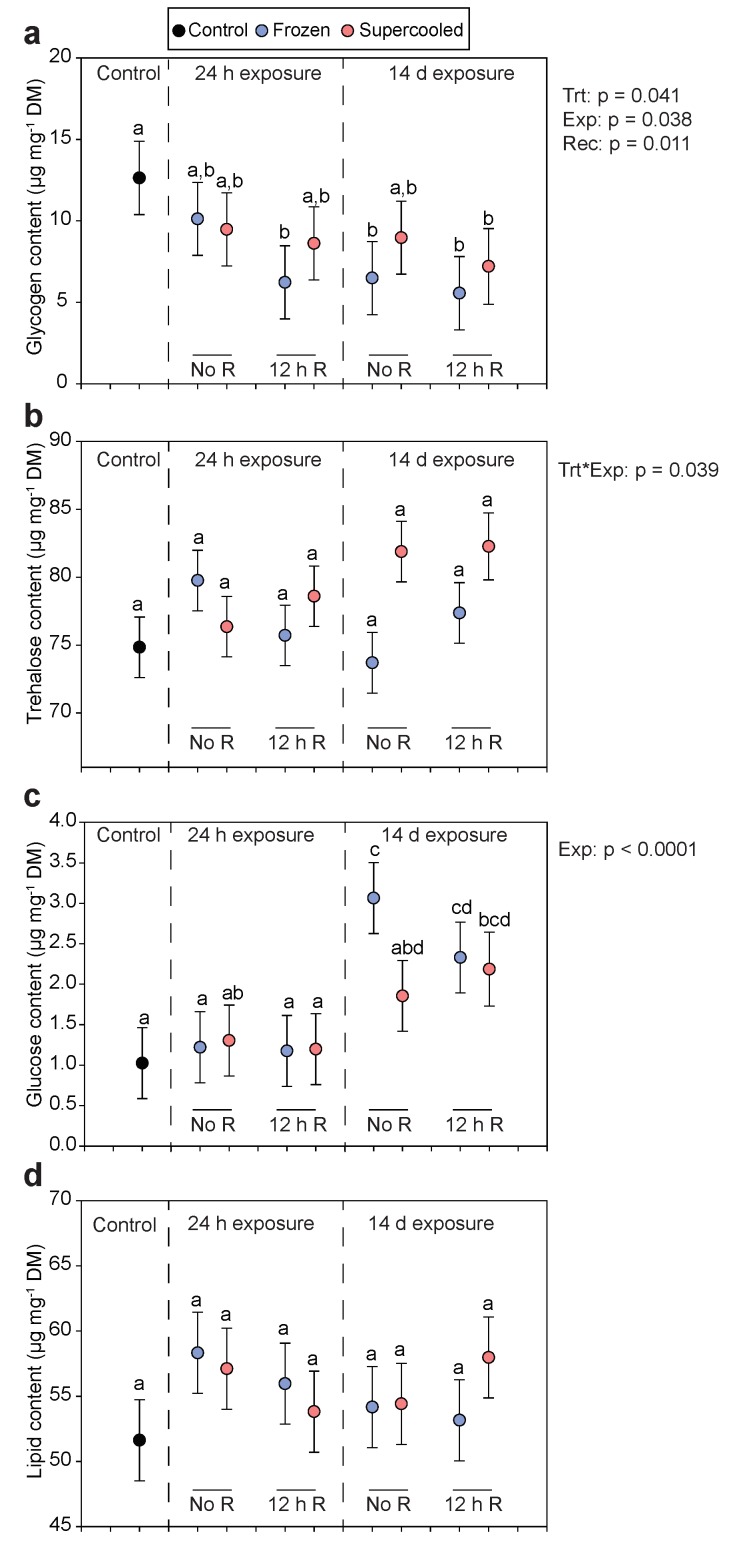
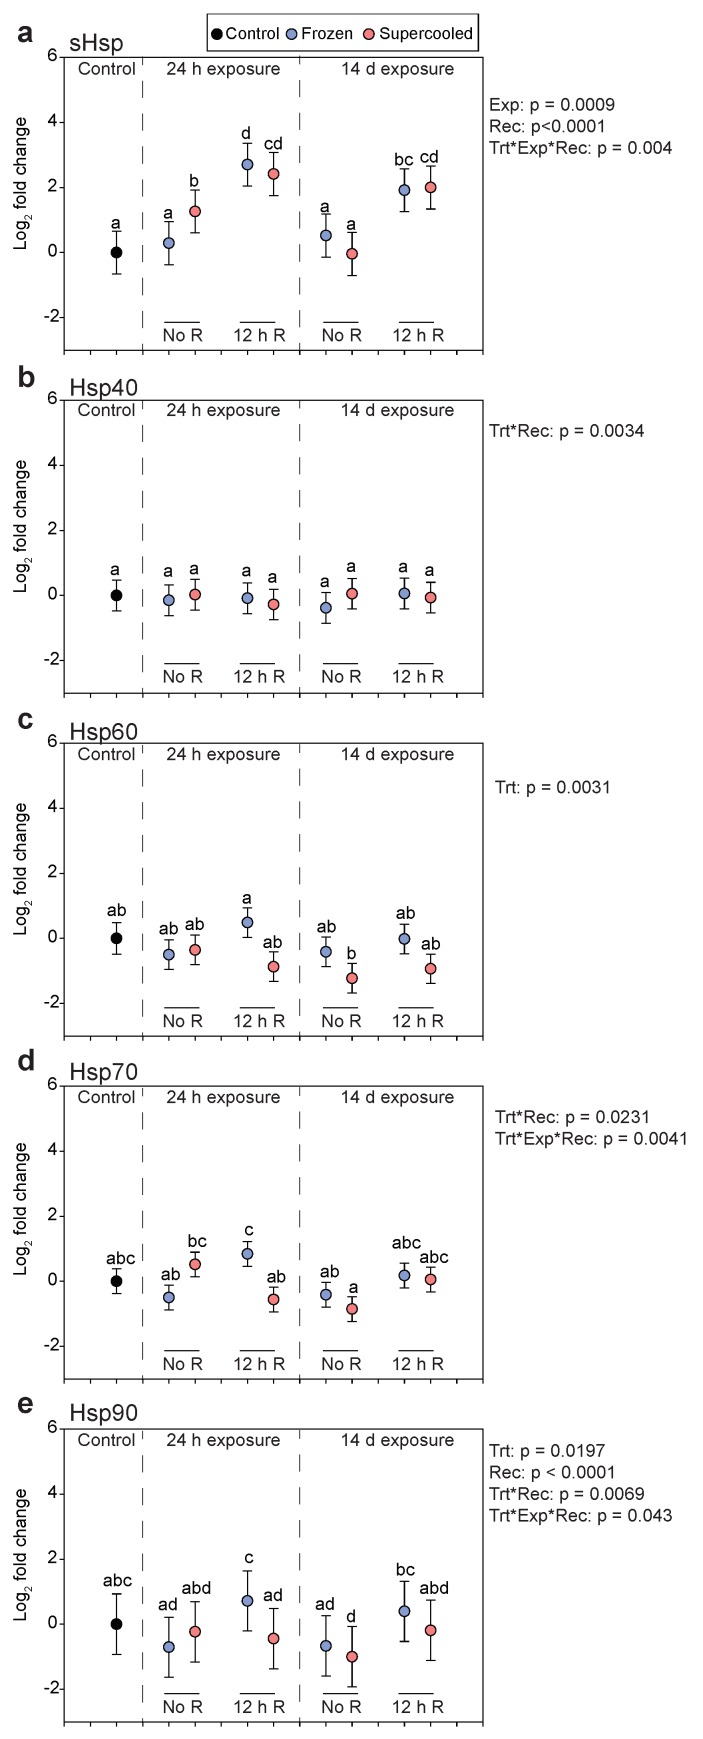
Freeze-tolerance, or the ability to survive internal ice formation, is relatively rare among insects. Larvae of the Antarctic midge Belgica antarctica are freeze-tolerant year-round, but in dry environments, the larvae can remain supercooled (i.e., unfrozen) at subzero temperatures. In previous work with summer-acclimatized larvae, we showed that freezing is considerably more stressful than remaining supercooled. Here, these findings are extended by comparing survival, tissue damage, energetic costs, and stress gene expression in larvae that have undergone an artificial winter acclimation regime and are either frozen or supercooled at -5 °C. In contrast to summer larvae, winter larvae survive at -5 °C equally well for up to 14 days, whether frozen or supercooled, and there is no tissue damage at these conditions. In subsequent experiments, we measured energy stores and stress gene expression following cold exposure at -5 °C for either 24 h or 14 days, with and without a 12 h recovery period. We observed slight energetic costs to freezing, as frozen larvae tended to have lower glycogen stores across all groups. In addition, the abundance of two heat shock protein transcripts, hsp60 and hsp90, tended to be higher in frozen larvae, indicating higher levels of protein damage following freezing. Together, these results indicate a slight cost to being frozen relative to remaining supercooled, which may have implications for the selection of hibernacula and responses to climate change.

Keywords: Antarctica; Belgica antarctica; energy stores; freeze-tolerance; heat shock proteins.


Conflict of interest statement

The authors declare no conflict of interest. The funders had no role in the design of the study; in the collection, analyses, or interpretation of the data; in the writing of the manuscript or in the decision to publish the results.

Figures

Figure 1
Figure 1
Winter-acclimated larvae survive freezing and supercooling at −5 °C equally well. (a) Survival of frozen and supercooled larvae following cold exposure at −5 °C for the indicated time periods. (b) Midgut and (c) fat body cell survival following freezing and supercooling at −5 °C for 24 h or 14 days. In all panels, symbols represent mean ± s.e.m., N = 3 for a, N = 5 for b and c. In b and c, different letters indicate statistically significant differences between groups (GLM, planned contrast with Tukey correction, p < 0.05).
Figure 2
Figure 2
Levels of energy reserves after freezing and supercooling at −5 °C. (a) Glycogen, (b) trehalose, (c) glucose, and (d) lipid content of larvae following freezing (blue) or supercooling (red) for either 24 h or 14 days. Larvae were sampled either immediately after treatment (No R) or after 12 h recovery at 4 °C (12 h R). Symbols represent fitted values ± s.e.m. from a linear model fitting metabolite content as a function of the group, with the analytical block as a random effect. For each group, N = 5. Different letters indicate significant a difference based on pairwise comparisons of all groups (Linear Model, planned contrasts with FDR correction, p < 0.05). The p-values to the right of each panel indicate the significant effects from a full factorial model fitting metabolite content as a function of treatment (frozen or supercooled), exposure time (24 h or 14 days), recovery time (0 or 12 h), and their interactions as fixed effects with analytical block as a random effect. For this model, the control group was omitted so that we could have a full factorial model to isolate effects across groups. In the y-axis label, DM = dry mass.
Figure 3
Figure 3
Transcript abundance of heat shock proteins after freezing and supercooling at −5 °C. (a) sHsp, (b) hsp40, (c) hsp60, (d) hsp70, and (e) hsp90 transcript levels following freezing (blue) or supercooling (red) for either 24 h or 14 days. Larvae were sampled either immediately after treatment (No R) or after 12 h recovery at 4 °C (12 h R). Symbols represent fitted values ± s.e.m. from a linear model fitting ΔCt as a function of the group, with analytical block as a random effect. For each group, N = 5. Different letters indicate significant differences based on pairwise comparisons of all groups (Linear Model, planned contrasts with FDR correction, p < 0.05). The p-values to the right of each panel indicate the significant effects from a full factorial model fitting ΔCt as a function of treatment (frozen or supercooled), exposure time (24 h or 14 days), recovery time (0 or 12 h), and their interactions as fixed effects with analytical block as a random effect. For this model, the control group was omitted, thus that we could have a full factorial model to isolate effects across groups.

References

    1. Overgaard J., MacMillan H.A. The integrative physiology of insect chill tolerance. Annu. Rev. Physiol. 2017;79:187–208. doi: 10.1146/annurev-physiol-022516-034142. - DOI - PubMed
    1. Lee R.E. Insect cold-hardiness—To freeze or not to freeze—How insects survive low temperatures. Bioscience. 1989;39:308–313. doi: 10.2307/1311113. - DOI
    1. Lee R.E. A primer on insect cold tolerance. In: Denlinger D.L., Lee R.E., editors. Low Temperature Biology of Insects. Cambridge University Press; Cambridge, UK: 2010. pp. 3–34.
    1. Sinclair B.J., Alvarado L.E.C., Ferguson L.V. An invitation to measure insect cold tolerance: Methods, approaches, and workflow. J. Therm. Biol. 2015;53:180–197. doi: 10.1016/j.jtherbio.2015.11.003. - DOI - PubMed
    1. Toxopeus J., Sinclair B.J. Mechanisms underlying insect freeze tolerance. Biol. Rev. 2018;93:1891–1914. doi: 10.1111/brv.12425. - DOI - PubMed