. 2019 Dec 24;21(1):138.
doi: 10.3390/ijms21010138.

AtKATANIN1 Modulates Microtubule Depolymerization and Reorganization in Response to Salt Stress in Arabidopsis

Affiliations

AtKATANIN1 Modulates Microtubule Depolymerization and Reorganization in Response to Salt Stress in Arabidopsis

Jie Yang et al. Int J Mol Sci. .

Abstract

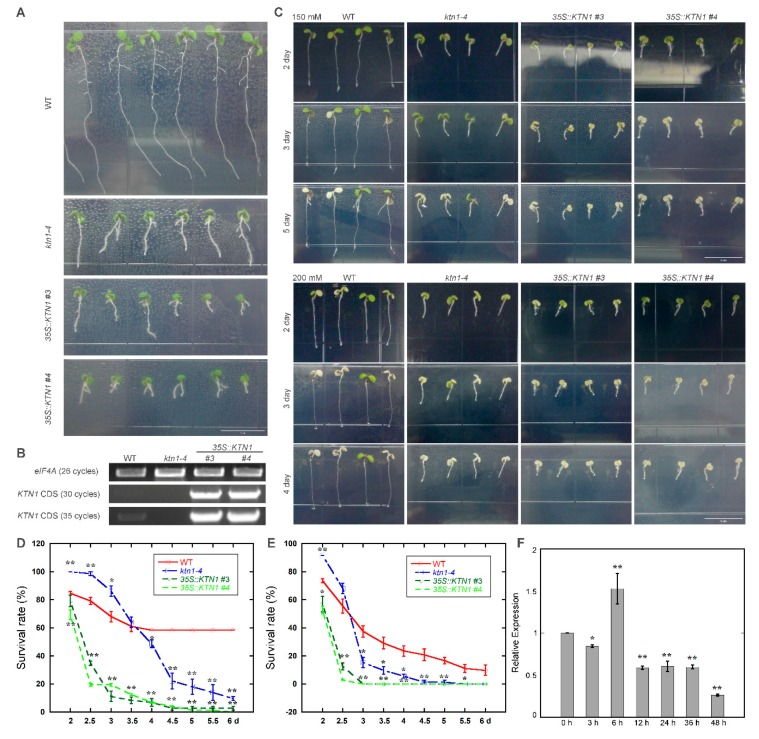
The microtubule cytoskeleton is a dynamic system that plays vital roles in fundamental cellular processes and in responses to environmental stumili. Salt stress induced depolymerization and reorganization of microtubules are believed to function in the promotion of survival in Arabidopsis. Microtubule-severing enzyme ATKATANIN1 (AtKTN1) is recognized as a MAP that help to maintain organized microtubule structure. To date, whether AtKTN1 is involved in response to salt stress in Arabidopsis remains unknown. Here, our phenotypic analysis showed that the overexpression of AtKTN1 decreased tolerance to salt stress, whereas the knock-out of AtKTN1 increased salt tolerance in the early stage but decreased salt tolerance in the later stage. Microscopic analysis revealed that microtubule organization and dynamics are distorted in both overexpression and mutant cells which, in turn, resulted in an abnormal disassembly and reorganization under salt stress. Moreover, qRT analysis revealed that stress-responsive genes were down-regulated in overexpression and mutant cells compared to WT cells under salt stress. Taken together, our results indicated roles of AtKTN1 in modulating microtubule organization, salt-stress induced microtubule disruption and recovery, and its involvement in stress-related signaling pathways.

Keywords: Arabidopsis; KATANIN1; dynamics; microtubule; organization; salt stress.


Conflict of interest statement

The authors declare no conflict of interest.

Figures

Figure 1
Figure 1
Knock-out of AtKTN1 improves salt tolerance in the early stage of salt treatment but reduces in the later stage. Overexpression of AtKTN1 decreases salt tolerance significantly. (A) Seven-day-old Arabidopsis seedlings WT (Col-0), ktn1-4 and 35S::KTN1 (#3, #4) grown under lights. Scale bar = 1 cm. (B) RT-PCR analysis of the transcriptional levels of KTN1 in WT (Col-0), ktn1-4 and 35S::KTN1 (#3, #4) seven-day seedlings. eIF4A was used as the control gene. (C) Salt sensitivity of WT (Col-0), ktn1-4 and 35S::KTN1 (#3, #4) seedlings under 150 mM and 200 mM NaCl. Seedlings (four-day-old) of wild type and mutants were transferred from 1/2 MS medium to 1/2 MS medium supplemented without or with 150 mM and 200 mM NaCl. Scale bar = 1 cm. (D) Survival rates of WT (Col-0), ktn1-4 and 35S::KTN1 (#3, #4) seedlings under 150 mM NaCl. (E) Survival rates of WT (Col-0), ktn1-4 and 35S::KTN1 (#3, #4) seedlings under 200 mM NaCl. Surviving seedlings (with green cotyledons) were counted from the second day after transfer. Data shown are mean values SE (error bars) from three independent experiments (n = 48 for each). Asterisks indicate the significance of the mean value differences compared with WT by Student’s t-test, * P < 0.05,** P < 0.01. (F) Relative expression levels of AtKTN1 after treatment with 200 mM NaCl for indicated time period in WT seedlings (four-day-old). Error bars indicate SD. * P < 0.05 and ** P < 0.01 by a Student’s t test.
Figure 2
Figure 2
Cortical microtubule organization in cotyledon pavement cells of WT (Col-0), ktn1-4 and 35S::KTN1 expressing GFP-TUA6. (A) Micrograph of microtubules in Arabidopsis cotyledon pavement cells of 4-d-old seedlings. Images of microtubules were acquired under the same settings. Scale bar = 10 μm. (B) Average fluorescence intensity of microtubules in the WT (Col-0), ktn1-4 and 35S::KTN1, analyzed by MBF-ImageJ software. More than 26 cells from four different seedlings were measured in each experiment. Values represent mean ± SE. ** P < 0.01 by a Student’s t test. (C) Histograms of microtubule length distribution were shown in WT (Col-0), ktn1-4 and 35S::KTN1 cotyledon pavement cells. More than 400 microtubules in at least 14 cells from four seedlings were measured of each genotype were counted.
Figure 3
Figure 3
AtKTN1 modulates cortical microtubule disruption and reassembly in cotyledon pavement cells during the early stage of salt stress (0 h–42 h). (A) Sequential images of cortical microtubule alterations induced by 200 mM NaCl in four-day-old WT (Col-0), ktn1-4 and 35S::KTN1 seedlings expressing GFP-TUA6 for the indicated time. Bar = 10 μm. (B) Quantification of cortical microtubule density in cotyledon pavement cells of WT (Col-0), ktn1-4 and 35S::KTN1. The data shown in (A) were quantified by MBF imageJ software. N ≥ 22 cells. Error bars indicate SE. ** P < 0.01 by a Student’s t test.
Figure 4
Figure 4
AtKTN1 regulates cortical microtubule organization in cotyledon pavement cells during the late stage of salt treatment (60–84 h). (A) Micrograph of different patterns of microtubule organization in cotyledon pavement cells during late stage of salt stress. Four-day-old seedlings of GFP-TUA6 labeled WT (Col-0), ktn1-4 and 35S::KTN1 were transferred onto 1/2 MS medium supplemented with 200 mM NaCl. Different representative patterns were indicated with long filaments, fragments, spots, or nothing. Scale bar = 10 μm. (B) Quantification of the patterns of cortical microtubules arrays in (A) at indicated time. More than 11 seedlings for each line were observed at each indicated time.
Figure 5
Figure 5
Time-lapse imaging of microtubules revealed abnormal severing frequencies in both ktn1-4 and 35S::KTN1 cotyledon pavement cells. (A) Time-lapse images showing microtubule severing events in WT (Col-0), ktn1-4 and 35S::KTN1 cells. The images presented is an optical section. A filament highlighted with colored dots underwent severing, and the corresponding colored scissors indicate the severing events. Different colors (red, blue, green and yellow) indicated different filaments. See Supplemental Movie 1-3 online for the entire series. Scale bar = 5 μm. (B) Quantitative comparison of severing frequencies in microtubules of WT (Col-0), ktn1-4 and 35S::KTN1 cells (n = 6 cells for each genotype). Error bars indicate SE. ** P < 0.01 by a Student’s t test. (C) Quantification of the proportions of severing events (severed at branched sites, microtubule crossovers or at free microtubules) of cortical microtubules in WT (Col-0), ktn1-4 and 35S::KTN1 cells.
Figure 6
Figure 6
Dynamic parameters of single microtubules in cotyledon pavement cells. Quantification of microtubule growth rates (A), shrinkage rates (B), rescue frequencies (C) and catastrophe frequencies (D) in WT (Col-0), ktn1-4 and 35S::KTN1 cells. More than 38 microtubules for each type of cells were selected to measure parameters associated with single microtubule dynamics. Error bars indicate SE. * P < 0.05 and ** P < 0.01 by a Student’s t test.
Figure 7
Figure 7
The effects of salt treatment on the transcript levels of stress-responsive genes in Arabidopsis. For salt treatment, four-day-old WT (Col-0), ktn1-4 and 35S::KTN1 seedlings were transferred onto 1/2 MS with 200 mM NaCl for the indicated time period. The transcript levels of every gene in WT (0 h) was normalized as 1.0. Error bars indicate SE. * P < 0.05 and ** P < 0.01 by a Student’s t test.

References

    1. Munns R., Tester M. Mechanisms of salinity tolerance. Annu. Rev. Plant Biol. 2008;59:651–681. doi: 10.1146/annurev.arplant.59.032607.092911. - DOI - PubMed
    1. Yang Y., Guo Y. Elucidating the molecular mechanisms mediating plant salt-stress responses. New Phytol. 2018;217:523–539. doi: 10.1111/nph.14920. - DOI - PubMed
    1. Yang Y., Guo Y. Unraveling salt stress signaling in plants. J. Integr. Plant Biol. 2018;60:796–804. doi: 10.1111/jipb.12689. - DOI - PubMed
    1. Zhu J.K. Salt and drought stress signal transduction in plants. Annu. Rev. Plant Biol. 2002;53:247–273. doi: 10.1146/annurev.arplant.53.091401.143329. - DOI - PMC - PubMed
    1. Cyr R.J. Microtubules in Plant Morphogenesis: Role of the Cortical Array. Annu. Rev. Cell Biol. 1994;10:153–180. doi: 10.1146/annurev.cb.10.110194.001101. - DOI - PubMed

MeSH terms

LinkOut - more resources