

Prioritization of novel ADPKD drug candidates from disease-stage specific gene expression profiles
- PMID: 31879244
- PMCID: PMC7000333
- DOI: 10.1016/j.ebiom.2019.11.046
Prioritization of novel ADPKD drug candidates from disease-stage specific gene expression profiles
Abstract
Background: Autosomal Dominant Polycystic Kidney Disease (ADPKD) is one of the most common causes of end-stage renal failure, caused by mutations in PKD1 or PKD2 genes. Tolvaptan, the only drug approved for ADPKD treatment, results in serious side-effects, warranting the need for novel drugs.
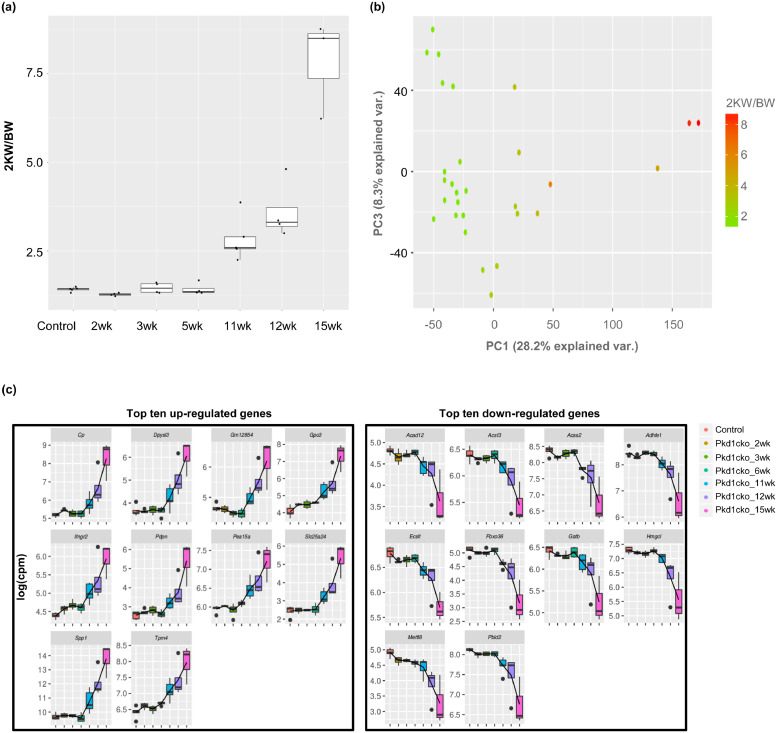
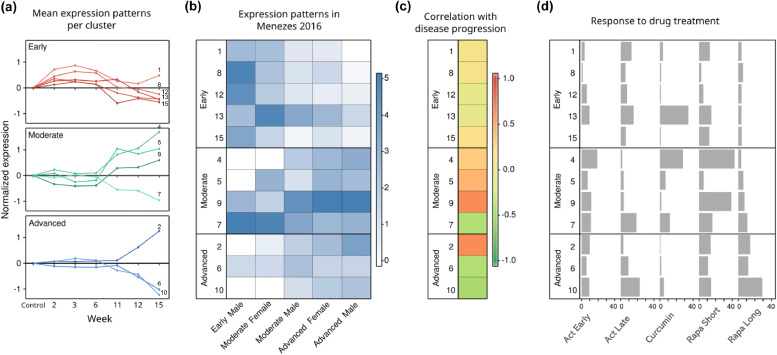
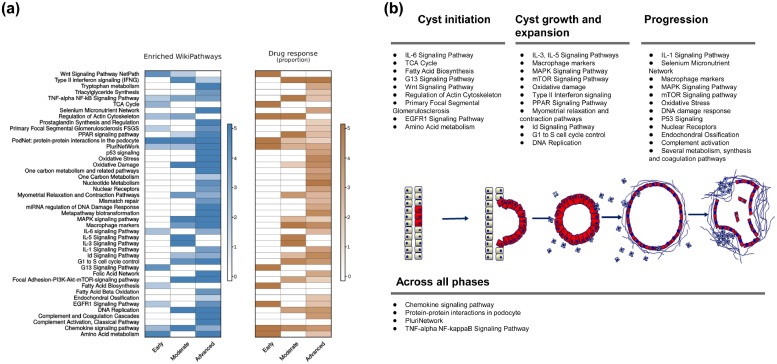
Methods: In this study, we applied RNA-sequencing of Pkd1cko mice at different disease stages, and with/without drug treatment to identify genes involved in ADPKD progression that were further used to identify novel drug candidates for ADPKD. We followed an integrative computational approach using a combination of gene expression profiling, bioinformatics and cheminformatics data.
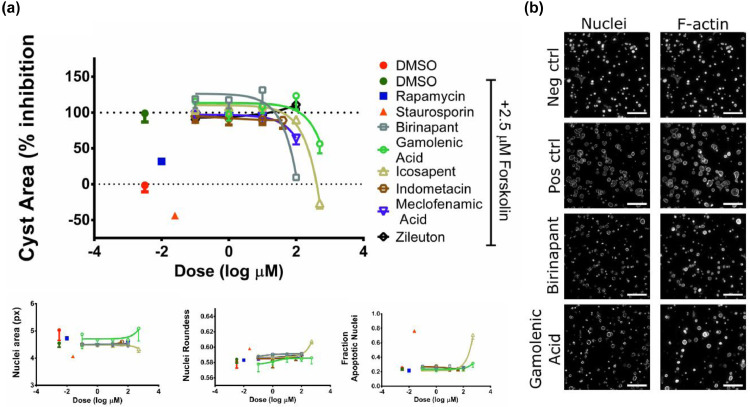
Findings: We identified 1162 genes that had a normalized expression after treating the mice with drugs proven effective in preclinical models. Intersecting these genes with target affinity profiles for clinically-approved drugs in ChEMBL, resulted in the identification of 116 drugs targeting 29 proteins, of which several are previously linked to Polycystic Kidney Disease such as Rosiglitazone. Further testing the efficacy of six candidate drugs for inhibition of cyst swelling using a human 3D-cyst assay, revealed that three of the six had cyst-growth reducing effects with limited toxicity.
Interpretation: Our data further establishes drug repurposing as a robust drug discovery method, with three promising drug candidates identified for ADPKD treatment (Meclofenamic Acid, Gamolenic Acid and Birinapant). Our strategy that combines multiple-omics data, can be extended for ADPKD and other diseases in the future.
Funding: European Union's Seventh Framework Program, Dutch Technology Foundation Stichting Technische Wetenschappen and the Dutch Kidney Foundation.
Keywords: 3D cyst assay; Autosomal dominant polycystic kidney disease; Cheminformatics; Drug repurposing; RNA-Sequencing.
Copyright © 2019 The Authors. Published by Elsevier B.V. All rights reserved.
Conflict of interest statement
Declaration of Competing Interest Kristina M. Hettne performed paid consultancy between November 1, 2015 and March 31, 2018 for Euretos B.V, a startup founded in 2012 that develops knowledge management and discovery services for the life sciences, with the Euretos Knowledge Platform as a marketed product. Leo Price is a founder shareholder and Hester Bange employee at OcellO B.V., which operates in the PKD drug discovery field. All other authors have nothing to disclose.
Figures
Comment in
-
Informatics-guided drug repurposing for Autosomal Dominant Polycystic Kidney Disease (ADPKD).EBioMedicine. 2020 Feb;52:102628. doi: 10.1016/j.ebiom.2020.102628. Epub 2020 Jan 22. EBioMedicine. 2020. PMID: 31981981 Free PMC article. No abstract available.
Similar articles
-
Autosomal dominant polycystic kidney disease and pioglitazone for its therapy: a comprehensive review with an emphasis on the molecular pathogenesis and pharmacological aspects.Mol Med. 2020 Dec 11;26(1):128. doi: 10.1186/s10020-020-00246-3. Mol Med. 2020. PMID: 33308138 Free PMC article. Review.
-
Prioritized polycystic kidney disease drug targets and repurposing candidates from pre-cystic and cystic mouse Pkd2 model gene expression reversion.Mol Med. 2023 May 22;29(1):67. doi: 10.1186/s10020-023-00664-z. Mol Med. 2023. PMID: 37217845 Free PMC article.
-
GLPG2737, a CFTR Inhibitor, Prevents Cyst Growth in Preclinical Models of Autosomal Dominant Polycystic Kidney Disease.Am J Nephrol. 2025 Apr 29:1-10. doi: 10.1159/000545614. Online ahead of print. Am J Nephrol. 2025. PMID: 40300563 Free PMC article.
-
Parallel microarray profiling identifies ErbB4 as a determinant of cyst growth in ADPKD and a prognostic biomarker for disease progression.Am J Physiol Renal Physiol. 2017 Apr 1;312(4):F577-F588. doi: 10.1152/ajprenal.00607.2016. Epub 2017 Jan 11. Am J Physiol Renal Physiol. 2017. PMID: 28077374 Free PMC article.
-
Drug repurposing in autosomal dominant polycystic kidney disease.Kidney Int. 2023 May;103(5):859-871. doi: 10.1016/j.kint.2023.02.010. Epub 2023 Mar 2. Kidney Int. 2023. PMID: 36870435 Review.
Cited by
-
The wind of change in the management of autosomal dominant polycystic kidney disease in childhood.Pediatr Nephrol. 2022 Mar;37(3):473-487. doi: 10.1007/s00467-021-04974-4. Epub 2021 Mar 7. Pediatr Nephrol. 2022. PMID: 33677691 Free PMC article. Review.
-
Ppia is the most stable housekeeping gene for qRT-PCR normalization in kidneys of three Pkd1-deficient mouse models.Sci Rep. 2021 Oct 5;11(1):19798. doi: 10.1038/s41598-021-99366-x. Sci Rep. 2021. PMID: 34611276 Free PMC article.
-
Metabolic Reprogramming and Reconstruction: Integration of Experimental and Computational Studies to Set the Path Forward in ADPKD.Front Med (Lausanne). 2021 Nov 24;8:740087. doi: 10.3389/fmed.2021.740087. eCollection 2021. Front Med (Lausanne). 2021. PMID: 34901057 Free PMC article. Review.
-
Informatics-guided drug repurposing for Autosomal Dominant Polycystic Kidney Disease (ADPKD).EBioMedicine. 2020 Feb;52:102628. doi: 10.1016/j.ebiom.2020.102628. Epub 2020 Jan 22. EBioMedicine. 2020. PMID: 31981981 Free PMC article. No abstract available.
-
Autosomal dominant polycystic kidney disease and pioglitazone for its therapy: a comprehensive review with an emphasis on the molecular pathogenesis and pharmacological aspects.Mol Med. 2020 Dec 11;26(1):128. doi: 10.1186/s10020-020-00246-3. Mol Med. 2020. PMID: 33308138 Free PMC article. Review.
References
-
- Nosengo N. Can you teach old drugs new tricks? Nature. 2016;534(7607):314–316. - PubMed
-
- Weinstein JN, Myers TG, O’Connor PM, Friend SH, Fornace AJ, Jr, Kohn KW. An information-intensive approach to the molecular pharmacology of cancer. Science. 1997;275(5298):343–349. - PubMed
-
- Hughes T, Andrews B, Boone C. Old drugs, new tricks: using genetically sensitized yeast to reveal drug targets. Cell. 2004;116(1):5–7. - PubMed
MeSH terms
LinkOut - more resources
Full Text Sources
Other Literature Sources
Miscellaneous
