. 2020 Jan 14;117(2):1191-1200.
doi: 10.1073/pnas.1916453117. Epub 2019 Dec 26.

The frequency of cortical microstimulation shapes artificial touch

Affiliations

The frequency of cortical microstimulation shapes artificial touch

Thierri Callier et al. Proc Natl Acad Sci U S A. .

Abstract

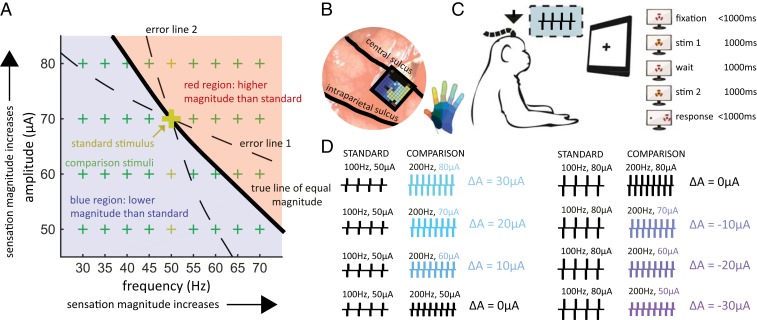
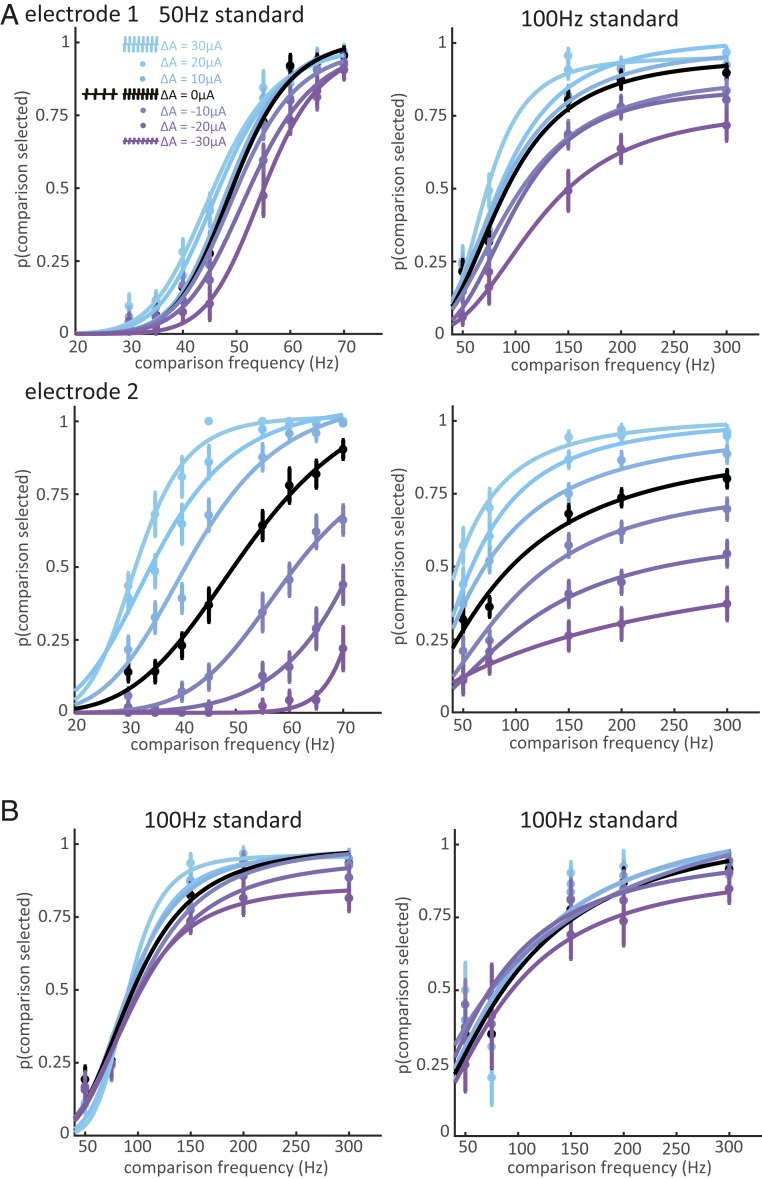
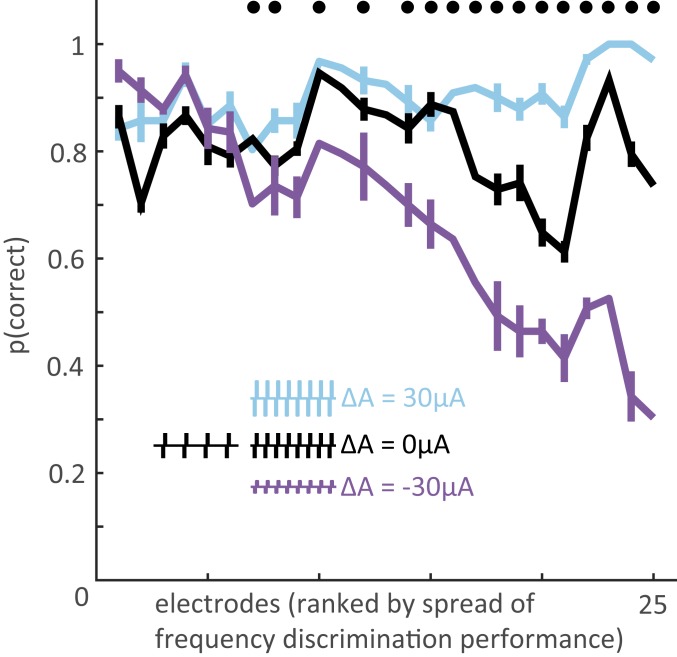
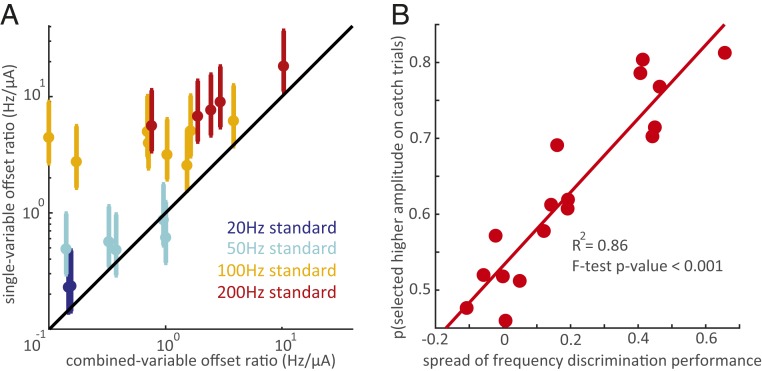
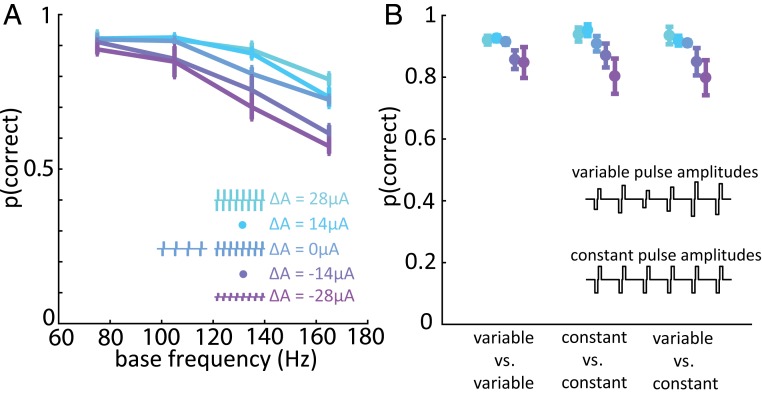
Intracortical microstimulation (ICMS) of the somatosensory cortex evokes vivid tactile sensations and can be used to convey sensory feedback from brain-controlled bionic hands. Changes in ICMS frequency lead to changes in the resulting sensation, but the discriminability of frequency has only been investigated over a narrow range of low frequencies. Furthermore, the sensory correlates of changes in ICMS frequency remain poorly understood. Specifically, it remains to be elucidated whether changes in frequency only modulate sensation magnitude-as do changes in amplitude-or whether they also modulate the quality of the sensation. To fill these gaps, we trained monkeys to discriminate the frequency of ICMS pulse trains over a wide range of frequencies (from 10 to 400 Hz). ICMS amplitude also varied across stimuli to dissociate sensation magnitude from ICMS frequency and ensure that animals could not make frequency judgments based on magnitude. We found that animals could consistently discriminate ICMS frequency up to ∼200 Hz but that the sensory correlates of frequency were highly electrode dependent: On some electrodes, changes in frequency were perceptually distinguishable from changes in amplitude-seemingly giving rise to a change in sensory quality; on others, they were not. We discuss the implications of our findings for neural coding and for brain-controlled bionic hands.

Keywords: artificial touch; bionic hands; neuroprosthetics; sensory feedback; temporal coding.


Conflict of interest statement

The authors declare no competing interest.

Figures

Fig. 1.
Fig. 1.
Experimental design. (A) Frequency/amplitude trade-off in perceived magnitude, illustrated with the stimuli used with a 50-Hz standard frequency. Each point on the surface represents a pair of stimulation parameters. Sensation magnitude increases with both frequency and amplitude. The thick black line describes stimuli whose sensory magnitude is equal to that of a 50-Hz, 70-µA stimulus (large gold +). In theory, the standard stimulus could then be paired with other comparison stimuli on the line and the animals could not discriminate frequency based on differences in magnitude. However, if the estimate of this line is incorrect (dashed lines), then the animals can still make frequency judgments based on differences in magnitude: Following error line 1, every comparison frequency greater than the standard frequency will feel more intense and every comparison frequency lower than the standard will feel less intense. The inverse is true for error line 2. As the relative contributions of frequency and amplitude to intensity vary across electrodes, characterizing the isointensity contour is challenging. The alternative approach is to present stimuli that tile the frequency and amplitude space (green +s), so that the magnitude of the higher-frequency stimulus is sometimes higher and sometimes lower than that of the lower-frequency stimulus. Reliance on magnitude will lead to poor overall performance and lower rewards. The separation between the blue and red regions will shift if the standard frequency is presented at other amplitudes (small gold +s). (B) A Utah electrode array (UEA) was implanted in the hand representation of area 1 (the implant of monkey C is shown). (C) The animal faced a monitor that signaled the trial sequence (shown on the right, red markers denote the gaze). The animal maintained fixation on a central target while 2 ICMS pulse trains were sequentially delivered and then reported its frequency judgment by making a saccade to one of 2 targets. The animal was rewarded if it selected the pulse train with the higher frequency (regardless of stimulus amplitude). (D) Example of standard-comparison frequency pair (not all amplitude combinations shown). Colors denote the difference in amplitude between the comparison and the standard stimulus. The largest amplitude difference was ±30 µA.
Fig. 2.
Fig. 2.
Frequency discrimination with equal amplitudes. (A) Performance on the frequency discrimination task when stimulus amplitudes were equal, averaged across all electrodes (n = 1 each from monkeys A and B for the 20-Hz standard; n = 5 from monkeys A and B for both the 50-Hz and 200-Hz standard; n = 8 from monkeys A, B, and C for the 100-Hz standard). Different colors denote different stimulus amplitudes. Error bars show the SEM across electrodes. The animals achieved high performance for frequencies below 200 Hz. (B) Just noticeable difference (JND) as a function of standard frequency. JNDs at each amplitude were averaged for each electrode. (C) Weber fractions as a function of standard frequency. Error bars in B and C denote the SEM across all electrodes tested at each standard.
Fig. 3.
Fig. 3.
Frequency discrimination with unequal amplitudes. (A, Top) Behavioral performance at one electrode from monkey A for standard frequencies of 50 and 100 Hz. Colors indicate amplitude differences between the comparison and standard frequencies (blue indicates the comparison stimulus amplitude was higher and purple indicates it was lower). The animal’s choices were slightly biased toward the higher amplitude. (A, Bottom) The same monkey’s performance for a different electrode. The monkey could perform frequency discrimination with equal amplitudes at both electrodes (black), but amplitude exerted a powerful influence on its frequency judgments when stimulation was delivered through this electrode. Error bars show the SEM across training blocks. (B) Behavioral performance on one low-bias electrode in monkey B (Left) and one in monkey C (Right).
Fig. 4.
Fig. 4.
Magnitude of the amplitude bias across electrodes. For the 25 electrodes tested (5 from monkey A, 17 from monkey B, 3 from monkey C), asymptotic performance on the frequency discrimination task with a frequency difference of 100 Hz (with base frequency ranging from 70 to 170 Hz) and amplitude differences of −30, 0, and 30 µA. Electrodes are ranked by spread, computed as the difference in performance between the 2 amplitude extremes (cyan and purple). Error bars represent the SEM performance at each base frequency. Data points without error bars represent the 100-Hz vs. 200-Hz performance for the 8 electrodes that were extensively tested (full psychometric curves were obtained). Black dots indicate electrodes at which differences in amplitude had a significant effect on performance (χ2 test, P < 0.01). The effect of amplitude on performance differed significantly across electrodes (2-way ANOVA of performance with amplitude difference and stimulation electrode as factors, interaction term P < 0.001).
Fig. 5.
Fig. 5.
Disentangling the effects of ICMS frequency and amplitude. (A) Offset ratios (the equivalent trade-off between frequency and amplitude changes) computed from single-variable discrimination experiments versus the offset ratios computed from combined-variable discrimination experiments. Each data point represents 1 electrode at 1 standard frequency (2 points for the 20-Hz standard, 5 for the 50- and 200-Hz standards, and 8 for the 100-Hz standard). Different colors denote different standard frequencies. The y axis error bars show the range of offset rates obtained by pairing each electrode’s same-amplitude frequency discrimination performance with the amplitude discrimination performance from all electrodes tested in the single-variable amplitude discrimination task (Data Analysis), and the marker shows the mean of these estimates. All but 2 electrodes at the 50-Hz standard are above the unity line, indicating that the relative effect of frequency is consistently greater in the combined-variable experiment. The single-variable offset ratios were significantly different from the combined-variable offset ratios (Mann–Whitney test, P < 0.01). (B) Proportion of catch trials in which the animal selected the higher amplitude stimulus versus spread, the difference in performance between the 2 amplitude extremes (+30 µA to −30 µA). Each data point represents 1 electrode from Monkey B. Probability of selecting the higher amplitude increased significantly with performance spread (linear regression R2 = 0.86, P < 0.001). The animal had negligible or no preference for the higher amplitude stimulus on catch trials at low-spread electrodes, confirming that the animal was not using sensation intensity to select higher frequencies. Catch trials represented ∼5% of trials at each electrode. The number of catch trials performed at each electrode ranged from 49 to 161.
Fig. 6.
Fig. 6.
Varying individual pulse amplitude has a negligible effect on frequency discrimination performance. (A) Monkey B’s performance vs. base frequency in the variable-amplitude experiment for a group of 4 electrodes with weak amplitude bias. The frequency difference was always 90 Hz for the variable-amplitude experiment due to hardware constraints (Methods). Error bars in A and B show the SEM across electrodes. (B) Performance when stimulus pulse trains were both variable-amplitude were split or were both constant-amplitude, for the same 4 electrodes with weak amplitude bias. The Inset illustrates variable-amplitude and constant-amplitude pulse trains. Changing spatial distribution of the ICMS-induced activity on a pulse-by-pulse basis had little to no effect on the animal’s ability to discriminate frequency.

References

    1. Berg J. A., et al. , Behavioral demonstration of a somatosensory neuroprosthesis. IEEE Trans. Neural Syst. Rehabil. Eng. 21, 500–507 (2013). - PubMed
    1. Flesher S. N., et al. , Intracortical microstimulation of human somatosensory cortex. Sci. Transl. Med. 8, 361ra141 (2016). - PubMed
    1. Flesher S., et al. , “Restoring touch through intracortical microstimulation of human somatosensory cortex” in Proceedings of 2017 New Generation of CAS (NGCAS) (IEEE, 2017), pp. 185–188.
    1. Kim S., Callier T., Tabot G. A., Tenore F. V., Bensmaia S. J., Sensitivity to microstimulation of somatosensory cortex distributed over multiple electrodes. Front. Syst. Neurosci. 9, 47 (2015). - PMC - PubMed
    1. Kim S., et al. , Behavioral assessment of sensitivity to intracortical microstimulation of primate somatosensory cortex. Proc. Natl. Acad. Sci. U.S.A. 112, 15202–15207 (2015). - PMC - PubMed

Publication types

LinkOut - more resources