. 2020 Jan 14;117(2):1129-1138.
doi: 10.1073/pnas.1910856117. Epub 2019 Dec 26.

CCR2 inhibition reduces tumor myeloid cells and unmasks a checkpoint inhibitor effect to slow progression of resistant murine gliomas

Affiliations

CCR2 inhibition reduces tumor myeloid cells and unmasks a checkpoint inhibitor effect to slow progression of resistant murine gliomas

Joseph A Flores-Toro et al. Proc Natl Acad Sci U S A. .

Abstract

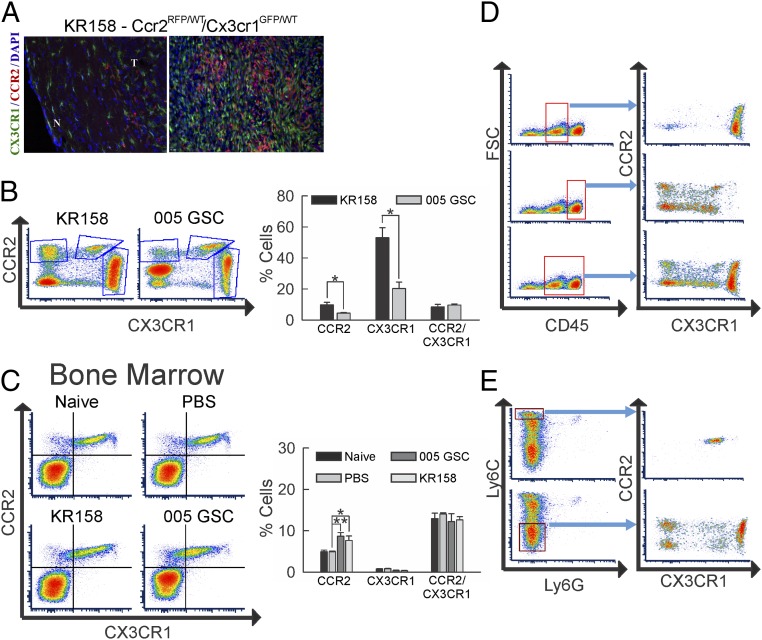
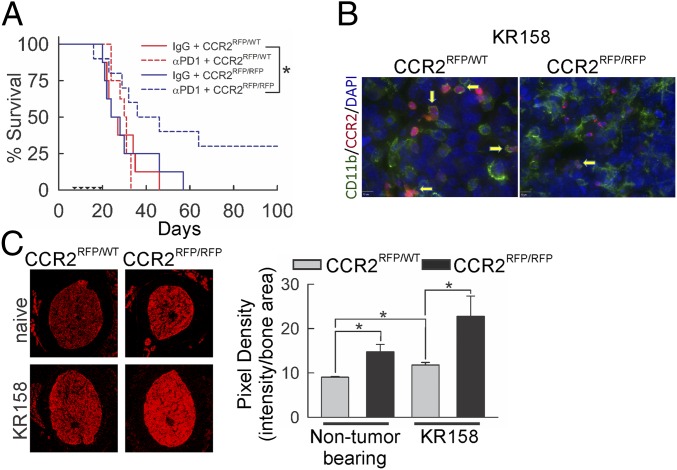
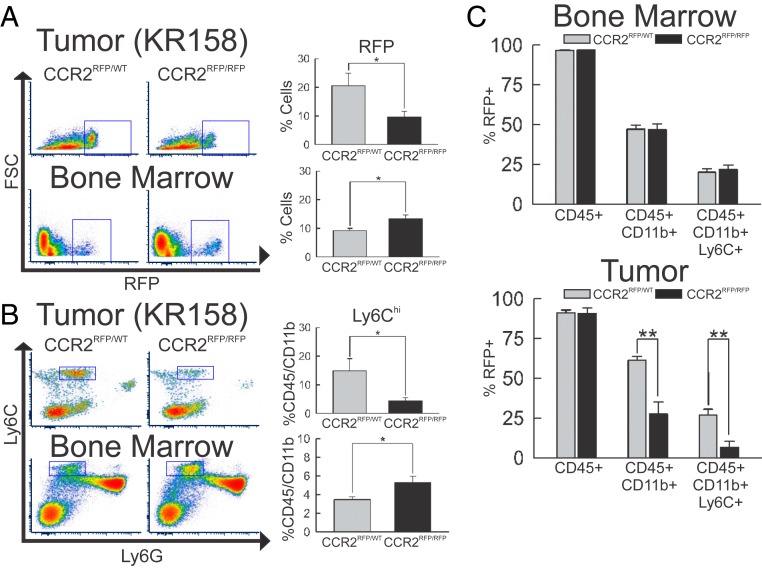
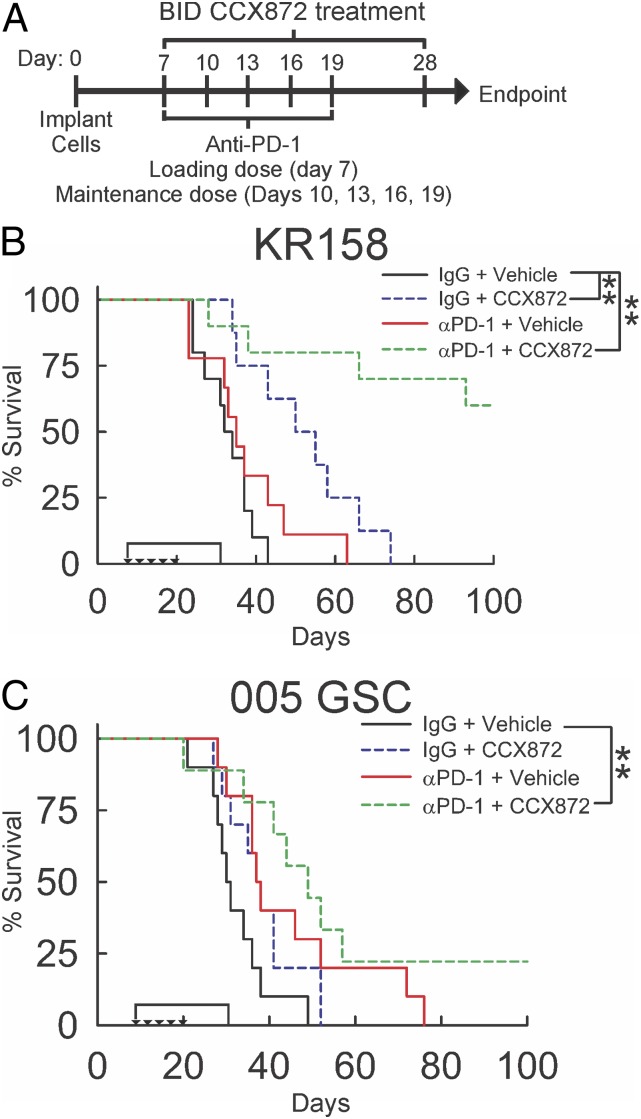
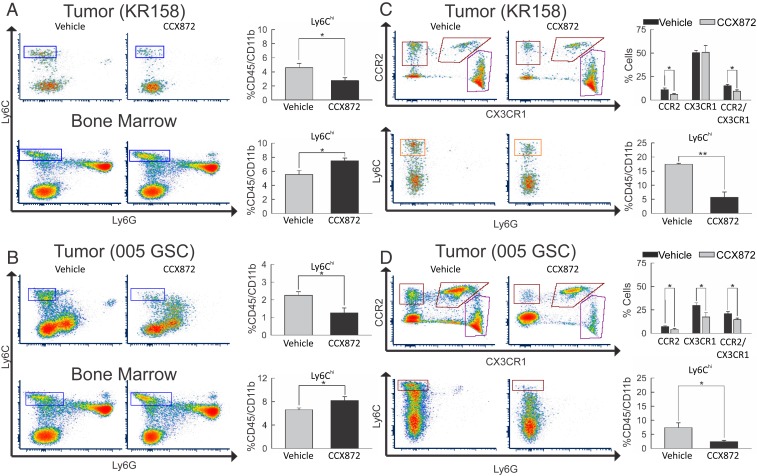
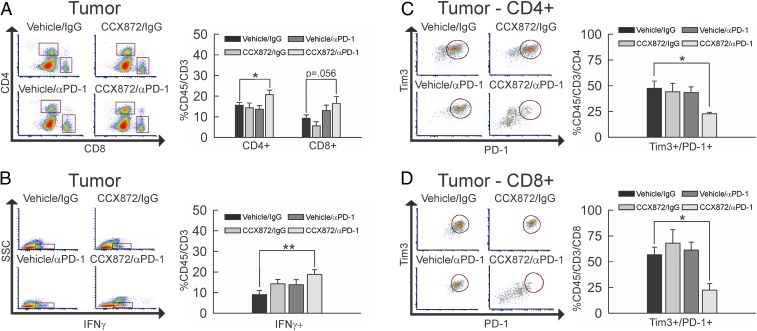
Immunotherapy directed at the PD-L1/PD-1 axis has produced treatment advances in various human cancers. Unfortunately, progress has not extended to glioblastoma (GBM), with phase III clinical trials assessing anti-PD-1 monotherapy failing to show efficacy in newly diagnosed and recurrent tumors. Myeloid-derived suppressor cells (MDSCs), a subset of immunosuppressive myeloid derived cells, are known to infiltrate the tumor microenvironment of GBM. Growing evidence suggests the CCL2-CCR2 axis is important for this process. This study evaluated the combination of PD-1 blockade and CCR2 inhibition in anti-PD-1-resistant gliomas. CCR2 deficiency unmasked an anti-PD-1 survival benefit in KR158 glioma-bearing mice. CD11b+/Ly6Chi/PD-L1+ MDSCs within established gliomas decreased with a concomitant increase in overall CCR2+ cells and MDSCs within bone marrow of CCR2-deficient mice. The CCR2 antagonist CCX872 increased median survival as a monotherapy in KR158 glioma-bearing animals and further increased median and overall survival when combined with anti-PD-1. Additionally, combination of CCX872 and anti-PD-1 prolonged median survival time in 005 GSC GBM-bearing mice. In both models, CCX872 decreased tumor associated MDSCs and increased these cells within the bone marrow. Examination of tumor-infiltrating lymphocytes revealed an elevated population, increased IFNγ expression, indicating enhanced cytolytic activity, as well as decreased expression of exhaustion markers in CD4+ and CD8+ T cells following combination treatment. These data establish that combining CCR2 and PD-1 blockade extends survival in clinically relevant murine glioma models and provides the basis on which to advance this combinatorial treatment toward early-phase human trials.

Keywords: glioblastoma; immunotherapy; myeloid-derived suppressor cells; programmed death-1; tumor microenvironment.


Conflict of interest statement

Competing interest statement: J.J.C., I.F.C., R.S., and T.J.S. are all employed by ChemoCentryx and are stockholders. D.A.M. holds patented technologies that have been licensed or have exclusive options to license to Celldex Therapeutics, Annias, Immunomic Therapeutics, and iOncologi. D.A.M. receives research funding from Immunomic Therapeutics. D.A.M. serves as an advisor/consultant to Bristol-Myers Squibb, Tocagen, and Oncorus. D.A.M. is cofounder of iOncologi, Inc., an immunooncology biotechnology company. Neither any reagent nor any funding from these organizations was used in this study. J.A.F.-T., D.L., A.G., M.R.S., M.D., and J.K.H. have no competing interests to report. R.K.J. received honorarium from Amgen; consultant fees from Chugai, Merck, Ophthotech, Pfizer, SPARC, SynDevRx, XTuit; owns equity in Enlight, Ophthotech, SynDevRx; and serves on the Boards of Trustees of Tekla Healthcare Investors, Tekla Life Sciences Investors, the Tekla Healthcare Opportunities Fund, and the Tekla World Healthcare Fund. Neither any reagent nor any funding from these organizations was used in this study.

Figures

Fig. 1.
Fig. 1.
Distinct cell populations of CCR2- and CX3CR1-expressing myeloid cells in glioma-bearing mice. (A) Fluorescent images showing representative example of section of KR158 tumor-bearing Ccr2RFP/WT/Cx3cr1GFP/WT normal (N) and tumor (T) tissue. Red fluorescence denotes CCR2+ cells, while green fluorescence denotes CX3CR1+ cells. (Image magnification: 20×.) (B) Flow-cytometric analysis of tumor isolates from KR158 (n = 4) (Left) and 005 GSC (n = 3) (Right) tumor-bearing Ccr2RFP/WT;Cx3cr1GFP/WT mice. Higher CCR2 single-positive (P = 0.048) and CX3CR1 single-positive (P = 0.012) cell populations in KR158 vs. 005 GSC glioma models are noted. (C) Flow-cytometric analysis of bone marrow cell populations in CCR2/RFP vs. CX3CR1/GFP in naïve (n = 3) (Upper Left), mock PBS-injected (n = 6) (Upper Right), 005 GSC (n = 3) (Lower Left), and KR158 (n = 6) (Lower Right) tumor-bearing Ccr2RFP/WT;Cx3cr1GFP/WT animals. Quantification shows increase in CCR2 single-positive cells in KR158 (P = 0.032) and 005 GSC (P = 0.001) tumor-bearing animals. (D) Flow-cytometric analysis of tumor isolates from Ccr2RFP/WT;Cx3cr1GFP/WT mice. The left graphs represent forward scatter (FSC) vs. CD45 plots demonstrating 3 CD45 populations: negative (left), low (middle), and high (right). Blue arrows denote subpopulations plotted by expression of CCR2 and CX3CR1. CD45low events (Upper) represent a primarily CX3CR1+ cell population, while CD45hi events represent a heterogeneous cell population consisting of CCR2+, CX3CR1+, and CCR2/CX3CR1 cells. (E) Flow-cytometric analysis of tumor isolates from Ccr2RFP/WT;Cx3cr1GFP/WT mice. The left graphs represent Ly6C+ vs. Ly6G+ events and demonstrate 3 Ly6C populations: negative (bottom), intermediate (middle), and high (top). Blue arrows denote subpopulations plotted by expression of CCR2 and CX3CR1. Ly6Chi events represent a cell population that is primarily CCR2+/CX3CR1+, while Ly6C events represent a heterogeneous cell population consisting of CCR2+, CX3CR1+, and CCR2/CX3CR1 cells. Representative plots are shown throughout. *P < 0.05; **P < 0.01.
Fig. 2.
Fig. 2.
Effect of Ccr2 deficiency on glioma-bearing mice. (A) Survival analysis of KR158 tumor-bearing Ccr2RFP/WT and Ccr2RFP/RFP mice treated with or without anti-PD-1. Ccr2 deficiency did not impact survival in IgG-treated Ccr2RFP/WT mice (n = 8), while anti-PD-1 treatment (n = 10) enhanced survival (P = 0.035) in Ccr2-deficient mice only. Triangles mark anti-PD-1 administration. (B) Fluorescent imaging of CD11b (green stain) in Ccr2RFP/WT and Ccr2RFP/RFP mice. Representative images shown. (C) Fluorescent imaging of femur cross-section from Ccr2RFP/WT and Ccr2RFP/RFP naive and KR158 tumor-bearing mice. Loss of Ccr2 enhanced CCR2/RFP signal in bone marrow of naive mice (P = 0.029), which was further enhanced in tumor-bearing Ccr2RFP/RFP animals (P = 0.036). Representative images are shown. Quantification: average pixel density/cross-sectional area from 3 consecutive sections, 3 mice/treatment group. *P < 0.05.
Fig. 3.
Fig. 3.
Impact of Ccr2 deficiency on peripheral and tumor MDSC populations. (A) Flow-cytometric analysis of RFP+ events in Ccr2RFP/WT (n = 6) vs. Ccr2RFP/RFP (n = 6) mice. Population of RFP+ cells within the tumor microenvironment (Upper) is reduced (P = 0.047) but increased (P = 0.024) in bone marrow (Lower) of Ccr2-deficient animals. (B) Flow-cytometric analysis of CD45+/CD11b+/Ly6Chi events in Ccr2RFP/WT (n = 5) vs. Ccr2RFP/RFP (n = 5) mice. Population of CD45+/CD11b+/Ly6Chi cells within the tumor microenvironment (Upper) was reduced (P = 0.039) but increased (P = 0.020) in bone marrow (Lower) of Ccr2-deficient animals. (C) Quantification of percentage of RFP+ cells that are CD45+, CD45+/CD11b+, and CD45+/CD11b+/Ly6Chi within bone marrow (Upper) and tumor (Lower) in Ccr2RFP/WT (n = 5) vs. Ccr2RFP/RFP (n = 5) mice. Ratios remain unchanged in bone marrow but show a significant reduction (P = 0.007) of CD45+/CD11b+/Ly6Chi cells in tumors of Ccr2RFP/RFP vs. Ccr2RFP/WT mice. Representative plots are shown throughout. *P < 0.05; **P < 0.01. FSC, forward scatter.
Fig. 4.
Fig. 4.
Effect of combinatorial CCX872/anti-PD-1 treatment on survival of KR158 and 005 GSC glioma-bearing mice. (A) Schematic representation of CCX872 and anti-PD-1 treatment schedules. Survival analysis of KR158 (n= 8 to 10) (B) and 005 GSC (n = 8 to 10) (C) tumor-bearing WT mice treated with CCX872 and anti-PD-1. In KR158 glioma-bearing mice, CCX872 increased median survival (P = 0.002, 32 vs. 50 d). Combinatorial treatment increased durable survival (P = 0.001); 005 GSC-bearing animals had an increase in median survival (P = 0.005, 30 vs. 49 d) with combinatorial treatment. Triangles mark anti-PD-1 administration. The bracket indicates CCX872 administration. *P < 0.05; **P < 0.01.
Fig. 5.
Fig. 5.
Impact of combinatorial CCX872/anti-PD-1 treatment on peripheral and tumor myeloid cell populations. (A) Flow-cytometric analysis of Ly6C+ vs. Ly6G+ events in KR158 tumor isolates (Upper) and bone marrow cell populations (Lower) from vehicle-treated (n = 6) and CCX872-treated (n = 6) animals. Drug treatment resulted in a reduction (P = 0.038) of Ly6Chi events within tumors and an increase (P = 0.028) in bone marrow. (B) Flow-cytometric analysis of Ly6C+ vs. Ly6G+ events in 005 GSC tumor isolates (Upper) and bone marrow cell populations (Lower) from vehicle-treated (n = 6) and CCX872-treated (n = 5) animals. Drug treatment resulted in a reduction (P = 0.015) in Ly6Chi events within tumors and an increase (P = 0.028) in bone marrow. (C) Flow-cytometric analysis of tumor isolates from KR158 tumor-bearing Ccr2RFP/WT/Cx3cr1GFP/WT mice depicting CCR2+ vs. CX3CR1+ (Upper) and Ly6C+ vs. Ly6G+ events (Lower) from vehicle-treated (n = 5) and CCX872-treated (n = 7) animals. Drug treatment resulted in a significant reduction of CCR2+ (P = 0.024) and CCR2+/CX3CR1+ (P = 0.032) events. The lower graphs report a reduction (P = 0.004) in Ly6Chi events within tumors. (D) Flow-cytometric analysis of tumor isolates from 005 GSC tumor-bearing Ccr2RFP/WT/Cx3cr1GFP/WT mice depicting CCR2+ vs. CX3CR1+ (Upper) and Ly6C+ vs. Ly6G+ events (Lower) from vehicle-treated (n = 6) and CCX872-treated (n = 6) animals. Drug treatment resulted in a reduction of CCR2+ (P = 0.003), CX3CR1+ (P = 0.003), and CCR2+/CX3CR1+ (P = 0.0419) events. The lower graphs report a reduction (P = 0.020) in Ly6Chi events within tumors. Representative plots are shown throughout. *P < 0.05; **P < 0.01.
Fig. 6.
Fig. 6.
Impact of combinatorial CCX872/anti-PD-1 treatment on CD4+ and CD8+ T cells. (A) Flow-cytometric analysis of CD45+/CD3+/CD4+ and CD8+ events within tumor extracts from vehicle/IgG-treated (n = 7), CCX872/IgG-treated (n = 4), vehicle/anti-PD-1–treated (n = 6), or CCX872/anti-PD-1–treated (n = 4) 005 GSC glioma-bearing mice. The population of CD45+/CD3+/CD4+ cells (upper square) was significantly increased (P = 0.044) with combination CCX872/anti-PD-1 treatment as compared to vehicle/IgG, while the CD45+/CD3+/CD8+ population (lower square) trended toward increase (P = 0.056) between the same groups. (B) Flow-cytometric analysis of side scatter (SSC) vs. CD45+/CD3+/IFNγ+ events (denoted by square) within tumor extracts from vehicle/IgG-treated (n = 7), CCX872/IgG-treated (n = 4), vehicle/anti-PD-1–treated (n = 5), or CCX872/anti-PD-1–treated (n = 6) 005 GSC glioma-bearing mice. The population of CD45+/CD3+/IFNγ+ cells was significantly increased (P = 0.008) with combination CCX872/anti-PD-1 treatment as compared to vehicle/IgG. (C and D) Flow-cytometric analysis of CD45+/CD3+/PD-1+/Tim3+/CD4+ (C) and CD8+ (D) events within tumor extracts from vehicle/IgG-treated (n = 7), CCX872/IgG-treated (n = 4), vehicle/anti-PD-1–treated (n = 6), or CCX872/anti-PD-1–treated (n = 4) 005 GSC glioma-bearing mice. The population of CD45+/CD3+/PD-1+/Tim3+/CD4+ cells (circled population) was significantly decreased (P = 0.029) with combination CCX872/anti-PD-1 treatment as compared to vehicle/IgG. The population of CD45+/CD3+/PD-1+/Tim3+/CD8+ cells (circled population) also decreased (P = 0.011) between the same groups. Representative plots are shown throughout. *P < 0.05; **P < 0.01.

References

    1. Stupp R., et al. ; European Organisation for Research and Treatment of Cancer Brain Tumor and Radiotherapy Groups ; National Cancer Institute of Canada Clinical Trials Group , Radiotherapy plus concomitant and adjuvant temozolomide for glioblastoma. N. Engl. J. Med. 352, 987–996 (2005). - PubMed
    1. Furnari F. B., et al. , Malignant astrocytic glioma: Genetics, biology, and paths to treatment. Genes Dev. 21, 2683–2710 (2007). - PubMed
    1. Wen P. Y., Kesari S., Malignant gliomas in adults. N. Engl. J. Med. 359, 492–507 (2008). - PubMed
    1. Johansson Swartling F., Identifying candidate genes involved in brain tumor formation. Ups. J. Med. Sci. 113, 1–38 (2008). - PubMed
    1. Colman H., Aldape K., Molecular predictors in glioblastoma: Toward personalized therapy. Arch. Neurol. 65, 877–883 (2008). - PubMed

Publication types

MeSH terms

LinkOut - more resources