. 2020 Feb 1;34(3-4):179-193.
doi: 10.1101/gad.331371.119. Epub 2019 Dec 26.

TRPS1 acts as a context-dependent regulator of mammary epithelial cell growth/differentiation and breast cancer development

Affiliations

TRPS1 acts as a context-dependent regulator of mammary epithelial cell growth/differentiation and breast cancer development

Lisette M Cornelissen et al. Genes Dev. .

Abstract

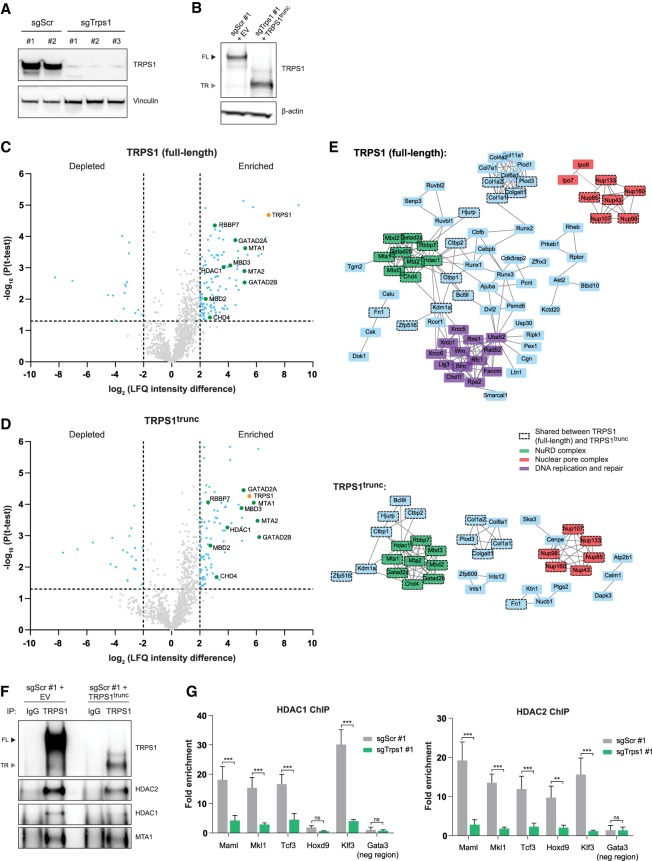
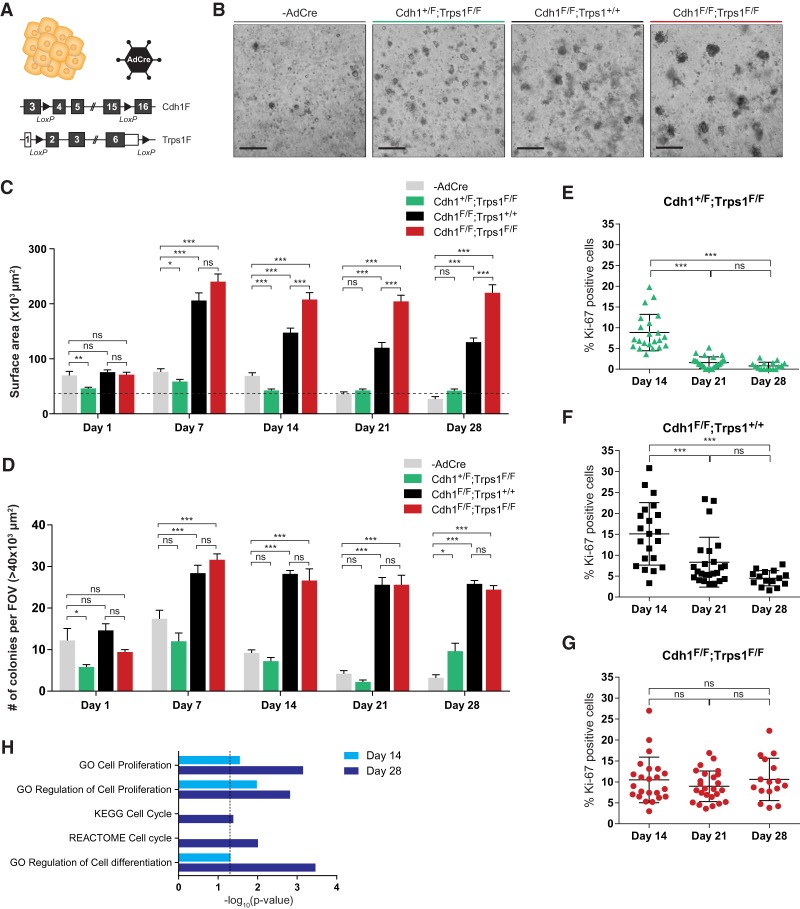
The GATA-type zinc finger transcription factor TRPS1 has been implicated in breast cancer. However, its precise role remains unclear, as both amplifications and inactivating mutations in TRPS1 have been reported. Here, we used in vitro and in vivo loss-of-function approaches to dissect the role of TRPS1 in mammary gland development and invasive lobular breast carcinoma, which is hallmarked by functional loss of E-cadherin. We show that TRPS1 is essential in mammary epithelial cells, since TRPS1-mediated suppression of interferon signaling promotes in vitro proliferation and lactogenic differentiation. Similarly, TRPS1 expression is indispensable for proliferation of mammary organoids and in vivo survival of luminal epithelial cells during mammary gland development. However, the consequences of TRPS1 loss are dependent on E-cadherin status, as combined inactivation of E-cadherin and TRPS1 causes persistent proliferation of mammary organoids and accelerated mammary tumor formation in mice. Together, our results demonstrate that TRPS1 can function as a context-dependent tumor suppressor in breast cancer, while being essential for growth and differentiation of normal mammary epithelial cells.

Keywords: E-cadherin; ILC; TRPS1; breast cancer; context-dependent regulator; mammary gland development.


Figures

Figure 1.
Figure 1.
Recurrent Sleeping Beauty (SB) insertions in Trps1 results in a truncated protein that accumulates in the cytoplasm and does not interact with the DNA. (A) Schematic overview of SB insertions identified in intronic regions of the Trps1 gene in all tumors analyzed (Kas et al. 2017). Each arrow represents an unique SB insertion. Schematic overviews of the Trps1 locus and TRPS1 protein are indicated below the SB insertions. Numbered boxes represent exons of the canonical gene transcript. (B) Distribution of the number of insertions per tumor in Trps1. Tumors without insertions in the intronic region between exons 4 and 5 are indicated in black, and tumors with insertions in this intronic region are indicated in gray. (C) Western blot analysis of TRPS1 expression in tumors with the indicated number of SB insertions in Trps1. β-Actin was used as a loading control. (Black arrowhead) Full-length TRPS1 (FL); (gray arrowhead) truncated TRPS1 (TR). (D) Representative microscopic images of TRPS1 expression by immunohistochemistry in a tumor without insertions in Trps1 (left) and with insertions in Trps1 (right). Scale bars, 100 μm (top), 25 μm (bottom). (E) Representative microscopic images of TRPS1 expression detected by immunofluorescence in tumor-derived cell lines without (left) and with (right) insertions in Trps1. Scale bars, 20 μm. (F) Heat map illustrating raw peak intensity of TRPS1 ChIP-seq in tumor-derived cell lines without (red) and with (blue) insertions in Trps1. A window of 5 kb around the peak is shown. (G) Average read count profiles of the total TRPS1 peak signal.
Figure 2.
Figure 2.
TRPS1 interacts with the NuRD complex and loss of TRPS1 expression reduces DNA binding of HDAC1 and HDAC2. (A) Western blot analysis of TRPS1 expression in CRISPR-mediated TRPS1 knockout (sgTrps1) HC11 clones compared with scrambled controls (sgScr). Vinculin was used as a loading control. (B) Western blot analysis of TRPS1 expression in control cells transduced with empty vector and TRPS1 knockout cells transduced with TRPS1trunc. β-Actin was used as a loading control. (Black arrowhead) Full-length TRPS1 (FL); (gray arrowhead) truncated TRPS1 (TR). (C,D) Volcano plots showing protein interactors of full-length (C) and truncated (D) TRPS1 compared with IgG control in HC11 cells in four independent experiments. TRPS1 (orange) and members of the NuRD complex (green) are indicated. LFQ, label-free quantification. (E) Projection of all significant interactors identified in C and D onto the STRING protein–protein interaction network (version 11). Only proteins that interact with two or more proteins are shown based on known interactions from curated databases and experimentally determined interactions. (F) Coimmunoprecipitation of full-length TRPS1 and TRPS1trunc with members of the NuRD complex in HC11 cells. (Black arrowhead) Full-length TRPS1 (FL); (gray arrowhead) truncated TRPS1 (TR). (G) HDAC1 and HDAC2 ChIP-qPCR analysis in TRPS1-proficient and -deficient HC11 cells. Five target regions and one negative control region of a representative experiment are shown. Data represent mean + standard deviation (SD), n = 3. Two-way ANOVA: (***) P < 0.001; (**) P < 0.01; (ns) P > 0.05.
Figure 3.
Figure 3.
TRPS1 loss impairs cell proliferation and lactogenic differentiation, mediated by increased interferon signaling. (A) Cell proliferation of control and TRPS1 knockout HC11 clones, as quantified using IncuCyte imaging for 140 h. Data represent mean ± standard error of the mean (SEM). (B) RT-qPCR analysis of β-casein (Csn2) expression levels upon stimulation with DIP mix (dexamethasone, insulin, and prolactin) in control and TRPS1 knockout HC11 clones. Data represent mean + SD, n = 2. One-way ANOVA: (***) P < 0.001. (C) Pathway enrichment analysis performed on RNA-seq of HC11 control and TRPS1 knockout cells, using the MSigDB hallmark gene set collection (Liberzon et al. 2015). FDR < 0.05 was considered significant (blue bars). (D) Heat map reflecting gene expression changes at the genes listed in the interferon α and interferon γ gene sets indicated in C between HC11 control and TRPS1 knockout cells. Key factors in these signaling pathways are indicated. (E) Western blot analysis of STAT1 and STAT2 expression levels in HC11 control and TRPS1 knockout cells transduced with a nontargeting shRNA or a pool of shRNAs targeting Stat1. β-actin was used as a loading control. (F) RT-qPCR analysis of β-casein (Csn2) expression levels upon stimulation with DIP mix in control and TRPS1 knockout HC11 clones transduced with a nontargeting shRNA or a pool of shRNAs targeting Stat1. Data represent mean + SD, n = 3. One-way ANOVA: (***) P < 0.001.
Figure 4.
Figure 4.
Loss of TRPS1 expression during development of the mammary gland is not tolerated in E-cadherin-proficient luminal cells, but results in the formation of lesions in combination with E-cadherin loss. (A) Schematic overview of the engineered alleles in MMTV-cre;Trps1+/+;mT/mG (Trps1+/+) and MMTV-cre;Trps1F/F;mT/mG (Trps1F/F) mice. (B) Representative images of GFP and TRPS1 expression in mammary glands of Trps1+/+ (left) and Trps1F/F (right) animals at 6.5 and 10 wk of age and at day 15 of pregnancy, detected by immunofluorescence. Nuclei were counterstained with Hoechst. Scale bars, 50 μm. (C) Quantification of percentage GFP-positive cells per field. Data represent measurements of five fields in three animals per condition. Two-way ANOVA: (***) P < 0.001. (D) Schematic overview of the engineered alleles in MMTV-cre;Cdh1+/F;Trps1+/F;mT/mG (Cdh1+/F/Trps1+/F), MMTV-cre;Cdh1+/F;Trps1F/F;mT/mG (Cdh1+/F/Trps1F/F), MMTV-cre;Cdh1F/F;Trps1+/F;mT/mG (Cdh1F/F/Trps1+/F), and MMTV-cre;Cdh1F/F;Trps1F/F;mT/mG (Cdh1F/F/Trps1F/F) animals. (E) Representative images of GFP, TRPS1, and E-cadherin expression in mammary glands of the indicated genotypes at 10 wk of age, detected by immunofluorescence. Nuclei were counterstained with Hoechst. Scale bars, 50 μm. (F) Quantification of percentage of GFP-positive cells per field. Data represent measurements of five fields in three animals per condition. One-way ANOVA: (***) P < 0.001; (**) P < 0.01; (ns) P > 0.05.
Figure 5.
Figure 5.
Combined loss of E-cadherin and TRPS1 expression in primary mammary organoids results in prolonged proliferation. (A) Schematic overview of the engineered alleles in Cdh1+/F;Trps1F/F, Cdh1F/F;Trps1+/+ and Cdh1F/F;Trps1F/F primary organoids, in which recombination is induced in vitro by addition of adenovirus encoding Cre (AdCre). (B) Representative bright field images of primary untransduced and AdCre-transduced organoids 28 d after seeding. Scale bars, 500 μm. (C) Quantification of surface area of primary organoids as shown in B, at different time points. Data represent mean + SEM of measurements of organoids within five fields of view per condition. Two-way ANOVA: (***) P < 0.001; (**) P < 0.01; (*) P < 0.05; (ns) P > 0.05. Dotted line indicates the 40 × 103-μm2 size cutoff used to quantify the number of organoids in D. (D) Quantification of the number of organoids larger than 40 × 103 μm2 shown in C. Data represent mean + SD of the number of organoids within five fields of view per condition. Two-way ANOVA: (***) P < 0.001; (*) P < 0.05; (ns) P > 0.05. (FOV) Field of view. (EG) Quantification of percentage of Ki-67-expressing cells in Cdh1+/F;Trps1F/F (E), Cdh1F/F;Trps1+/+ (F), and Cdh1F/F;Trps1F/F (G) primary organoids, detected by immunofluorescence. Data represent measurements from three independent organoid isolations. One-way ANOVA: (***) P < 0.001; (ns) P > 0.05. (H) Differentially expressed genes (log2FC >2/<–2) between Cdh1F/F;Trps1+/+ and Cdh1F/F;Trps1F/F primary organoids at days 14 and 28, as determined by RNA-seq, are enriched for cell cycle, cell proliferation, and cell differentiation related gene sets. Fisher exact test: P < 0.05 is considered significant.
Figure 6.
Figure 6.
Combined loss of E-cadherin and TRPS1 results in acceleration of tumor formation. (A) Schematic overview of the engineered alleles in WAP-cre;Cdh1+/F;Trps1+/+(Cdh1+/F;Trps1+/+), WAP-cre;Cdh1+/F;Trps1F/F(Cdh1+/F;Trps1F/F), WAP-cre;Cdh1F/F;Trps1+/+ (Cdh1F/F;Trps1+/+), and WAP-cre;Cdh1F/F;Trps1F/F (Cdh1F/F;Trps1F/F) mice. (B) Kaplan-Meier analysis of mammary tumor free survival of Cdh1+/F;Trps1+/+ (n = 6), Cdh1+/F;Trps1F/F (n = 22), Cdh1F/F;Trps1+/+ (n = 19), and Cdh1F/F;Trps1F/F (n = 23) mice. Mantel-Cox: (***) P < 0.001; (*) P < 0.05; (ns) P > 0.05. (C) Representative images of H&E staining, and TRPS1 and E-cadherin expression detected by immunohistochemistry in end-stage tumors derived from Cdh1+/F;TRPS1F/F, and Cdh1F/F;TRPS1F/F mice, and a healthy duct. Scale bars, 50 μm. (D) Distribution of tumor burden, determined in four mammary glands per mouse upon sacrifice. χ2: (***) P < 0.001; (*) P < 0.05. (E) Kaplan-Meier analysis of overall survival of breast cancer patients with high TRPS1 versus low TRPS1 expressing IDCs (left) or ILCs (right) from the METABRIC breast cancer data set (Curtis et al. 2012; Pereira et al. 2016). TRPS1 high: Z-score > 0; TRPS1 low: Z-score < 0. Mantel-Cox. (F) Kaplan-Meier analysis of overall survival of breast cancer patients with high TRPS1 versus low TRPS1 expressing ILCs from the METABRIC breast cancer data set (Curtis et al. 2012; Pereira et al. 2016), the RATHER project (Michaut et al. 2016), and Metzger-Filho et al. (2013) combined.

References

    1. Asselin-Labat M-L, Sutherland KD, Barker H, Thomas R, Shackleton M, Forrest NC, Hartley L, Robb L, Grosveld FG, van der Wees J, et al. 2007. Gata-3 is an essential regulator of mammary-gland morphogenesis and luminal-cell differentiation. Nat Cell Biol 9: 201–209. 10.1038/ncb1530 - DOI - PubMed
    1. Ball RK, Friis RR, Schoenenberger CA, Doppler W, Groner B. 1988. Prolactin regulation of β-casein gene expression and of a cytosolic 120-kd protein in a cloned mouse mammary epithelial cell line. EMBO J 7: 2089–2095. 10.1002/j.1460-2075.1988.tb03048.x - DOI - PMC - PubMed
    1. Basta J, Rauchman M. 2015. The nucleosome remodeling and deacetylase (NuRD) complex in development and disease. Transl Res J Lab Clin Med 165: 36–47. 10.1016/j.trsl.2014.05.003 - DOI - PMC - PubMed
    1. Berns EMJJ, Klijn JGM, van Putten WLJ, van Staveren IL, Portengen H, Foekens JA. 1992. c-myc amplification is a better prognostic factor than HER2/neu amplification in primary breast cancer. Cancer Res 52: 1107–1113. - PubMed
    1. Bharat A, Gao F, Margenthaler JA. 2009. Tumor characteristics and patient outcomes are similar between invasive lobular and mixed invasive ductal/lobular breast cancers but differ from pure invasive ductal breast cancers. Am J Surg 198: 516–519. 10.1016/j.amjsurg.2009.06.005 - DOI - PubMed

Publication types

MeSH terms