. 2020 Apr;412(10):2277-2289.
doi: 10.1007/s00216-019-02290-3. Epub 2019 Dec 26.

Evaluation of lipid coverage and high spatial resolution MALDI-imaging capabilities of oversampling combined with laser post-ionisation

Affiliations

Evaluation of lipid coverage and high spatial resolution MALDI-imaging capabilities of oversampling combined with laser post-ionisation

Andrew P Bowman et al. Anal Bioanal Chem. 2020 Apr.

Abstract

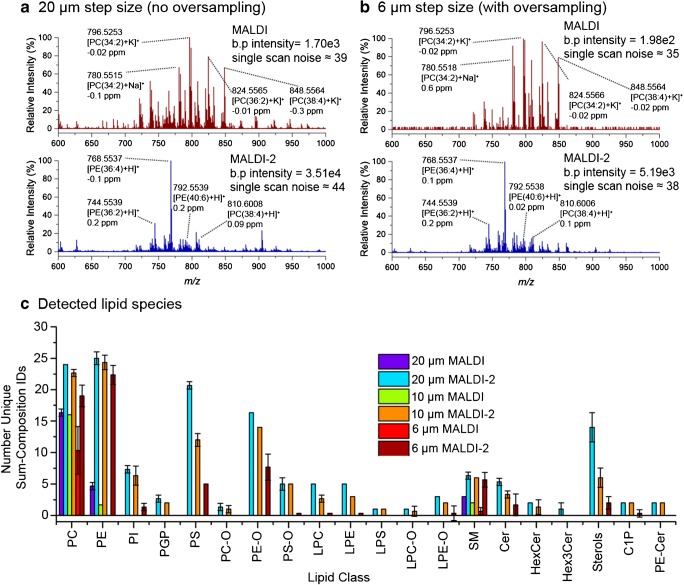
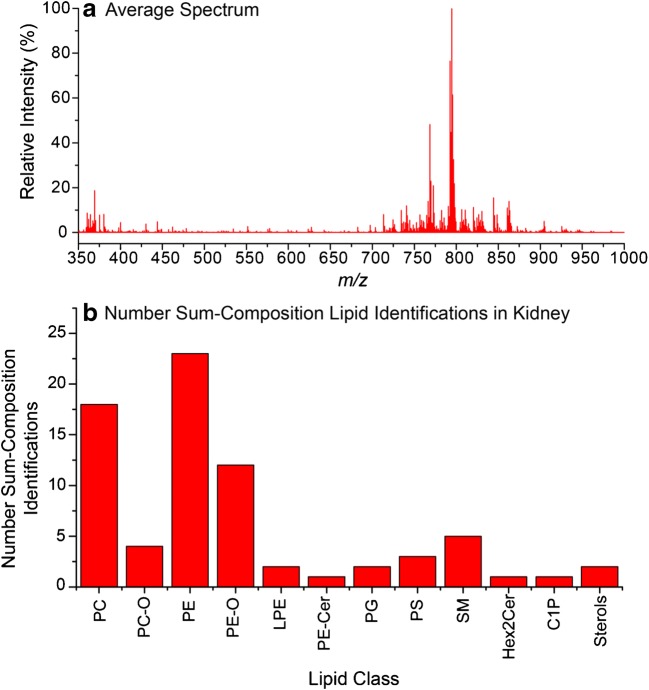
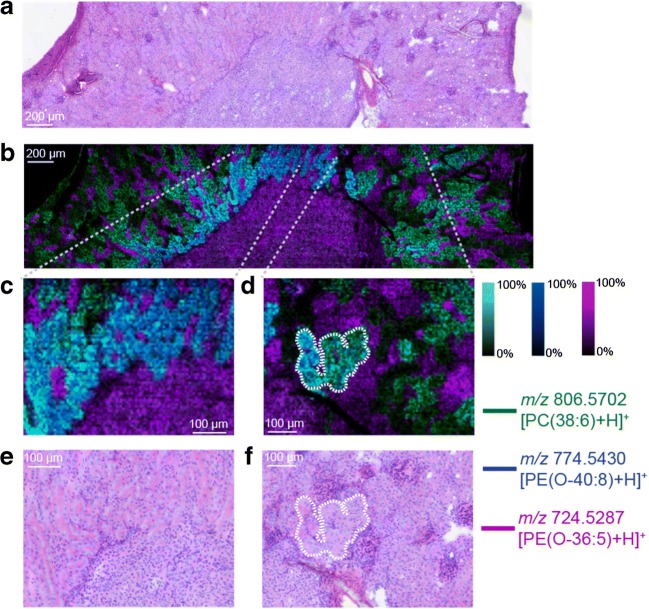
Matrix-assisted laser desorption/ionisation-mass spectrometry imaging (MALDI-MSI) is a powerful technique for visualising the spatial locations of lipids in biological tissues. However, a major challenge in interpreting the biological significance of local lipid compositions and distributions detected using MALDI-MSI is the difficulty in associating spectra with cellular lipid metabolism within the tissue. By-and-large this is due to the typically limited spatial resolution of MALDI-MSI (30-100 μm) meaning individual spectra represent the average spectrum acquired from multiple adjacent cells, each potentially possessing a unique lipid composition and biological function. The use of oversampling is one promising approach to decrease the sampling area and improve the spatial resolution in MALDI-MSI, but it can suffer from a dramatically decreased sensitivity. In this work we overcome these challenges through the coupling of oversampling MALDI-MSI with laser post-ionisation (MALDI-2). We demonstrate the ability to acquire rich lipid spectra from pixels as small as 6 μm, equivalent to or smaller than the size of typical mammalian cells. Coupled with an approach for automated lipid identification, it is shown that MALDI-2 combined with oversampling at 6 μm pixel size can detect up to three times more lipids and many more lipid classes than even conventional MALDI at 20 μm resolution in the positive-ion mode. Applying this to mouse kidney and human brain tissue containing active multiple sclerosis lesions, where 74 and 147 unique lipids are identified, respectively, the localisation of lipid signals to individual tubuli within the kidney and lipid droplets with lesion-specific macrophages is demonstrated. Graphical abstract.

Keywords: Brain; Kidney; Lipids; MALDI; Mass spectrometry imaging; Multiple sclerosis.


Conflict of interest statement

Mikhail Belov is the general manager of Spectroglyph LLC, the supplier of the dual-funnel MALDI/ESI Injector™ interface. The remaining authors declare no conflict of interest.

Figures

None
Graphical abstract
Fig. 1
Fig. 1
MALDI (top, red trace) and MALDI-2 (bottom, blue trace) spectra acquired from rat liver tissue coated in DHB matrix using stage step sizes of a 20 μm (no oversampling) and b 6 μm (with oversampling). Each spectrum is the average of 10 consecutive scans. c The number of detected lipid species across different lipid classes observed using MALDI and MALDI-2 using 20, 10 and 6 μm line scans across liver tissue. Peaks used for identification had a detection frequency ≥ 50% across the line scans consisting of 75 pixels (equivalent to being detected in half or more individual scans). [M+K]+ ions were considered for MALDI identification and [M+H]+ ions considered for MALDI-2 identifications, with the exception for sterols which were identified in both cases as [M+H-H2O]+ ions. Error bars represent ± 1 standard deviation across three replicate line scans. b.p. = base peak
Fig. 2
Fig. 2
a Average spectrum acquired from mouse kidney tissue using MALDI-2 and a pixel size of 6 μm between m/z 350 and 1000. b Number of automatically identified lipid species from mouse kidney tissue. Lipids were identified as [M+H]+ ions ([M+H-H2O]+ for sterols) using an m/z tolerance of 2 ppm
Fig. 3
Fig. 3
a Optical image of the post-MSI H&E-stained tissue section. b Ion distribution images of [PC(38:6)+H]+ (green), [PE(O-40:8)]+ (blue) and [PE(O-36:5)+H]+ (pink) throughout mouse kidney tissue acquired using MALDI-2 and a pixel size of 6 μm. c, d Selected enlarged regions of the MSI data. The corresponding H&E images of these enlarged regions are shown in e and f. All MSI data is visualised using total ion current normalisation and hotspot removal (99% quantile)
Fig. 4
Fig. 4
Ion distribution images of m/z 794.6211 ([coenzyme Q9]+•, blue) and m/z 430.3808 ([vitamin E]+•, red) throughout mouse kidney tissue. The corresponding MALDI-2 mass spectrum showing the detection of both the oxidised and reduced forms of coenzyme Q9 and coenzyme Q10 is shown below
Fig. 5
Fig. 5
a Average spectrum acquired from human multiple sclerosis brain tissue using MALDI-2 and a pixel size of 6 μm between m/z 350 and 2000. b Number of automatically identified lipid species from human multiple sclerosis brain tissue. Lipids were identified as [M+H]+ ions ([M+H-H2O]+ for sterols and [M+K]+ for cholesterol esters) using an m/z tolerance of 2 ppm
Fig. 6
Fig. 6
a CD68 (macrophages, purple) and Bodipy (myelin/neutral lipids, green) immunostaining and b Oil Red O staining of human brain tissue slices acquired from the same patient used to collect the MSI data shown in ce with several tissue regions indicated. c Ion distributions images of m/z 689.5636 ([CE(18:1)+K]+, green), m/z 726.5882 ([HexCer(d36:2)+H]+, blue) and m/z 369.3517 ([Chol+H-H2O]+, pink) acquired using MALDI-2 and a pixel size of 6 μm from human multiple sclerosis brain tissue. d, e Selected enlarged regions of the MSI data shown in c. fi Single pixel spectra acquired from the regions indicated by the white arrows in c. All MSI data is visualised using the total ion current normalisation and hotspot removal (99% quantile). NAWM = normal appearing white matter

References

    1. Bowman AP, Heeren RMA, Ellis SR. Advances in mass spectrometry imaging enabling observation of localised lipid biochemistry within tissues. TrAC, Trends Anal Chem:in press,. 2018. 10.1016/j.trac.2018.1007.1012.
    1. Gode D, Volmer DA. Lipid imaging by mass spectrometry—a review. Analyst. 2013;138(5):1289–1315. doi: 10.1039/c2an36337b. - DOI - PubMed
    1. Murphy RC, Hankin JA, Barkley RM. Imaging of lipid species by MALDI mass spectrometry. J Lipid Res. 2009;50:S217–S322. doi: 10.1194/jlr.R800051-JLR200. - DOI - PMC - PubMed
    1. Guo S, Wang Y, Zhou D, Li Z. Significantly increased monounsaturated lipids relative to polyunsaturated lipids in six types of cancer microenvironment are observed by mass spectrometry imaging. Sci Rep. 2014;4:5959. doi: 10.1038/srep05959. - DOI - PMC - PubMed
    1. Paine MRL, Liu J, Huang D, Ellis SR, Trede D, Kobarg JH, Heeren RMA, Fernández FM, MacDonald TJ. Three-dimensional mass spectrometry imaging identifies lipid markers of medulloblastoma metastasis. Sci Rep. 2019;9(1):2205. doi: 10.1038/s41598-018-38257-0. - DOI - PMC - PubMed

Publication types

LinkOut - more resources