. 2020 Sep;72(3):982-996.
doi: 10.1002/hep.31094. Epub 2020 Sep 10.

Modulation of Biliary Cancer Chemo-Resistance Through MicroRNA-Mediated Rewiring of the Expansion of CD133+ Cells

Affiliations

Modulation of Biliary Cancer Chemo-Resistance Through MicroRNA-Mediated Rewiring of the Expansion of CD133+ Cells

Pietro Carotenuto et al. Hepatology. 2020 Sep.

Abstract

Background and aims: Changes in single microRNA (miRNA) expression have been associated with chemo-resistance in biliary tract cancers (BTCs). However, a global assessment of the dynamic role of the microRNome has never been performed to identify potential therapeutic targets that are functionally relevant in the BTC cell response to chemotherapy.

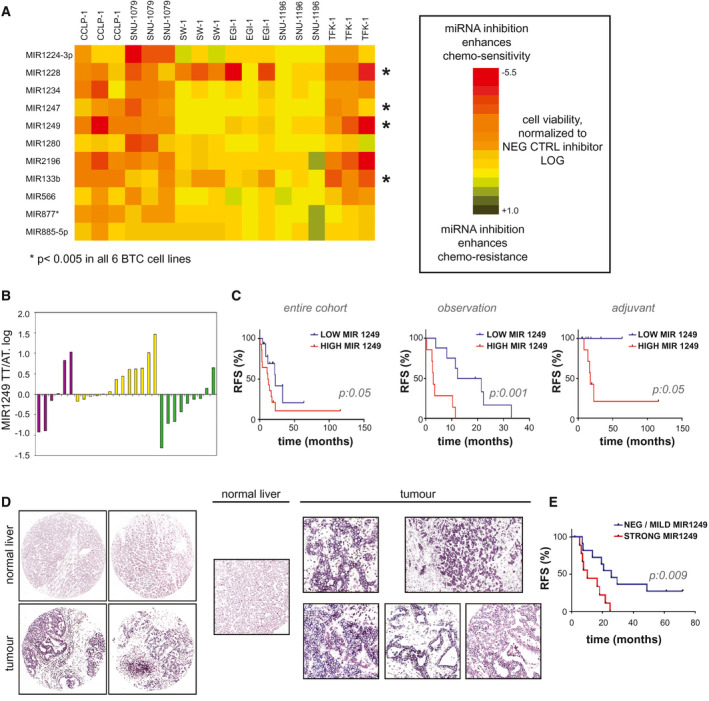
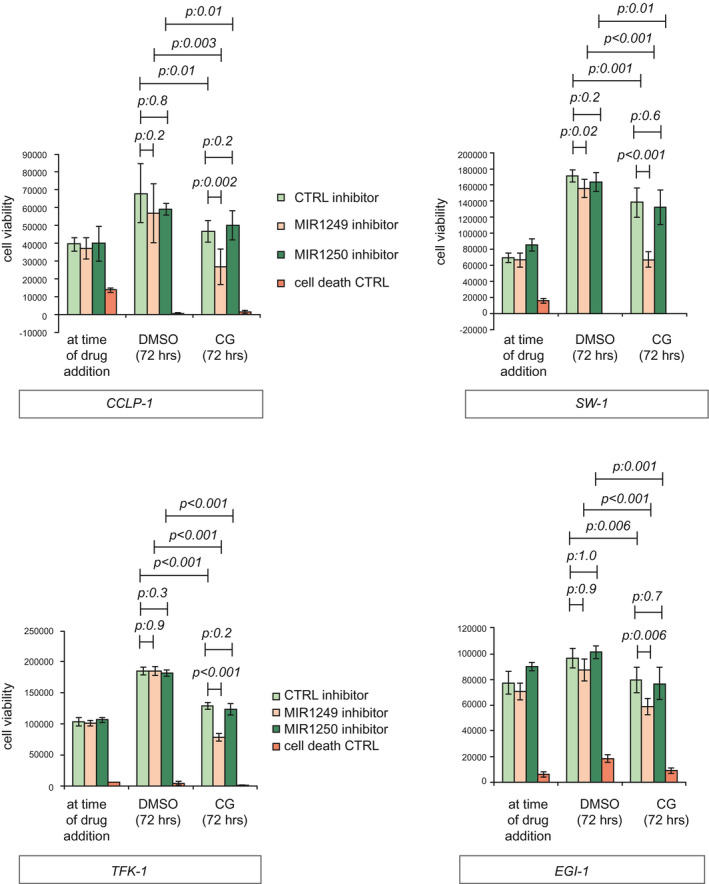
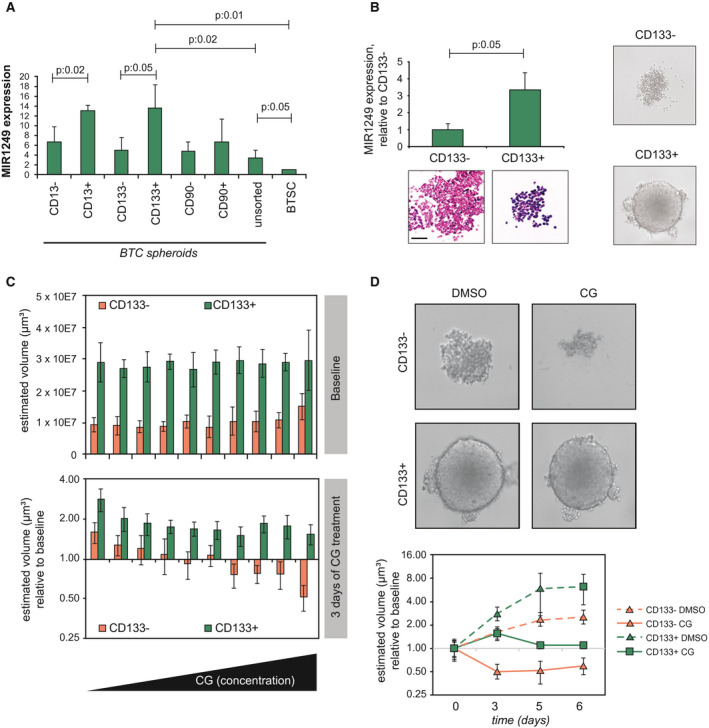
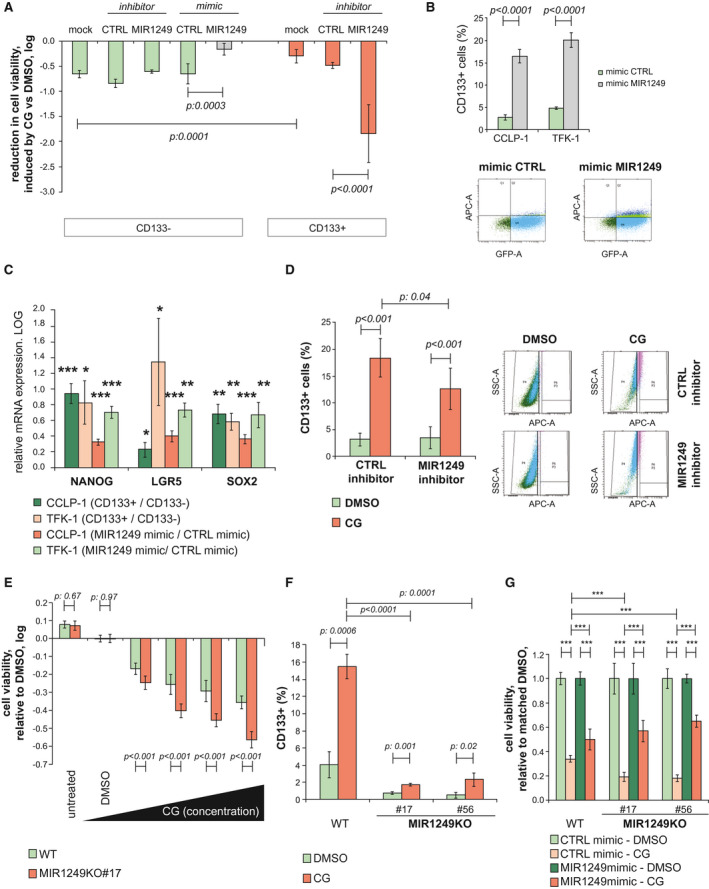
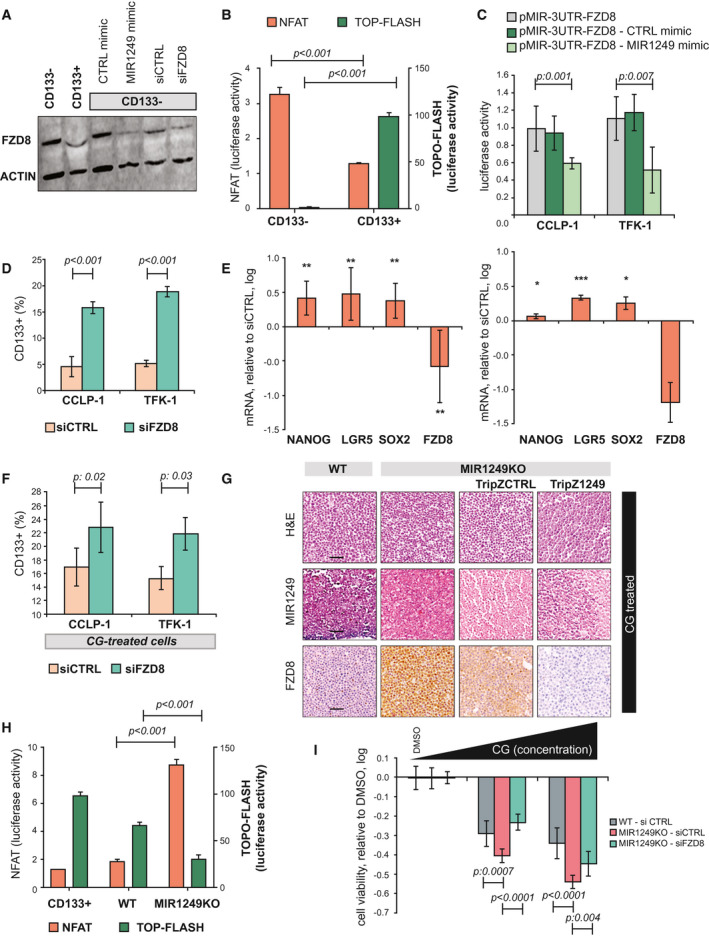
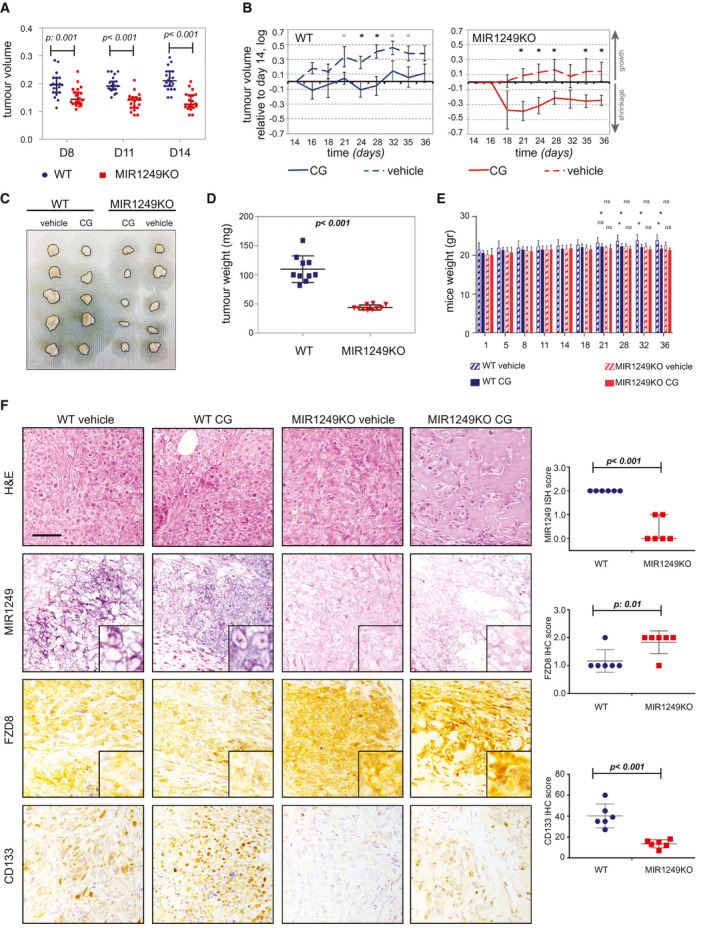
Approach and results: High-throughput screening (HTS) of 997 locked nucleic acid miRNA inhibitors was performed in six cholangiocarcinoma cell lines treated with cisplatin and gemcitabine (CG) seeking changes in cell viability. Validation experiments were performed with mirVana probes. MicroRNA and gene expression was assessed by TaqMan assay, RNA-sequencing, and in situ hybridization in four independent cohorts of human BTCs. Knockout of microRNA was achieved by CRISPR-CAS9 in CCLP cells (MIR1249KO) and tested for effects on chemotherapy sensitivity in vitro and in vivo. HTS revealed that MIR1249 inhibition enhanced chemotherapy sensitivity across all cell lines. MIR1249 expression was increased in 41% of cases in human BTCs. In validation experiments, MIR1249 inhibition did not alter cell viability in untreated or dimethyl sulfoxide-treated cells; however, it did increase the CG effect. MIR1249 expression was increased in CD133+ biliary cancer cells freshly isolated from the stem cell niche of human BTCs as well as in CD133+ chemo-resistant CCLP cells. MIR1249 modulated the chemotherapy-induced enrichment of CD133+ cells by controlling their clonal expansion through the Wnt-regulator FZD8. MIR1249KO cells had impaired expansion of the CD133+ subclone and its enrichment after chemotherapy, reduced expression of cancer stem cell markers, and increased chemosensitivity. MIR1249KO xenograft BTC models showed tumor shrinkage after exposure to weekly CG, whereas wild-type models showed only stable disease over treatment.

Conclusions: MIR1249 mediates resistance to CG in BTCs and may be tested as a target for therapeutics.


Figures

Figure 1
Figure 1
MIR1249 represents a clinically significant candidate for therapeutics based on in vitro HTS data and expression profiles of human BTC samples. (A) HTS technologies were applied to six cell lines in triplicate. Cells were reverse‐transfected with LNA miRNA inhibitors for 48 hours, followed by treatment with CG chemotherapy (see also Supporting Fig. S1). After 72 hours, cell viability was assessed by Cell‐Titer blue assay. Each square indicates the logarithmic value of the mean of cell viability normalized to averaged negative controls (n = 3), and the color code indicates the degree of change in cell viability. Here we show miRNA inhibitors that were significant (P < 0.05) in enhancing chemo‐sensitivity across all intrahepatic CCA or across all extrahepatic CCA (P < 0.05). *MicroRNA inhibitors that were significant across all six cell lines (see also Supporting Table S1). (B) MIR1249 expression was assessed by TaqMan assay in the tumor tissue (TT) and adjacent tissue (AT) of 29 human clinically annotated BTC samples (cohort 1) (see also Supporting Table S2). Insufficient RNA quality was achieved for the adjacent tissue of one case; thus, the data for 28 cases are shown. Bars represent the mean values of two technical replicates for each patient. Purple, yellow, and green bars indicate intrahepatic CCA, extrahepatic CCA and gallbladder cancer, respectively. (C) Kaplan‐Meier analysis was used to correlate relapse‐free survival with MIR1249 tumor tissue expression. Cases were classified into low and high MIR1249 expression according to the median value. (D) MIR1249 expression was assessed by ISH in 28 formalin‐fixed paraffin‐embedded human BTC tissues (cohort 2). Representative pictures are shown (see also Supporting Table S3). Original magnifications: ×10 (left) and 20 (right). (E) Kaplan‐Meier curves in cohort 2 with respect to MIR1249 expression (strong: ISH score 2+ or greater; negative/mild: ISH score 0 or 1+). Abbreviations: AT, adjacent tissue; RFS, relapse‐free survival; TT, tumor tissue.
Figure 2
Figure 2
MIR1249 inhibition decreases cell viability in chemotherapy‐treated cells only. MIR1249 inhibition was achieved using mirVana inhibitory probes (Thermo Fisher Scientific). Cells were plated in 96‐well plates and transfected with the indicated probes for 48 hours before being treated with DMSO or CG for a further 72 hours. Cell death CTRL was used as a positive control. Cell viability was assessed by CellTiter Blue assay (Promega, Madison, WI). Bars indicate the mean of six independent experiments ± SD.
Figure 3
Figure 3
Human CD133+ BTC cells hold high MIR1249 levels and are highly chemo‐resistant. (A) CSC niche of human BTC samples was identified. Cells were then extracted, sorted by cell surface markers, and cultured in 3D spheroids. MIR1249 expression was assessed by TaqMan assay. Bars indicate three independent replicates ± SD. (B) CCLP‐1 cells were sorted by FACS for CD133 surface expression. MIR1249 was assessed both by TaqMan (bars indicate the mean of three independent experiments ± SD) and by ISH (representative pictures are shown; scale bar: 100 μM). (C) When cultured in ultralow attachment plates, CD133+ cells formed large and defined 3D spheroids conversely to CD133‐ cells. (C) CCLP‐1 cells were sorted for CD133 surface expression and cultured in ultralow attachment plates. After 5 days, baseline imaging of spheroids by Celigo showed reproducible spheroid formation across the plates, even though CD133‐ spheroids were smaller. After 3 days of CG treatment (scalar concentrations up to 3 μM cisplatin and 30 nM gemcitabine), CD133‐ spheroids shrank in volume, whereas CD133+ spheroids did not, even at the highest CG concentration. Bars represent the mean of six replicates ± SD. (D) Representative pictures of spheroids with and without CG treatment. Spheroids were monitored up to 6 days. The volume of CD133‐ spheroids decreased from baseline, whereas the volume of CD133+ spheroids was stabilized (see also Supporting Fig. S2). Abbreviation: BTSC, biliary tract stem cells.
Figure 4
Figure 4
MIR1249 inhibition prevents chemotherapy‐induced enrichment of the CD133+ subclone. (A) CCLP‐1 cells were transfected with indicated probes after being sorted for CD133 surface expression. Mock indicates the absence of any probe. Chemotherapy was added 48 hours after transfection, and cell viability was read 72 hours later by CellTiter Blue assay. Bars indicate the mean of six independent experiments ± SD. (B) BTC cells were transfected and assessed for CD133+ by fluorescence‐activated cell sorting (FACS). The population of CD133+ cells increased with enforced expression of MIR1249. Bars indicate the mean of three independent experiments ± SD. Representative pictures of the FACS analysis are shown; CD133+ cells are identified by the double positivity of allophycocyanin axis and green fluorescent protein axis (right upper quadrant). (C) BTC cells were sorted for CD133 and collected for RNA extraction. Bars represent the log value of the indicated ratio with the relative control (positive values above the x axis indicate an increase in expression versus relative control). All markers are increased in CD133+ (vs. CD133‐) cells and after transfection of unsorted cells with MIR1249 mimic (vs. mimic control). Bars indicate the mean of at least four independent replicates ± SEM. *P < 0.05; **P < 0.01; ***P < 0.001 versus relative control. (D) CCLP‐1 cells were treated with DMSO or CG chemotherapy after transfection with CTRL or MIR1249 inhibitor and assessed for CD133+ by FACS. CG induced enrichment of CD133+ cells, and this enrichment was reduced in the case of transfection with MIR1249 inhibitor. Bars represent the mean of three independent experiments ± SD. Representative pictures of FACS analysis are shown on the right. Pink dots represent CD133+ cells. (E) WT and MIR1249KO CCLP‐1 cells were treated with DMSO and CG chemotherapy at scalar doses up to 5 M cisplatin and 50 nM gemcitabine. Bars represent the log of the ratio between CG‐treated and DMSO‐treated cells. Bars indicate the mean of six independent experiments ± SD. (F) WT and two clones of MIR1249KO cells were treated with DMSO and CG chemotherapy and assessed for CD133 expression by FACS. Bars represent the mean of three independent experiments ± SD. (G) Cells were transfected with CTRL mimic or MIR1249 mimic and treated with DMSO and CG chemotherapy. Bars represent the mean of six independent experiments ± SD. ***P < 0.001 (see also Supporting Fig. S3). Abbreviations: APC‐A, allophycocyanin axis; GFP‐A, green fluorescent protein axis; LGR5, leucine‐rich repeat‐containing G protein‐coupled receptor 5; SOX2, SRY (sex determining region Y)‐box 2.
Figure 5
Figure 5
MIR1249 activates the Wnt pathway by acting on FZD8. (A) CCLP‐1 cells were sorted for CD133 expression and processed for western blot analysis (left side). CD133‐ cells were also transfected with the indicated probes for 48 hours before proceeding to western blot (right side). (B) CCLP‐1 cells were sorted and transfected with nuclear factor of activated T cells (NFAT) and TOP‐Flash vector for 48 hours before luciferase activity was recorded. Bars indicate the mean of six independent experiments ± SD. Two‐way analysis of variance < 0.05. (C) BTC cells were transfected with pMIR‐3UTR‐FZD8 vector ± MIR1249 mimic, and the luciferase activity was recorded. Bars indicate the mean of six independent experiments ± SD. (D) BTC cells were transfected for 48 hours, and positivity for CD133 was assessed by FACS. Bars represent the mean of three independent experiments ± SD. (E) CCLP‐1 (left) and TFK‐1 (right) cells were transfected with small interfering FZD8 or small interfering CTRL for 48 hours and collected for mRNA expression by TaqMan assay. Bars represent the log value of the ratio between siFZD8 and siCTRL. Bars indicate the mean of three independent experiments ± SD. *P < 0.05; **P < 0.01; ***P < 0.001. (F) CG‐treated BTC cells were transfected for 48 hours, and positivity for CD133 was assessed by FACS. Bars represent the mean of three independent experiments ± SD. (G) CCLP‐1 cells were infected with the indicated vectors and treated with CG chemotherapy before being fixed in formalin and embedded in paraffin for immunohistochemistry and ISH (see also Supporting Table S4). Scale bars: 100 μm. (H) Cells were transfected with NFAT or TOP‐Flash vectors, and luciferase activity was recorded after 48 hours. CD133+ cells were added as controls. Bars indicate the mean of three independent experiments ± SD. (I) CCLP‐1 cells were transfected for 48 hours and treated with DMSO or increasing doses of CG (up to 5 μM cisplatin and 50 nM gemcitabine). Bars represent the log value of the ratio between CG‐treated and DMSO‐treated cells. Bars indicate the mean of six independent experiments ± SD. Abbreviations: LGR5, leucine‐rich repeat‐containing G protein‐coupled receptor 5; siCTRL, small interfering CTRL; siFDZ8, small interfering FDZ8; SOX2, SRY (sex determining region Y)‐box 2.
Figure 6
Figure 6
Lack of MIR1249 increases sensitivity to chemotherapy in vivo. (A) WT or MIR1249KO CCLP‐1 cells were injected subcutaneously in the flank of NSG (nonobese diabetic scid gamma) mice (n = 20 each) and monitored for growth by caliper (see also Supporting Fig. S4). (B) At day 14, mice were randomized to be treated with a weekly combination of intraperitoneal gemcitabine (150 mg/kg) and cisplatin (2 mg/kg) or vehicle alone for 3 weeks before being sacrificed. Data are presented normalized to baseline pretreatment tumor size (day 14). Black * indicates P value < 0.05; gray * indicates P value between 0.05 and 0.085 (see also Supporting Table S5). (C) Representative pictures of five explanted tumors per group. (D) Explanted tumors of CG‐treated mice were weighted before being stored for analyses. Error bars indicate the mean with SEM. (E) Mice were weighted periodically over the course of treatment. Bars represent the mean of 10 mice ± SD. *P < 0.05. (F) Representative pictures of MIR1249 ISH staining and immunohistochemistry staining for the indicated proteins performed on the explanted tumors, along with quantitative analysis. Scale bars: 100 μM. Three mice per group were analyzed (for a total of 12), and CG‐treated and vehicle‐treated tumors were grouped to assess the differences between KO and WT. Abbreviations: H&E, hematoxylin and eosin; ns, not significant.

References

    1. Khan SA, Emadossadaty S, Ladep NG, Thomas HC, Elliott P, Taylor‐Robinson SD, et al. Rising trends in cholangiocarcinoma: is the ICD classification system misleading us? J Hepatol 2012;56:848‐85 4. - PubMed
    1. Bridgewater J, Galle PR, Khan SA, Llovet JM, Park JW, Patel T, et al. Guidelines for the diagnosis and management of intrahepatic cholangiocarcinoma. J Hepatol 2014;60:1268‐1289. - PubMed
    1. Marcano‐Bonilla L, Mohamed EA, Mounajjed T, Roberts LR. Biliary tract cancers: epidemiology, molecular pathogenesis and genetic risk associations. Chin Clin Oncol 2016;5:61. - PubMed
    1. Saha SK, Zhu AX, Fuchs CS, Brooks GA. Forty‐year trends in cholangiocarcinoma incidence in the U.S.: intrahepatic disease on the rise. Oncologist 2016;21:594‐599. - PMC - PubMed
    1. Valle J, Wasan H, Palmer DH, Cunningham D, Anthoney A, Maraveyas A, et al. Cisplatin plus gemcitabine versus gemcitabine for biliary tract cancer. N Engl J Med 2010;362:1273‐1281. - PubMed

Publication types

MeSH terms