. 2020 Mar;33(3):e4235.
doi: 10.1002/nbm.4235. Epub 2019 Dec 26.

On the magnetic field dependence of deuterium metabolic imaging

Affiliations

On the magnetic field dependence of deuterium metabolic imaging

Robin A de Graaf et al. NMR Biomed. 2020 Mar.

Abstract

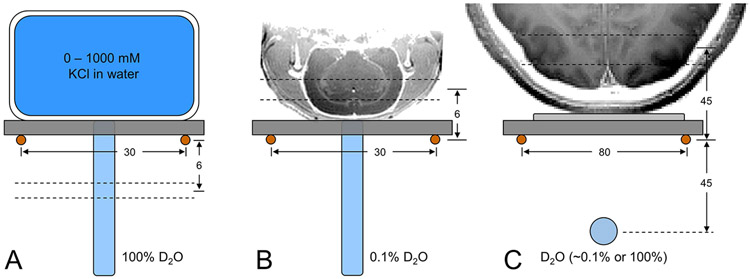
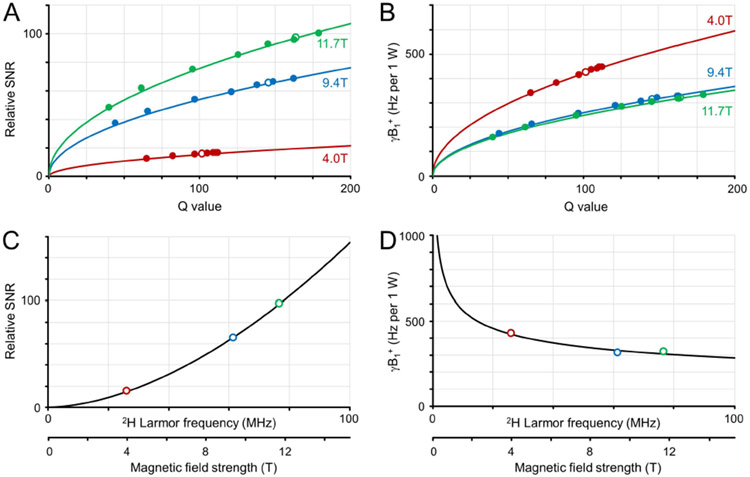
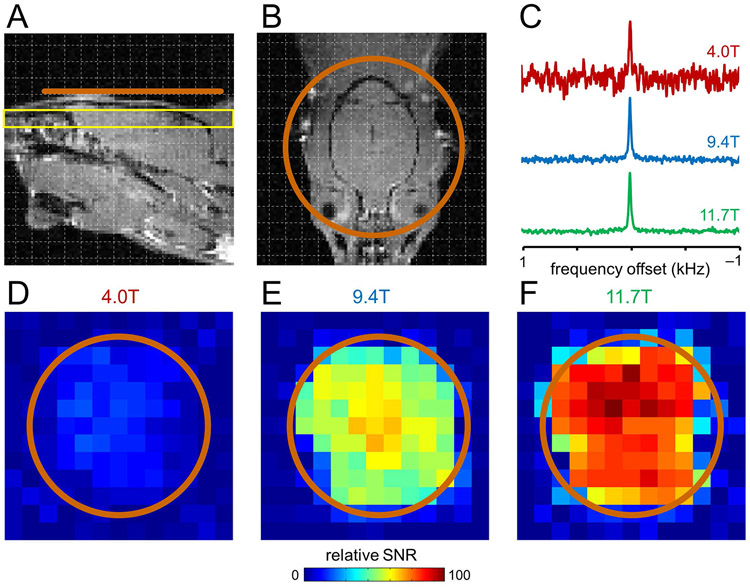
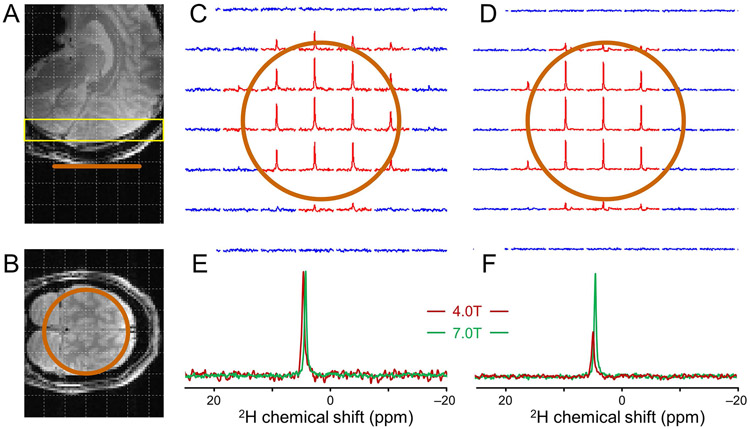
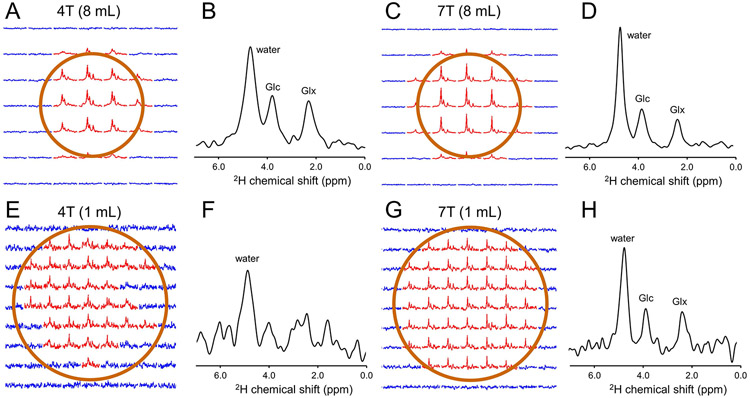
Deuterium metabolic imaging (DMI) is a novel MR-based method to spatially map metabolism of deuterated substrates such as [6,6'-2 H2 ]-glucose in vivo. Compared with traditional 13 C-MR-based metabolic studies, the MR sensitivity of DMI is high due to the larger 2 H magnetic moment and favorable T1 and T2 relaxation times. Here, the magnetic field dependence of DMI sensitivity and transmit efficiency is studied on phantoms and rat brain postmortem at 4, 9.4 and 11.7 T. The sensitivity and spectral resolution on human brain in vivo are investigated at 4 and 7 T before and after an oral dose of [6,6'-2 H2 ]-glucose. For small animal surface coils (Ø 30 mm), the experimentally measured sensitivity and transmit efficiency scale with the magnetic field to a power of +1.75 and -0.30, respectively. These are in excellent agreement with theoretical predictions made from the principle of reciprocity for a coil noise-dominant regime. For larger human surface coils (Ø 80 mm), the sensitivity scales as a +1.65 power. The spectral resolution increases linearly due to near-constant linewidths. With optimal multireceiver arrays the acquisition of DMI at a nominal 1 mL spatial resolution is feasible at 7 T.

Keywords: deuterium metabolic imaging; magnetic field dependence; resolution; sensitivity.


Figures

Figure 1:
Figure 1:
Experimental setups to characterize DMI (A) on phantoms in vitro, (B) on rat brain post mortem and (C) on human brain in vivo. Due to the lack of a 1H MRI coil, all images were acquired in a separate study and are shown for illustration purposes only. (A) Phantoms with (R3.9) different KCl concentrations are used to change sample conductivity, and hence achieve a range of coil loads in vitro, whereby signal is always acquired from a 2 mm slice 6 mm below the 2H RF coil. (B, C) On rat brain post mortem and human brain in vivo, signal is acquired in the form of 3D DMI whereby analysis is limited to the indicated slice position. On human brain a 100% D2O phantom was used for RF power calibration and then replaced with a 0.1% D2O phantom for position referencing during DMI. All distances are in mm.
Figure 2:
Figure 2:
Deuterium sensitivity and transmit efficiency on phantoms in vitro. (A) Relative SNR and (B) transmit field amplitude per 1 W input power as a function of RF coil Q value for a range of coil loads at 4 T (red), 9.4 T (green), 11. T (blue). The solid dots represent experimental data, whereas the solid line represents the best fit according to CQ1/2. The open dots represent the values for RF coil Q with a post mortem rat brain load. (C, D) Magnetic field dependence of (C) relative SNR and (D) transmit efficiency for rat brain postmortem. The solid (R3.10) lines represent the best fit according to CB0n.
Figure 3:
Figure 3:
DMI sensitivity on rat brain post mortem at 4 T, 9.4 T and 11.7 T. (A, B) Anatomical MRI showing the approximate surface coil position (copper, Ø 30 mm). Due to the lack of a 1H MRI coil, all images were acquired in a separate study and are shown for illustration purposes only. (C) Representative DMI spectra (27 μL) from 4 T (red), 9.4 T (green) and 11.7 T (blue) scaled to identical 2H natural abundance water peak heights. (D-F) Sensitivity maps of natural abundance water from the position shown in (A, yellow slice) at (D) 4 T, (E) 9.4 T and (F) 11.7 T.
Figure 4:
Figure 4:
DMI sensitivity on human brain in vivo at 4 T and 7 T. (A, B) Anatomical MRI showing the approximate surface coil position (copper, Ø 80 mm). (C, D) DMI maps of natural abundance water from the position shown in (A, yellow slice) at (C) 4 T and (D) 7 T (8 mL, 30 min). Only the inner 7x7 grid from a total 11x11x11 grid is shown. (E, F) Representative DMI spectra from 4 T (red) and 7 T (green) scaled for (E) equal peak height and (F) equal noise level.
Figure 5:
Figure 5:
DMI on human brain following oral administration of [6,6’-2H2]-glucose. (A, C) DMI and (B, D) representative spectra from (A) 4 T and (C) 7 T acquired 50-80 min after glucose administration at an 8 mL resolution. (E, G) DMI and (F, H) representative spectra from (E, F) 4 T and (G, H) 7 T acquired 85-115 min after glucose administration at a 1 mL resolution.
Figure 6:
Figure 6:
Experimental 2H and 13C MR sensitivities. Pulse-acquire (A) 2H and (B) 13C MR spectra obtained from a small phantom containing 1 M [1-2H] or 1 M [1-13C]-formate in the presence of a human head load at 4 T. In addition to the formate signal, the spectra contain natural abundance signals from water (A) or lipids (B). As the magnetic field homogeneity and nutation angle was optimized on the formate sphere, the natural abundance signals are generally broad and overrotated.

References

    1. De Feyter HM, Behar KL, Corbin ZA, Fulbright RK, Brown PB, McIntyre S, Nixon TW, Rothman DL, de Graaf RA. Deuterium metabolic imaging (DMI) for MRI-based 3D mapping of metabolism in vivo. Sci Adv 2018;4(8):eaat7314. - PMC - PubMed
    1. Rothman DL, De Feyter HM, de Graaf RA, Mason GF, Behar KL. 13C MRS studies of neuroenergetics and neurotransmitter cycling in humans. NMR Biomed 2011;24:943–957. - PMC - PubMed
    1. de Graaf RA, Rothman DL, Behar KL. State of the art direct 13C and indirect 1H-[13C] NMR spectroscopy in vivo. A practical guide. NMR Biomed 2011;24:958–972. - PMC - PubMed
    1. Nelson SJ, Kurhanewicz J, Vigneron DB, Larson PE, Harzstark AL, Ferrone M, van Criekinge M, Chang JW, Bok R, Park I, Reed G, Carvajal L, Small EJ, Munster P, Weinberg VK, Ardenkjaer-Larsen JH, Chen AP, Hurd RE, Odegardstuen LI, Robb FJ, Tropp J, Murray JA. Metabolic imaging of patients with prostate cancer using hyperpolarized [1-13C]pyruvate. Science translational medicine 2013;5:198ra108. - PMC - PubMed
    1. Cunningham CH, Lau JY, Chen AP, Geraghty BJ, Perks WJ, Roifman I, Wright GA, Connelly KA. Hyperpolarized 13C Metabolic MRI of the Human Heart: Initial Experience. Circ Res 2016;119(11):1177–1182. - PMC - PubMed

Publication types