. 2020 Feb;19(2):e13095.
doi: 10.1111/acel.13095. Epub 2019 Dec 26.

1,25-Dihydroxyvitamin D protects against age-related osteoporosis by a novel VDR-Ezh2-p16 signal axis

Affiliations

1,25-Dihydroxyvitamin D protects against age-related osteoporosis by a novel VDR-Ezh2-p16 signal axis

Renlei Yang et al. Aging Cell. 2020 Feb.

Abstract

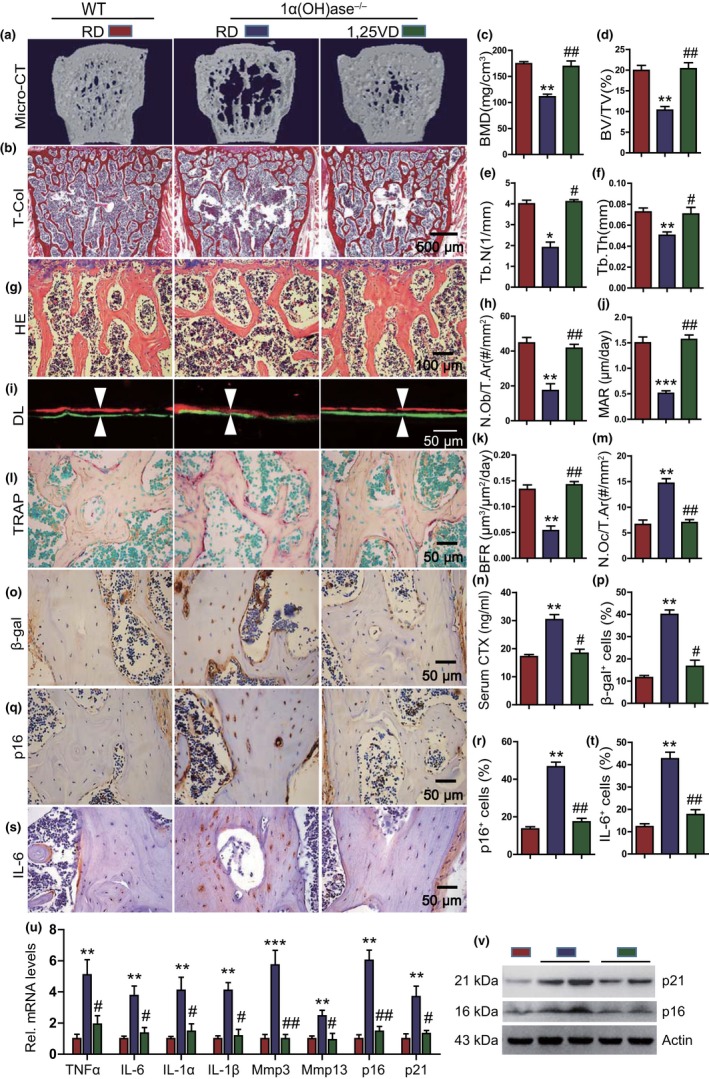
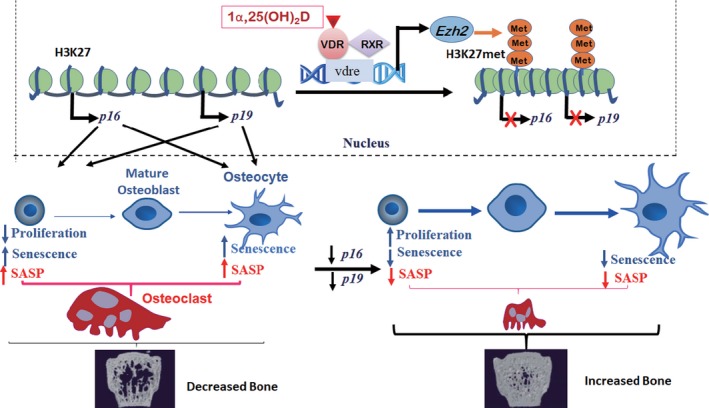
To determine whether 1,25-dihydroxyvitamin D (1,25(OH)2 D) can exert an anti-osteoporosis role through anti-aging mechanisms, we analyzed the bone phenotype of mice with 1,25(OH)2 D deficiency due to deletion of the enzyme, 25-hydroxyvitamin D 1α-hydroxylase, while on a rescue diet. 1,25(OH)2 D deficiency accelerated age-related bone loss by activating the p16/p19 senescence signaling pathway, inhibiting osteoblastic bone formation, and stimulating osteoclastic bone resorption, osteocyte senescence, and senescence-associated secretory phenotype (SASP). Supplementation of exogenous 1,25(OH)2 D3 corrected the osteoporotic phenotype caused by 1,25(OH)2 D deficiency or natural aging by inhibiting the p16/p19 pathway. The proliferation, osteogenic differentiation, and ectopic bone formation of bone marrow mesenchymal stem cells derived from mice with genetically induced deficiency of the vitamin D receptor (VDR) were significantly reduced by mechanisms including increased oxidative stress, DNA damage, and cellular senescence. We also demonstrated that p16 deletion largely rescued the osteoporotic phenotype caused by 1,25(OH)2 D3 deficiency, whereas 1,25(OH)2 D3 could up-regulate the enzyme Ezh2 via VDR-mediated transcription thereby enriching H3K27me3 and repressing p16/p19 transcription. Finally, we demonstrated that treatment with 1,25(OH)2 D3 improved the osteogenic defects of human BM-MSCs caused by repeated passages by stimulating their proliferation and inhibiting their senescence via the VDR-Ezh2-p16 axis. The results of this study therefore indicate that 1,25(OH)2 D3 plays a role in preventing age-related osteoporosis by up-regulating Ezh2 via VDR-mediated transcription, increasing H3K27me3 and repressing p16 transcription, thus promoting the proliferation and osteogenesis of BM-MSCs and inhibiting their senescence, while also stimulating osteoblastic bone formation, and inhibiting osteocyte senescence, SASP, and osteoclastic bone resorption.

Keywords: Ezh2; Vitamin D; cellular senescence; osteogenesis; osteoporosis; p16.


Conflict of interest statement

None declared.

Figures

Figure 1
Figure 1
1,25(OH)2D3 deficiency accelerates aging‐related bone loss. (a) Representative μCT scans of 3D longitudinal reconstructions and total collagen (T‐Col) staining of lumbar vertebrae from 3‐, 6‐, and 12‐month‐old wild‐type (WT) and 1ɑ(OH)ase−/− mice (KO) on a rescue diet (RD). Microtomography indices were measured as (b) bone mineral density (BMD), (c) trabecular bone volume (BV/TV, %), (d) trabecular number (Tb.N), and (e) trabecular thickness (Tb.Th). *, p < .05, **, p < .01, compared with age‐matched WT mice. #, p < .05, ##, p < .01, compared with 3‐month‐old genotype‐matched mice. &, p < .05, compared with 6‐month‐old genotype‐matched mice. (f) Representative micrographs of vertebral trabecular and cortical sections stained with H&E and (g) a quantitative analysis of the number of osteoblasts per tissue area (N.Ob/T.Ar, #/mm2). (h) Representative micrographs of calcein/xylenol orange (XO) dual‐labeling (DL), (i) mineral apposition rate (MAR), and (j) bone formation rate (BFR). (k) Representative micrographs of vertebral trabecular sections stained histochemically for TRAP and (l) a quantitative analysis of the number of osteoclasts per tissue area (N.Oc/T.Ar, #/mm2). (m) Serum c‐telopeptide of collagen (CTx) levels (ng/ml). Representative micrographs of vertebral cortical sections immunostained for (n) β‐gal, (p) p16, and (r) matrix metalloproteinase (Mmp) 3. Quantification for the percentages of (o) β‐gal+, (q) p16+, and (s) Mmp3+ osteocytes. (t) Western blots of bone extracts for the expression of p53, p21, p16, and p19. ß‐actin was used as a loading control for Western blots. (u) Lumbar vertebrae with bone marrow removed were subjected to RNA extraction, and the mRNA levels of SASP including TNF‐ɑ, IL‐6, IL‐1ɑ, IL‐1β, Mmp3, Mmp13, and p16 were analyzed using real‐time RT–PCR. *, p < .05, **, p < .01, ***, p < .001, compared with WT mice
Figure 2
Figure 2
Supplementation of 1,25(OH)2D3 significantly rescued aging‐related bone loss caused by 1,25(OH)2D deficiency. (a) Representative μCT images of lumbar vertebrae of 6‐month‐old WT mice on the rescue diet (RD), 1ɑ(OH)ase−/− mice on the RD or treated with 1,25(OH)2D3. (b) Representative micrographs of vertebral sections stained for total collagen (T‐Col). Microtomography indices were measured as (c) bone mineral density (BMD), (d) trabecular bone volume (BV/TV, %), (e) trabecular number (Tb.N), and (f) trabecular thickness (Tb.Th). (g) Representative micrographs of vertebral sections stained with H&E and (h) a quantitative analysis of the number of osteoblasts per tissue area (N.Ob/T.Ar, #/mm2). (i) Representative micrographs of calcein/xylenol orange (XO) dual‐labeling, (j) MAR, and (k) BFR. (l) Representative micrographs of vertebral trabecular sections stained histochemically for TRAP and (m) a quantitative analysis of the number of osteoclasts per tissue area (N.Oc/T.Ar, #/mm2). (n) Serum CTx levels (ng/ml). Representative micrographs of vertebral cortical sections immunostained for (o) β‐gal, (q) p16, and (s) IL‐6. Quantification for the percentages of (p) β‐gal+, (r) p16+, and (t) IL‐6+ osteocytes. (u) Lumbar vertebrae with bone marrow removed were subjected to RNA extraction, and the mRNA levels of SASP including TNF‐ɑ, IL‐6, IL‐1ɑ, IL‐1β, Mmp3, Mmp13, p16, and p19 were analyzed using real‐time RT–PCR. (v) Western blots of bone extracts for the expression of p16 and p21. ß‐actin was used as loading control for Western blots. *, p < .05, **, p < .01, ***, p < .001, compared with WT; #, p < .05, ##, p < .01, ###, p < .001, compared with 1ɑ(OH)ase−/− mice
Figure 3
Figure 3
Supplementation of exogenous 1,25(OH)2D3 prevents bone aging induced by natural aging. (a) Representative μCT images of lumbar vertebrae of 18‐month‐old WT mice which received thrice weekly subcutaneous injections of 1,25(OH)2D3 at a dose of 0.1 μg/kg or vehicle for 6 months. (b) Representative micrographs of vertebral sections stained for total collagen (T‐Col). Microtomography indices were measured as (c) bone mineral density (BMD), (d) trabecular bone volume (BV/TV, %), (e) trabecular number (Tb.N), and (f) trabecular thickness (Tb.Th). (g) Representative micrographs of vertebral sections stained with H&E and (h) a quantitative analysis of the number of osteoblasts per tissue area (N.Ob/T.Ar, #/mm2). (i) Representative micrographs of calcein/xylenol orange (XO) dual‐labeling, (j) MAR, and (k) BFR. (l) Representative micrographs of vertebral trabecular sections stained histochemically for TRAP and (m) a quantitative analysis of the number of osteoclasts per tissue area (N.Oc/T.Ar, #/mm2). Representative micrographs of vertebral cortical sections immunostained for (n) β‐gal, (p) p16, and (r) IL‐6. Quantification for the percentages of (o) β‐gal+, (q) p16+, and (s) IL‐6+ osteocytes. Ex vivo primary bone marrow cells cultured for 14 days from vehicle or 1,25(OH)2D3‐treated 18‐month‐old WT mice and stained with (t) methylene blue to show total CFU‐f and a quantitative analysis of CFU‐f numbers per well, or (u) cultured for 14 or 21 days and stained with xylenol orange (XO) followed by a quantitative analysis for the percentage of XO+ cells, or (v) cultured for 14 day for 5‐ethynyl‐2′‐deoxyuridine (EdU) incorporation (cell proliferation) or (x) stained cytochemically for senescence‐associated β‐gal (SA‐β‐gal); quantitative analysis for the percentage of (w) EdU+ cells and (y) SA‐β‐gal+ cells. (z) Western blots of bone extracts for the expression of p53, p19, and p16. ß‐actin was used as loading control for Western blots. *, p < .05, **, p < .01, ***, p < .001, compared with vehicle
Figure 4
Figure 4
VDR deficiency induces BM‐MSC senescence and inhibits osteogenesis. (a) Western blot of BM‐MSC extracts from young (3 months) and old (18 months) mice for expression of nuclear VDR and total VDR. Histone‐H3 was used as nucleoprotein loading control, whereas ß‐actin was used as total protein loading control for Western blots. (b) In vitro population doublings of BM‐MSCs from 6‐month‐old WT and VDR−/− mice. (c) Ex vivo primary bone marrow cultures from 3‐, 6‐ and 12‐month‐old WT mice stained with methylene blue to show total CFU‐f. (d) Quantification of the number of CFU‐F colonies. Representative micrographs of the second passaged BM‐MSCs from 6‐month‐old WT and VDR−/− mice (e) stained immunocytochemically for EdU, and (g) phase images, or (i) stained cytochemically for SA‐β‐gal to detect senescence, (k) with 2',7'‐dichlorofluorescin diacetate (DCFDA) for reactive oxygen species (ROS) and (m) stained immunocytochemically for γ‐H2AX as a marker of DNA damage. Quantification for (f) the percentages of EdU+ cells, (h) average cell area, the percentages of (j) SA‐β‐gal+, (l) DCFDA+, and (n) γ‐H2AX+ cells. (o) Representative micrographs of BM‐MSC cultures under osteogenic differentiation medium from 6‐month‐old WT and VDR−/− mice for 14 or 21 days stained with xylenol orange (XO) and (p) a quantitative analysis for the percentage of XO+ cells. (q) The BM‐MSCs from WT and VDR−/− mice were cultured with vehicle or 10−8M 1,25(OH)2D3 and were subcutaneously transplanted; after 6 weeks, transplants were harvested and stained with H&E (upper part of panel q) or Masson trichrome (bottom of panel q). (r) The analysis of bone volume based on H&E staining. *, p < .05, **, p < .01, compared with WT mice
Figure 5
Figure 5
1,25(OH)2D3 inhibits BM‐MSC senescence by VDR‐mediated transcriptional up‐regulation of Ezh2 and repression of p16/p19. (a) Western blots of the second passaged BM‐MSCs extracts from cultures treated with vehicle or 1,25(OH)2D3 for 3 days for the expression of p19 and p16. ß‐actin was used as loading control for Western blots. (b) p16 and p19 relative expression levels. (c) The Ezh2 and Ezh1 mRNA relative expression levels of in WT and VDR−/− BM‐MSCs. (d) The Ezh2 mRNA‐related expression levels following 1,25(OH)2D3 treatment for 12 hr. (e) Chromatin immunoprecipitation (ChIP)‐qPCR assays with H3K27me3 antibody or IgG antibody were performed using vehicle‐ and 1,25(OH)2D3‐treated BM‐MSCs. (f) VDR‐like elements in mouse Ezh2 promoter region and the mutated VDRE sequence highlighted in yellow (upper region of panel f); schematic structural diagram of pGL3‐Ezh2 promoter and mutant pGL3‐Ezh2 Luc reporter plasmid (lower region of panel f). (g) Analysis of VDR binding to Ezh2 promoter using ChIP. (h) Mouse Ezh2 promoter or Ezh2 promoter mutant Luc‐plasmid were transfected into BM‐MSCs following vehicle or 1,25(OH)2D3 treatment for 12 hr, and relative luciferase activity was analyzed after 48 hr. *, p < .05, **, p < .01, compared with BM‐MSCs treated with vehicle. (i) VDR−/− BM‐MSCs were transfected with lenti‐control or lenti‐Ezh2, and the protein expression levels for Ezh2 and p16 were detected using Western blots. (j) Senescent VDR−/− BM‐MSCs were decreased following Ezh2 overexpression detected by SA‐βgal staining. (k) The protein expression levels of p16 and p19 in BM‐MSCs treated with vehicle or the Ezh2 inhibitor, GSK126, in the presence or absence of 1,25(OH)2D3. (l) p16 mRNA levels and (m) SA‐βgal+ cells in vehicle‐ or GSK126‐treated BM‐MSCs in the presence or absence of 1,25(OH)2D3. *, p < .05, compared with BM‐MSCs treated with vehicle
Figure 6
Figure 6
Deletion of p16 largely rescues bone aging phenotypes induced by 1,25(OH)2D deficiency. (a) Serum calcium and phosphorus levels and (b) survival rate of WT, p16−/−, 1ɑ(OH)ase−/−, and 1ɑ(OH)ase−/−p16−/− mice on the RD. (c) Representative μCT images of lumbar vertebrae of genetically modified mice. (d) Representative micrographs of vertebral sections stained for total collagen (T‐Col). (e) Bone mineral density (BMD) and (f) trabecular bone volume (BV/TV, %). (g) Representative micrographs of vertebral sections stained with H&E and (h) a quantitative analysis of the number of osteoblasts per tissue area (N.Ob/T.Ar, #/mm2). (i) Representative micrographs of calcein/xylenol orange (XO) dual‐labeling, (j) MAR, and (k) BFR. (l) Representative micrographs of vertebral trabecular sections stained histochemically for TRAP and (m) a quantitative analysis of the number of osteoclasts per tissue area (N.Oc/T.Ar, #/mm2). Representative micrographs of vertebral cortical sections immunostained for (n) β‐gal, (o) p16, and (p) IL‐6. Quantification for the percentages of (q) β‐gal+, (r) p16+, and (s) IL‐6+ osteocytes. *, p < .05, **, p < .01, ***, p < .001, compared to WT mice. #, p < .05, ##, p < .01, compared to 1ɑ(OH)ase−/− mice
Figure 7
Figure 7
1,25(OH)2D3 reduces cellular senescence and promotes ectopic bone formation of human BM‐MSCs. (a) Representative micrographs of early (4th) and late (12th) passaged human BM‐MSC cultured for 21 days in osteogenic differentiation medium and stained with xylenol orange (XO) to quantify the percentage of XO+ area and (b) were subcutaneously transplanted, After 6 weeks, transplants were harvested and stained with HE (upper part of panel b) or Masson trichrome (bottom part of panel b). (c) The analysis of bone volume based on H&E staining. (d) Western blot of BM‐MSC extracts from the cultures as (a) for expression of nuclear VDR and total VDR, and for Ezh2 and p16 protein levels. Histone‐H3 was used as nucleoprotein loading control, whereas ß‐actin was used as total protein loading control for Western blots. Representative micrographs of the 4th and 12th passaged BM‐MSCs as (a) stained with (e) H&E, (f) immunocytochemically for EdU, and (g) cytochemically for SA‐β‐gal. Quantification for (h) average cell area, the percentages of (i) EdU+, and (j) SA‐β‐gal+ cells. (k) Human BM‐MSCs pretreated with vehicle or 1,25(OH)2D3 and were subcutaneously transplanted into recipient SCID mice. 6 weeks later, the implants were collected and prepared sections were stained (l) with XO, (m) H&E, and (n) Masson trichrome. Green arrows indicate osteoblasts, and red arrows indicate osteocytes. Bone histomorphometric analysis of (o) mineralization (XO+ area, %) and (p) bone volume. *, p < .05, **, p < .01, ***, p < .001, compared to the 4th passaged or vehicle‐treated human BM‐MSCs
Figure 8
Figure 8
Model of mechanisms used by 1,25(OH)2D to protect against age‐related osteoporosis via the VDR‐Ezh2‐p16 signaling axis. 1,25(OH)2D binds to the VDR, and the VDR‐RXR heterodimer then binds to the VDRE on Ezh2 up‐regulating Ezh2 and increasing H3K27met. This results in repression of p16/p19 transcription, thus promoting the proliferation of bone marrow MSCs and inhibiting their senescence and SASP production. Senescence and SASP production of osteocytes is also inhibited. As a consequence, osteoblastic bone formation is stimulated, and osteoclastic bone resorption is inhibited. Bone quantity and microarchitecture are thus improved as shown by the μCT images

References

    1. Aguilo, F. , Zhou, M. M. , & Walsh, M. J. (2011). Long noncoding RNA, polycomb, and the ghosts haunting INK4b‐ARF‐INK4a expression. Cancer Research, 71(16), 5365–5369. 10.1158/0008-5472.can-10-4379 - DOI - PMC - PubMed
    1. Baker, D. J. , Childs, B. G. , Durik, M. , Wijers, M. E. , Sieben, C. J. , Zhong, J. , … van Deursen, J. M. (2016). Naturally occurring p16(Ink4a)‐positive cells shorten healthy lifespan. Nature, 530(7589), 184–189. 10.1038/nature16932 - DOI - PMC - PubMed
    1. Baker, D. J. , Perez‐Terzic, C. , Jin, F. , Pitel, K. S. , Niederlander, N. J. , Jeganathan, K. , … van Deursen, J. M. (2008). Opposing roles for p16Ink4a and p19Arf in senescence and ageing caused by BubR1 insufficiency. Nature Cell Biology, 10(7), 825–836. 10.1038/ncb1744 - DOI - PMC - PubMed
    1. Baker, D. J. , Wijshake, T. , Tchkonia, T. , LeBrasseur, N. K. , Childs, B. G. , van de Sluis, B. , … van Deursen, J. M. (2011). Clearance of p16Ink4a‐positive senescent cells delays ageing‐associated disorders. Nature, 479(7372), 232–236. 10.1038/nature10600 - DOI - PMC - PubMed
    1. Bao, B. Y. , Ting, H. J. , Hsu, J. W. , & Lee, Y. F. (2008). Protective role of 1 alpha, 25‐dihydroxyvitamin D3 against oxidative stress in nonmalignant human prostate epithelial cells. International Journal of Cancer, 122(12), 2699–2706. 10.1002/ijc.23460 - DOI - PubMed

Publication types

MeSH terms

LinkOut - more resources