

A Spectral Approach to Model-Based Noninvasive Intracranial Pressure Estimation
- PMID: 31880569
- PMCID: PMC10615348
- DOI: 10.1109/JBHI.2019.2961403
A Spectral Approach to Model-Based Noninvasive Intracranial Pressure Estimation
Abstract
Background: Intracranial pressure (ICP) normally ranges from 5 to 15 mmHg. Elevation in ICP is an important clinical indicator of neurological injury, and ICP is therefore monitored routinely in several neurological conditions to guide diagnosis and treatment decisions. Current measurement modalities for ICP monitoring are highly invasive, largely limiting the measurement to critically ill patients. An accurate noninvasive method to estimate ICP would dramatically expand the pool of patients that could benefit from this cranial vital sign.
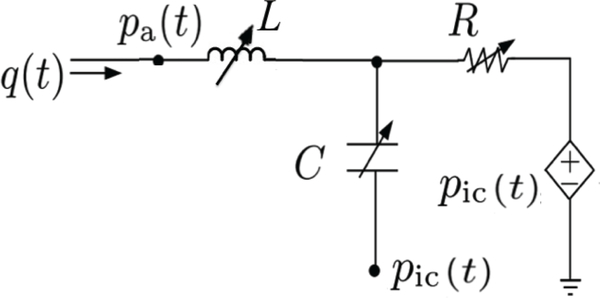
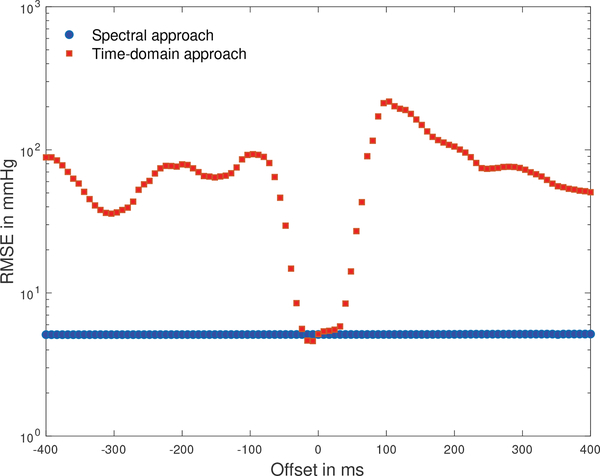
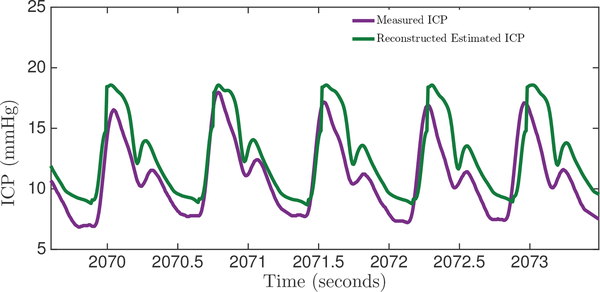
Methods: This article presents a spectral approach to model-based ICP estimation from arterial blood pressure (ABP) and cerebral blood flow velocity (CBFV) measurements. The model captures the relationship between the ABP, CBFV, and ICP waveforms and utilizes a second-order model of the cerebral vasculature to estimate ICP.
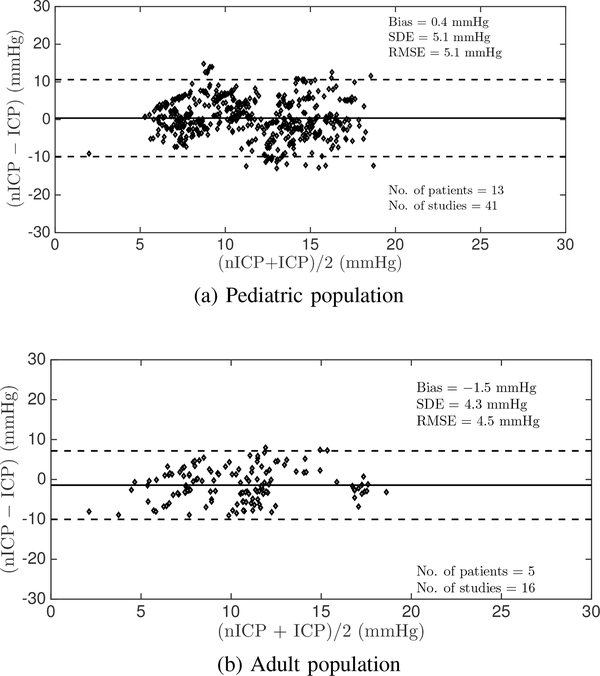
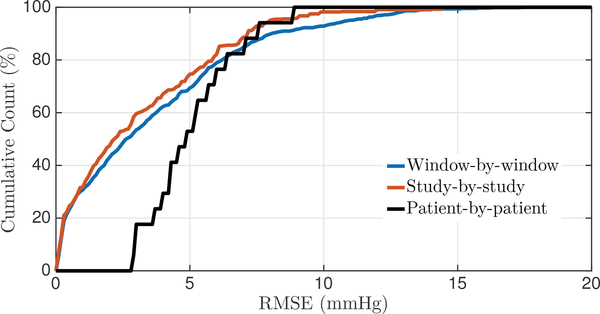
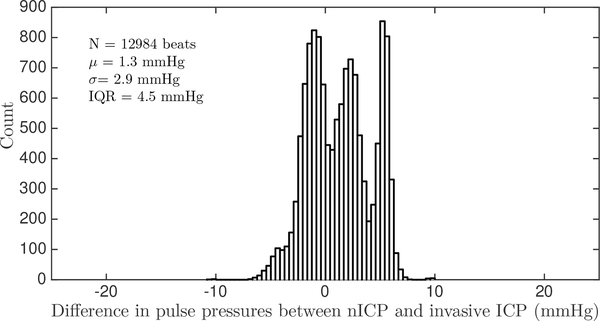
Results: The estimation approach was validated on two separate clinical datasets, one recorded from thirteen pediatric patients with a total duration of around seven hours, and the other recorded from five adult patients, one hour and 48 minutes in total duration. The algorithm was shown to have an accuracy (mean error) of 0.4 mmHg and -1.5 mmHg, and a precision (standard deviation of the error) of 5.1 mmHg and 4.3 mmHg, in estimating mean ICP (range of 1.3 mmHg to 24.8 mmHg) on the pediatric and adult data, respectively. These results are comparable to previous results and within the clinically relevant range. Additionally, the accuracy and precision in estimating the pulse pressure of ICP on a beat-by-beat basis were found to be 1.3 mmHg and 2.9 mmHg respectively.
Conclusion: These contributions take a step towards realizing the goal of implementing a real-time noninvasive ICP estimation modality in a clinical setting, to enable accurate clinical-decision making while overcoming the drawbacks of the invasive ICP modalities.
Figures
References
-
- Gooch CL, Pracht E, and Borenstein A, “The burden of neurological disease in the United States: A summary report and call to action.” Annals of Neurology, vol. 81, pp. 479–484, 2017. - PubMed
-
- Faul M, Xu L, Wald M, and Coronado V, “Traumatic brain injury in the United States: Emergency department visits, hospitalizations and deaths 2002–2006.” Atlanta (GA): Centers for Disease Control and Prevention, National Center for Injury Prevention and Control, 2010.
-
- Benjamin EJ et al., “Heart disease and stroke statistics - 2018 update: A report from the American Heart Association.” Circulation, vol. 137, pp. 67–492, 2018. - PubMed
-
- American Brain Tumor Association. [Online]. Available: http://www.abta.org/about-us/news/brain-tumor-statistics/
