. 2020 May;226(3):770-784.
doi: 10.1111/nph.16398. Epub 2020 Feb 3.

Tenuazonic acid from Stemphylium loti inhibits the plant plasma membrane H+ -ATPase by a mechanism involving the C-terminal regulatory domain

Affiliations

Tenuazonic acid from Stemphylium loti inhibits the plant plasma membrane H+ -ATPase by a mechanism involving the C-terminal regulatory domain

Peter K Bjørk et al. New Phytol. 2020 May.

Abstract

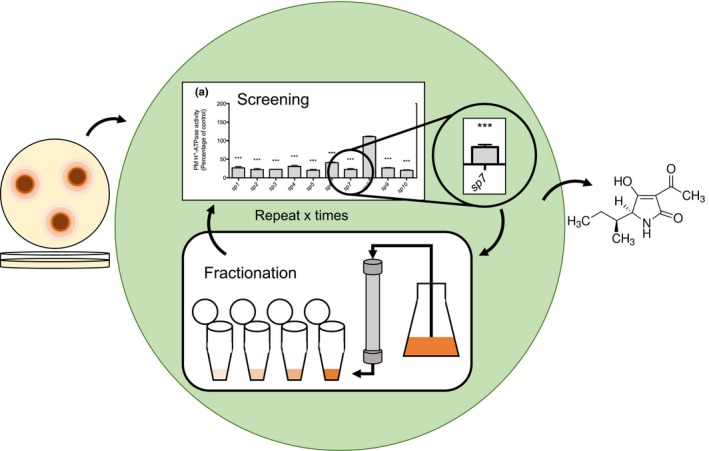
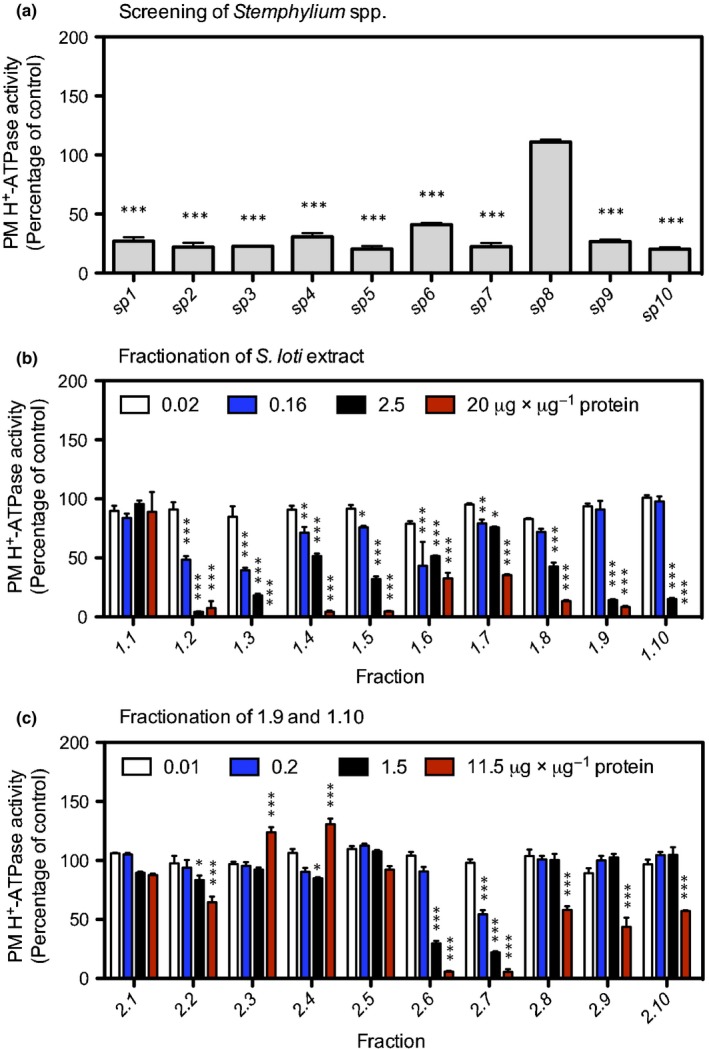
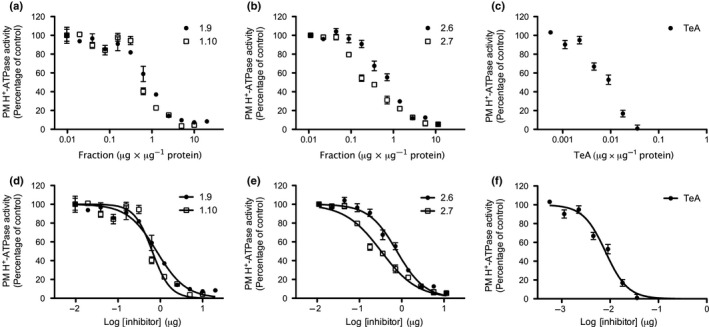
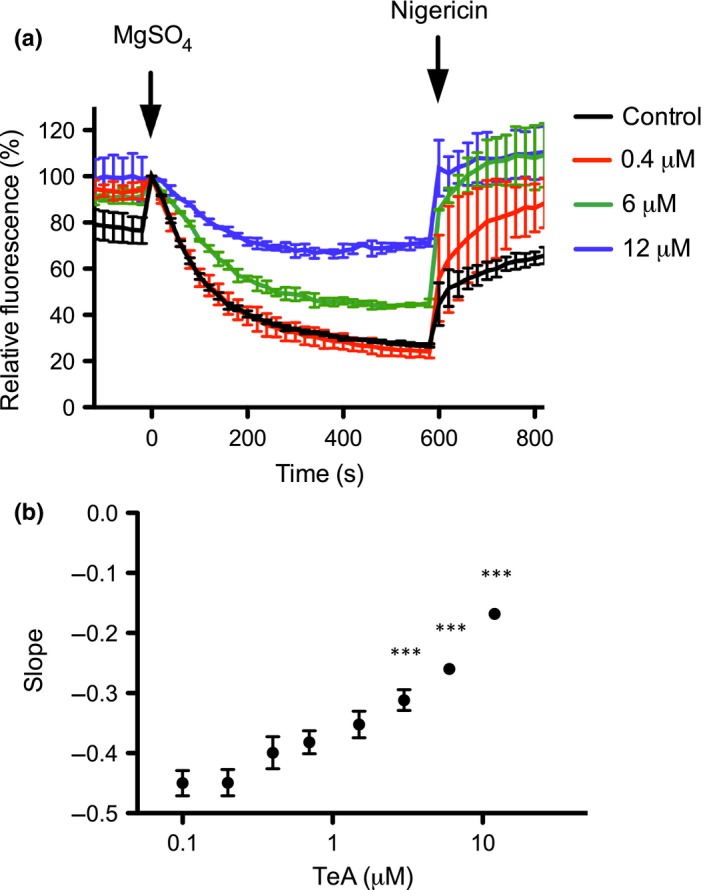
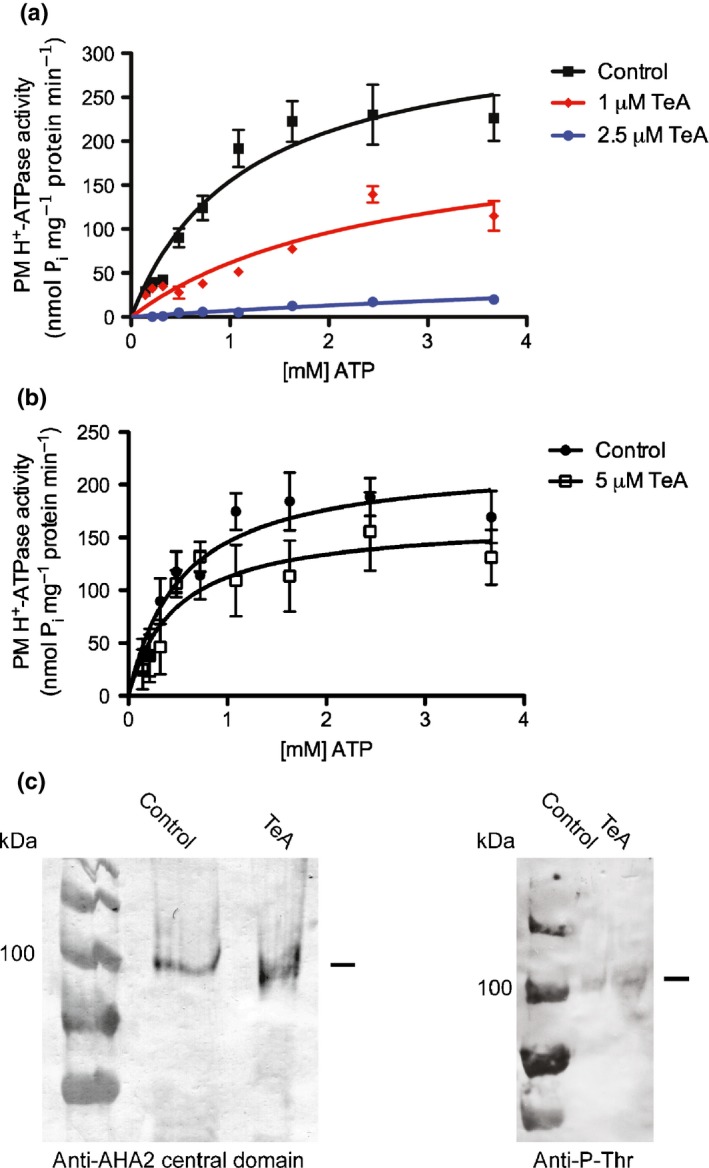
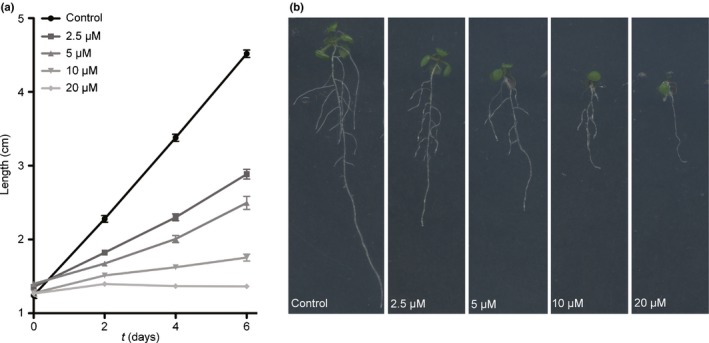
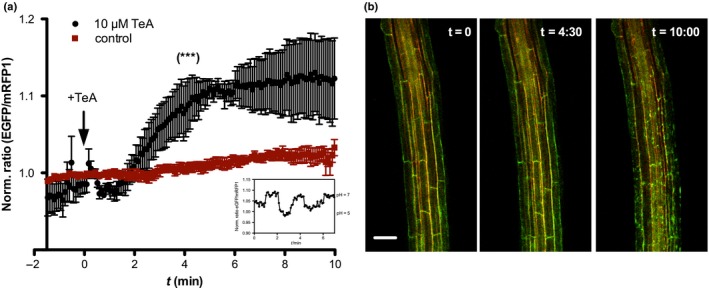
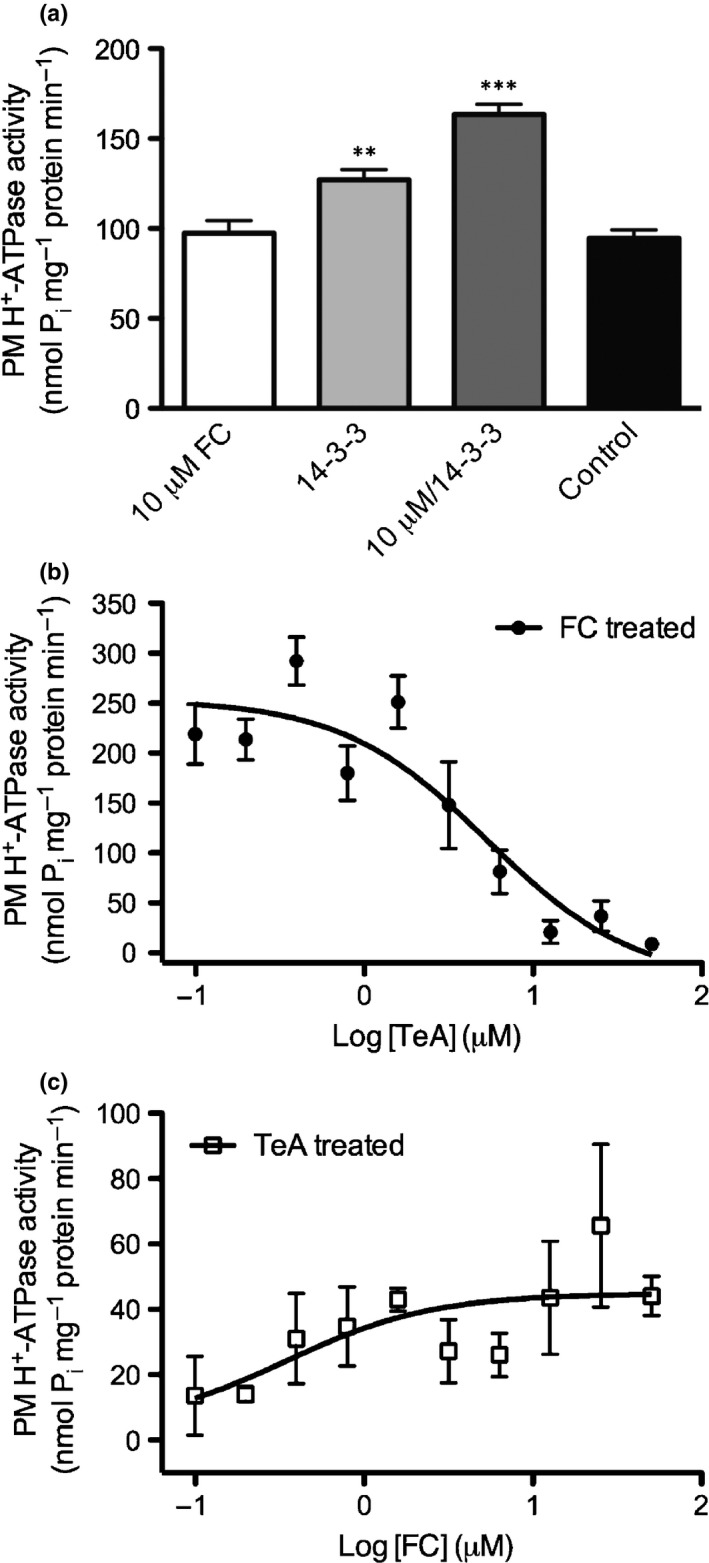
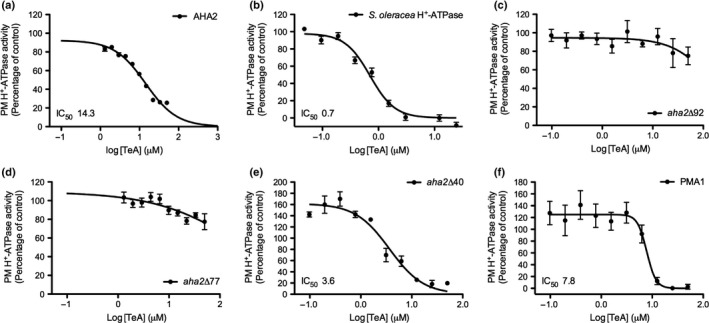
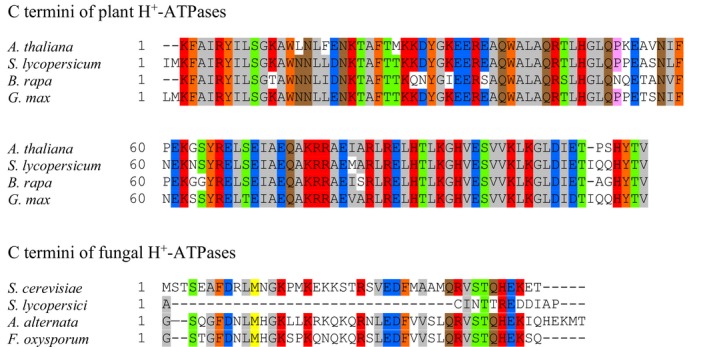
Pathogenic fungi often target the plant plasma membrane (PM) H+ -ATPase during infection. To identify pathogenic compounds targeting plant H+ -ATPases, we screened extracts from 10 Stemphylium species for their effect on H+ -ATPase activity. We identified Stemphylium loti extracts as potential H+ -ATPase inhibitors, and through chemical separation and analysis, tenuazonic acid (TeA) as a potent H+ -ATPase inhibitor. By assaying ATP hydrolysis and H+ pumping, we confirmed TeA as a H+ -ATPase inhibitor both in vitro and in vivo. To visualize in planta inhibition of the H+ -ATPase, we treated pH-sensing Arabidopsis thaliana seedlings with TeA and quantified apoplastic alkalization. TeA affected both ATPase hydrolysis and H+ pumping, supporting a direct effect on the H+ -ATPase. We demonstrated apoplastic alkalization of A. thaliana seedlings after short-term TeA treatment, indicating that TeA effectively inhibits plant PM H+ -ATPase in planta. TeA-induced inhibition was highly dependent on the regulatory C-terminal domain of the plant H+ -ATPase. Stemphylium loti is a phytopathogenic fungus. Inhibiting the plant PM H+ -ATPase results in membrane potential depolarization and eventually necrosis. The corresponding fungal H+ -ATPase, PMA1, is less affected by TeA when comparing native preparations. Fungi are thus able to target an essential plant enzyme without causing self-toxicity.

Keywords: Stemphylium loti; fusicoccin; phytotoxin; plasma membrane H+-ATPase; tenuazonic acid.


Figures

Figure 1
Figure 1
Screening of fungal extracts for their effect on ATPase enzyme activity. Fungi were grown on plates, harvested and metabolites extracted. The extracts were added to plant H+ ‐ATPase assays in order to identify effectors of the plasma membrane (PM) H+‐ATPase. Fractions exhibiting a significant effect (***, P < 0.001) on the H+‐ATPase were further separated and re‐tested. This procedure was repeated until a relatively clean target was identified.
Figure 2
Figure 2
H+‐ATPase activity of Spinacia oleracea plasma membranes in the presence of metabolites from Stemphylium spp. (a) Addition of total metabolites (30 µg) from 10 different Stemphylium spp., (b) Stemphylium loti extracts (from panel a) fractionated into 10 fractions (1.1–1.10), and (c) fractionation of fractions 1.9 and 1.10 (from panel b) into 10 new fractions, 2.1–2.10. Fractions 1.1–1.10 were added as 0.02 (white bars), 0.16 (blue bars), 2.5 (black bars) and 20 μg μg−1 protein (red bars). Fractions 2.1–2.10 were added as 0.01 (white bars), 0.2 (blue bars), 1.5 (black bars) and 11.5 μg μg−1 protein (red bars). Values are means ± SEM. Data were analyzed by two‐way ANOVA, and H+‐ATPase activity was compared to H+‐ATPase activity of the control (no addition of extracts, not shown) with a Bonferroni posttest. *, P < 0.05; **, P < 0.01; ***, P < 0.001; n = 3.
Figure 3
Figure 3
Dose‐dependent inhibition of H+‐ATPase activity measured in Spinacia oleracea plasma membranes (PMs) in response to tenuazonic acid (TeA) treatment. Values are means ± SEM. Experiments with Stemphylium loti fractions 1.9 and 1.10 (a), and 2.6 and 2.7 (b) were carried out in triplicate (n = 3), whereas experiments with TeA (c) were carried out in triplicate and on three independent PM fractions (n = 9). (d, e, f) Data were analyzed using nonlinear regression and fitted to log[inhibitor] (µg) vs the normalized response for determination of IC50 values.
Figure 4
Figure 4
Tenuazonic acid (TeA) effect on H+ pumping of Spinacia oleracea plasma membrane (PM) vesicles. (a) Accumulation of protons in inside‐out PM vesicles of S. oleracea treated with increasing concentrations of TeA visualized and quantified using the fluorescent probe ACMA. Addition of MgSO4 initiates ATP‐stimulated proton pumping into vesicles, whereas addition of nigericin releases the trapped protons by acting as a proton ionophore. Values are means ± SEM based on two technical replicates (n = 2) and are representative of two independent PM purifications. (b) The initial slope of each curve (from t = 0 s to t = 120 s) was estimated by linear regression and plotted as a function of TeA concentration (µM). Values are means ± SEM based on two technical replicates and are representative of two independent PM fractions. Data were analyzed using one‐way ANOVA, and Dunnett's multiple comparisons test was used to calculate the difference in slopes compared to the control: ***, P < 0.001.
Figure 5
Figure 5
Kinetic analysis of Spinacia oleracea plasma membrane (PM) H+‐ATPase inhibition by tenuazonic acid (TeA). Specific activity was plotted as a function of ATP concentration (mM) at the indicated concentrations of TeA. (a) In vitro treatment. (b) In vivo treatment of S. oleracea leaves, 5 μM TeA or DMSO (control) for 15 min before purification of plasma membranes. Values are means ± SEM of four technical replicates of two independent PM samples (n = 8). (c) Immunodetection of PM H+‐ATPase and Phospho‐Threonine in the plasma membrane samples (20 µg per lane). +/− indicates pretreatment with TeA or not.
Figure 6
Figure 6
Tenuazonic acid (TeA) effect on Arabidopsis thaliana root growth. Seeds (Col‐0) were germinated and grown for 6 d on ½ Murashige & Skoog, before transfer to ½MS agar containing 0, 2.5, 5, 10 or 20 µM TeA, respectively, and further grown for 6 d. (a) Root length of 12‐d‐old seedlings was measured on days 0, 2, 4 and 6 after transfer to plates with TeA. Values given are means ± SEM, n = 32–48. Root lengths of treated plants were all highly significant (P < 0.001) for treatments compared to control after 2 d growth with TeA. (b) Images of 12‐d‐old seedlings.
Figure 7
Figure 7
In vivo tenuazonic acid (TeA)‐induced alkalization of the apoplast in elongating root cells of 4‐ to 5‐d‐old Arabidopsis thaliana roots expressing apo‐pHusion. (a) Seedlings were mounted with agar on a Teflon‐coated microscope slide and covered with a droplet of bath solution. Root cells in the elongation zone were viewed on an SP5‐X confocal laser scanning microscope, using a ×20 dipping objective and a perfusion setup for addition of TeA. After c. 2 min, 500 µl of 10 µM TeA (black curve) or bath solution (control, red curve) was added (black arrow) and the experiment was run for 10 min in total. Normalized ratio measurements of EGFP/mRFP1 are given as means ± SEM of n = 4 replicates. pH changes in response to TeA treatment were highly significant (***, P < 0.001) in comparison with controls (Student's t‐test). Inset shows in planta pH calibration curve using 10 mM MES, 10 mM MOPS, and 10 mM citrate buffer with pH adjusted to pH 5–7. (b) Confocal overlay images of EGFP (green) and mRFP1 (red) channels at three time points during the experiment: t = 0 before addition of TeA, t = 4:30 at the peak of the response, and t = 10:00 after 10 min. Bar, 50 µm.
Figure 8
Figure 8
Competition between Fusicoccin (FC) and tenuazonic acid (TeA). (a) Activation of Spinacia oleracea plasma membrane (PM) H+‐ATPase preincubated with either FC, 14‐3‐3 or FC/14‐3‐3 before assay start. (b) Dose‐dependent TeA inhibition of S. oleracea PM H+‐ATPase preincubated with FC and 14‐3‐3 protein before assay start. (c) Dose‐dependent FC/14‐3‐3 activation of S. oleracea PM H+‐ATPase preincubated with 20 μM TeA before assay start. (b, c) Data were analyzed using nonlinear regression and fitted to log[agonist] (μM) vs the normalized response (variable slope) to determine the half maximal effective concentration (EC50) value. FC (10 µM) and 14‐3‐3 (1 µg) were used in all treatments. Treatments with 14‐3‐3 alone or FC/14‐3‐3 were significantly different from nontreated (**, P < 0.01; ***, P < 0.001). Experiments were performed in triplicates of two independent PM fractions, and values represent means ± SEM (n = 6).
Figure 9
Figure 9
The effect of tenuazonic acid (TeA) on plasma membrane (PM) H+‐ATPases with C‐terminal deletions. TeA‐induced inhibition of H+‐ATPase activity measured on (a) AHA2 expressed in Saccharomyces cerevisiae, (b) PMs from Spinacia oleracea, (c, d, e) C‐terminally truncated versions of AHA2; aha2Δ92 (c), aha2Δ77 (d) and aha2Δ40 (e), all expressed in S. cerevisiae, (f) endogenous S. cerevisiae H+‐ATPase PMA1. ATP hydrolytic activity experiments were performed in triplicates of three independent fractions (n = 9), except for AHA2 and aha2Δ77 (two independent fractions, n = 6). Values represent means ± SEM. Data were analyzed using nonlinear regression and fitted to log[TeA] vs the response (variable slope) (constrains bottom = 0.0) to determine the IC50 values.
Figure 10
Figure 10
Alignments of amino acid sequences of the C termini of H+‐ATPases from the plants Arabidopsis thaliana, Solanum lycopersicum, Brassica rapa and Glycine max, and the fungi Saccharomyces cerevisiae, Stemphylium lycopersici, Alternaria alternata and Fusarium oxysporum. Numbers indicate length of the C terminus, and colors indicate conserved amino acids.

References

    1. Apel K, Hirt H. 2004. Reactive oxygen species: metabolism, oxidative stress, and signal transduction. Annual Review of Plant Biology 55: 373–399. - PubMed
    1. Baginski ES, Foa PP, Zak B. 1967. Determination of phosphate: Study of labile organic phosphate interference. Clinica Chimica Acta 15: 155–158.
    1. Boller T, Felix G. 2009. A renaissance of elicitors: perception of microbe‐associated molecular patterns and danger signals by pattern‐recognition receptors. Annual Review of Plant Biology 60: 379–406. - PubMed
    1. Bradford MM. 1976. A rapid and sensitive method for the quantitation of microgram quantities of protein utilizing the principle of protein‐dye binding. Analytical Biochemistry 72: 248–254. - PubMed
    1. Chen S, Kang Y, Zhang M, Wang X, Strasser RJ, Zhou B, Qiang S. 2015. Differential sensitivity to the potential bioherbicide tenuazonic acid probed by the JIP‐test based on fast chlorophyll fluorescence kinetics. Environmental and Experimental Botany 112: 1–15.

Publication types

Substances

Supplementary concepts

LinkOut - more resources