Review
. 2020 Jan;39(1):101-117.
doi: 10.1002/etc.4563.

Validation of Bioavailability-Based Toxicity Models for Metals

Affiliations
Review

Validation of Bioavailability-Based Toxicity Models for Metals

Emily R Garman et al. Environ Toxicol Chem. 2020 Jan.

Abstract

Regulatory jurisdictions worldwide are increasingly incorporating bioavailability-based toxicity models into development of protective values (PVALs) for freshwater and saltwater aquatic life (e.g., water quality criteria, standards, and/or guidelines) for metals. Use of such models for regulatory purposes should be contingent on their ability to meet performance criteria as specified through a model-validation process. Model validation generally involves an assessment of a model's appropriateness, relevance, and accuracy. We review existing guidance for validation of bioavailability-based toxicity models, recommend questions that should be addressed in model-validation studies, discuss model study type and design considerations, present several new ways to evaluate model performance in validation studies, and suggest a framework for use of model validation in PVAL development. We conclude that model validation should be rigorous but flexible enough to fit the user's purpose. Although a model can never be fully validated to a level of zero uncertainty, it can be sufficiently validated to fit a specific purpose. Therefore, support (or lack of support) for a model should be presented in such a way that users can choose their own level of acceptability. We recommend that models be validated using experimental designs and endpoints consistent with the data sets that were used to parameterize and calibrate the model and validated across a broad range of geographically and ecologically relevant water types. Environ Toxicol Chem 2019;39:101-117. © 2019 SETAC.

Keywords: Biotic ligand model; Metal bioavailability; Metal toxicity; Model performance; Validation; Water chemistry.


Figures

FIGURE 1:
FIGURE 1:
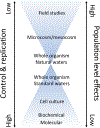
Studies that could be used to validate a bioavailability-based metal toxicity model. The width of the shaded area indicates that uncertainty in the validation results increases the further the level of biological organization/endpoint is away from the level of biological organization/endpoint for which the model was parameterized, which in this example is whole-organismal tests conducted in natural waters.
FIGURE 2:
FIGURE 2:
Four hypothetical cases of performance of bioavailability-based metal toxicity models, for predictions of an effect concentration at x% impairment of a biological response (ECx). The solid black diagonal line is the 1:1 line of perfect agreement between model-predicted and observed ECx values; the dashed black diagonal lines are plus or minus a factor of 2 above and below the 1:1 line. (A) An accurate, unbiased model with data points falling along the 1:1 line; (B) a less accurate, unbiased model with data points exhibiting more scatter about the 1:1 line; (C) a biased model that consistently overpredicts the observed ECx values; and (D) a biased model that predicts intermediate ECx values well but has a clear bias when predicting low and high ECx values.
FIGURE 3:
FIGURE 3:
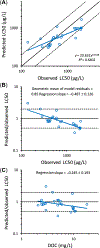
(A) Comparison of biotic ligand model–predicted and observed median lethal concentration (LC50) values for larval fathead minnows (Pimephales promelas) exposed to Cu in a variety of surface waters (Ryan et al. 2004). The equation for the blue regression line is Predicted LC50 = 20.631 × (Observed LC50)0.5128 (n = 27, R2 = 0.6402). (B) The same data plotted as the predicted LC50/observed LC50 ratio versus observed LC50, analogous to a plot of regression residuals. Slope of blue regression line = −0.487 (n = 27, 95% CI −0.361 to −0.613); geometric mean predicted LC50/observed LC50 ratio = 0.85. (C) The same data plotted as the predicted LC50/observed LC50 ratio versus dissolved organic carbon concentration, analogous to a plot of regression residuals. Slope of blue regression line = −0.245 (n = 27, 95% CI −0.051 to −0.438). In all 3 panels, the solid black diagonal line is the 1:1 line of perfect agreement between model-predicted and observed effect concentration at x% values; the dashed black diagonal lines are plus or minus a factor of 2 above and below the 1:1 line. DOC = dissolved organic carbon.
FIGURE 4:
FIGURE 4:
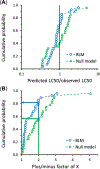
Cumulative probability distributions of (A) model-predicted median lethal concentration (LC50)/observed LC50 ratio and (B) the factor of agreement between model-predicted and observed LC50 values (the factor of X) for larval fathead minnows (Pimephales promelas) exposed to Cu in a variety of surface waters (Ryan et al. 2004). Blue symbols represent ratios for LC50 values calculated using a biotic ligand model; green symbols represent ratios for LC50 values calculated using a null model (i.e., the predicted LC50 for all 27 different exposure waters equals the geometric mean of the 27 observed LC50 values). BLM = biotic ligand model.
FIGURE 5:
FIGURE 5:
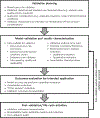
Validation process diagram for bioavailability-based models for metals.

References

    1. Adams W, Blust R, Dwyer R, Mount D, Nordheim E, Rodriguez PH, Spry D. 2020. Bioavailability assessment of metals in freshwater environments: A historical review. Environ Toxicol Chem 39:48–59. - PMC - PubMed
    1. Arnold WR. 2005. Effects of dissolved organic carbon on copper toxicity: Implications for saltwater copper criteria. Integr Environ Assess Manag 1:34–39. - PubMed
    1. Australian and New Zealand Governments. 2019. Australian and New Zealand guidelines for fresh and marine water quality. Canberra, ACT, Australia. [cited 2019 November 11]. Available from: www.waterquality.gov.au/anz-guidelines
    1. Balistrieri LS, Mebane CA, Schmidt TS, Keller W. 2015. Expanding metal mixture toxicity models to natural stream and lake invertebrate communities. Environ Toxicol Chem 34:761–776. - PubMed
    1. Batley GE, Apte SC, Stauber JL. 2004. Speciation and bioavailability of trace metals in water: Progress since 1982. Aust J Chem 57:903–919.

Publication types

MeSH terms