. 2019 Dec 27;15(12):e1008501.
doi: 10.1371/journal.pgen.1008501. eCollection 2019 Dec.

The MITF-SOX10 regulated long non-coding RNA DIRC3 is a melanoma tumour suppressor

Affiliations

The MITF-SOX10 regulated long non-coding RNA DIRC3 is a melanoma tumour suppressor

Elizabeth A Coe et al. PLoS Genet. .

Abstract

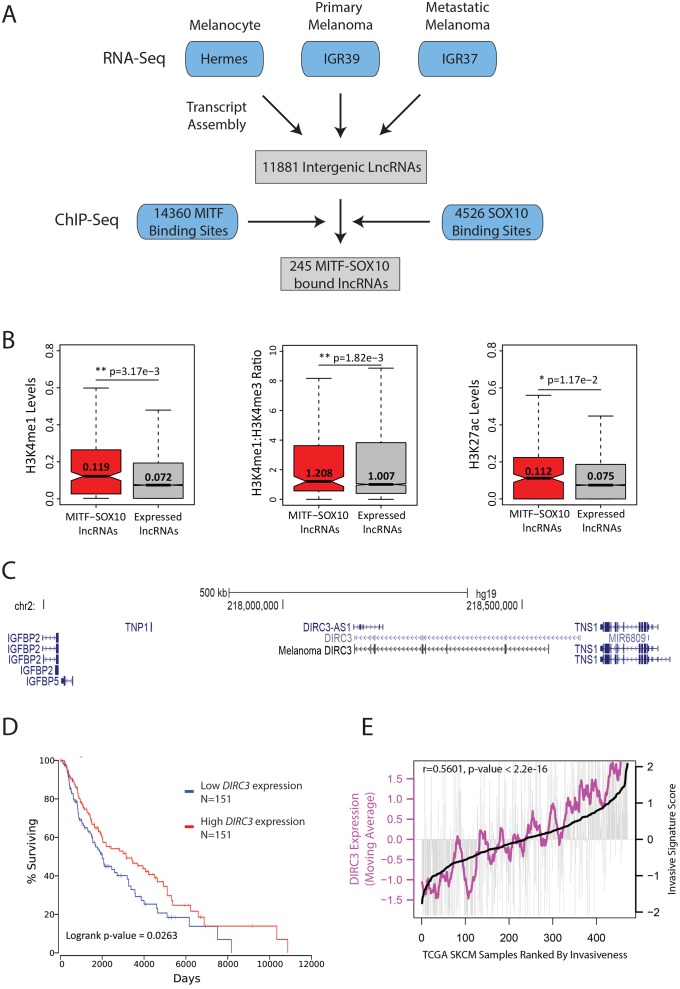
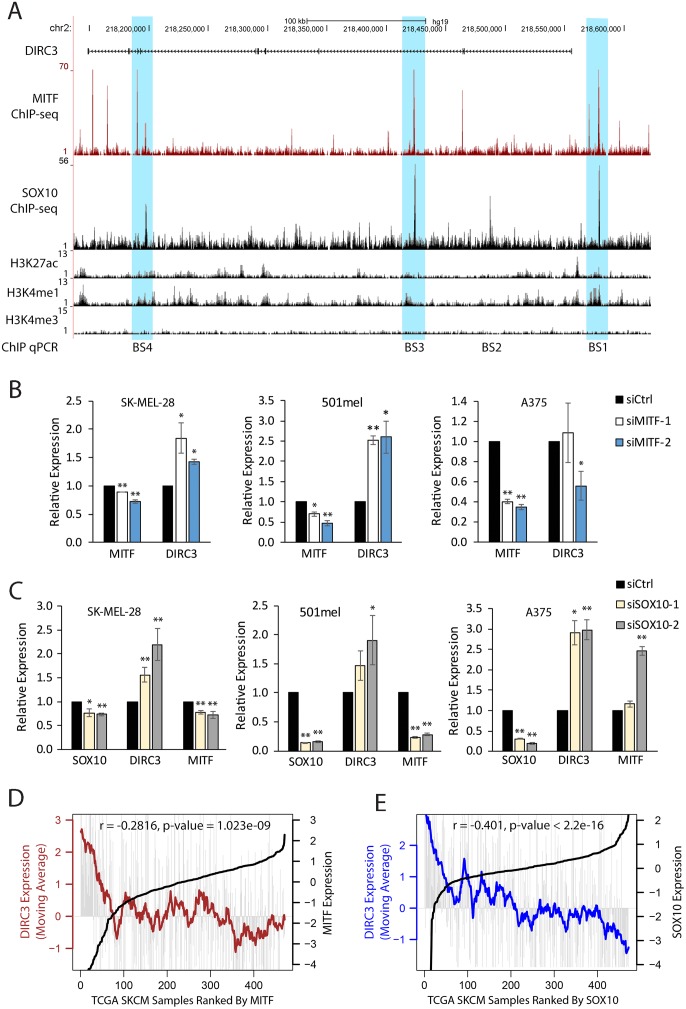
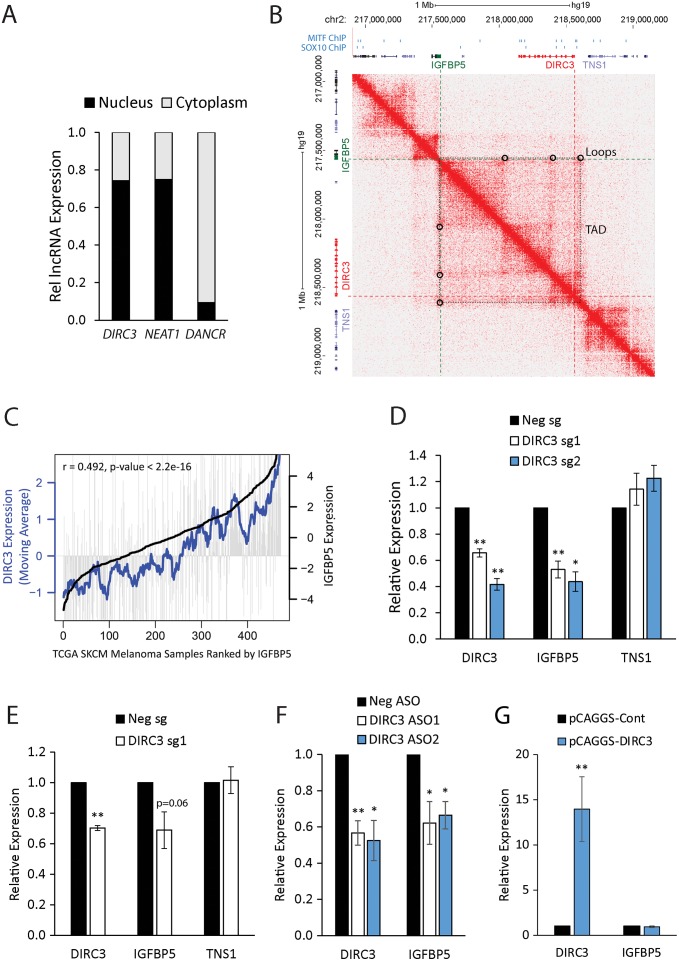
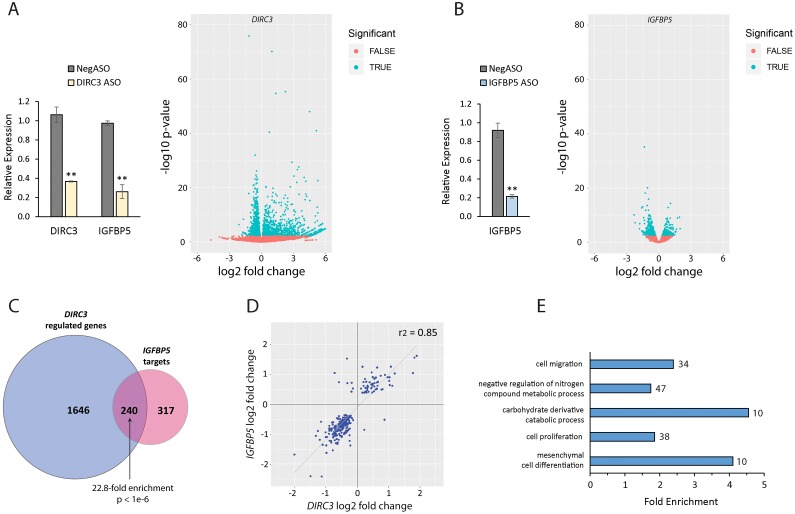
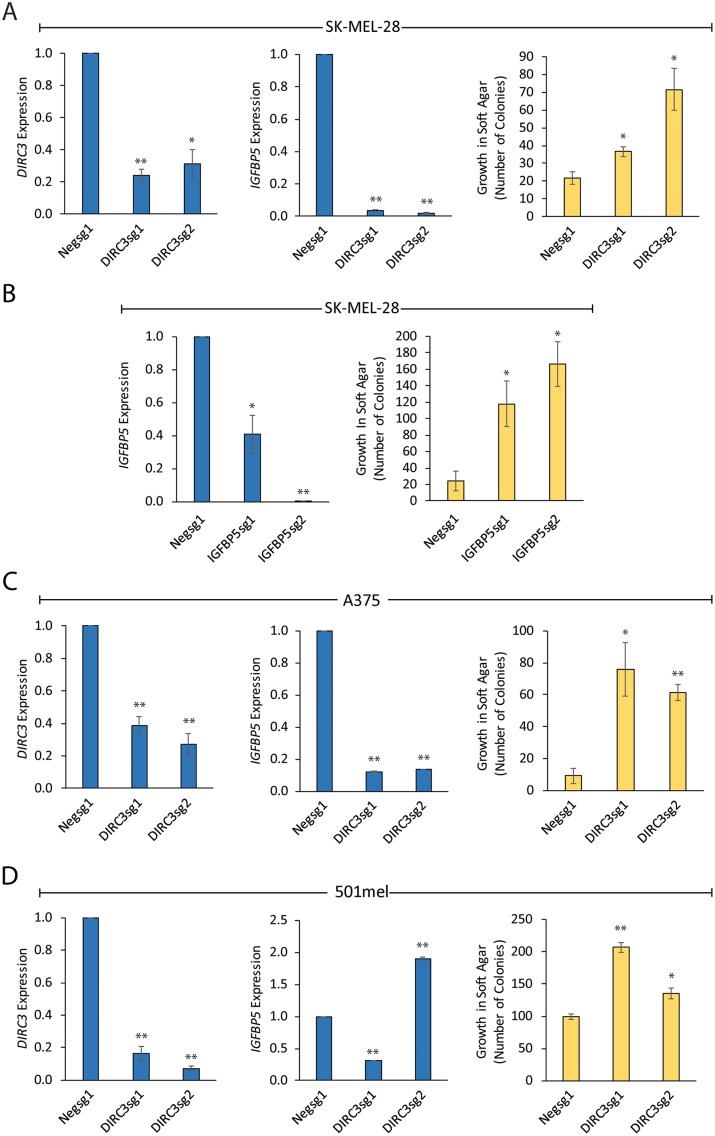
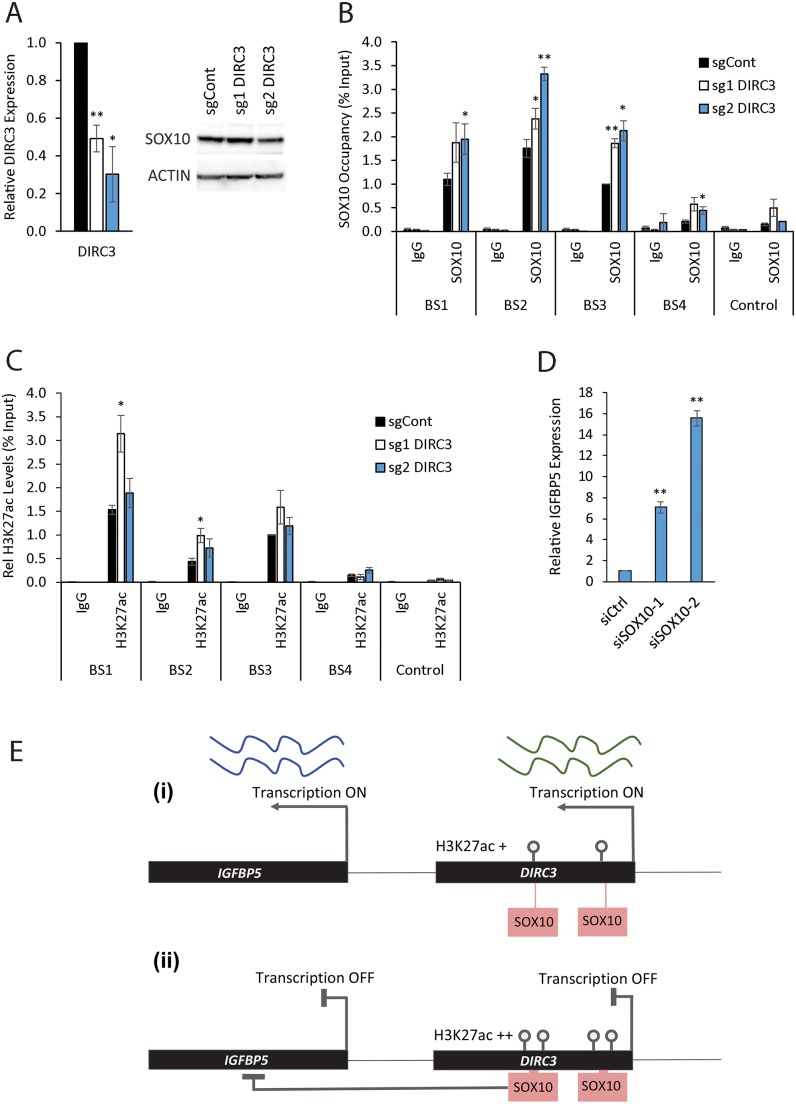
The MITF and SOX10 transcription factors regulate the expression of genes important for melanoma proliferation, invasion and metastasis. Despite growing evidence of the contribution of long noncoding RNAs (lncRNAs) in cancer, including melanoma, their functions within MITF-SOX10 transcriptional programmes remain poorly investigated. Here we identify 245 candidate melanoma associated lncRNAs whose loci are co-occupied by MITF-SOX10 and that are enriched at active enhancer-like regions. Our work suggests that one of these, Disrupted In Renal Carcinoma 3 (DIRC3), may be a clinically important MITF-SOX10 regulated tumour suppressor. DIRC3 depletion in human melanoma cells leads to increased anchorage-independent growth, a hallmark of malignant transformation, whilst melanoma patients classified by low DIRC3 expression have decreased survival. DIRC3 is a nuclear lncRNA that activates expression of its neighbouring IGFBP5 tumour suppressor through modulating chromatin structure and suppressing SOX10 binding to putative regulatory elements within the DIRC3 locus. In turn, DIRC3 dependent regulation of IGFBP5 impacts the expression of genes involved in cancer associated processes and is needed for DIRC3 control of anchorage-independent growth. Our work indicates that lncRNA components of MITF-SOX10 networks are an important new class of melanoma regulators and candidate therapeutic targets that can act not only as downstream mediators of MITF-SOX10 function but as feedback regulators of MITF-SOX10 activity.


Conflict of interest statement

The authors have declared that no competing interests exist.

Figures

Fig 1
Fig 1. LncRNAs are components of MITF-SOX10 networks in melanoma.
(A) Workflow diagram describing the experimental and computational methods used to identify a set of melanocyte and/or melanoma expressed intergenic lncRNAs whose genomic loci are bound by the MITF and SOX10. (B) Distribution of the number of normalised H3K4me1 (left panel), H3K27ac (right panel), and ratio of H3K4me1 to H3K4me3 (middle panel) sequencing reads mapped to MITF-SOX10 bound lncRNAs (red) and all expressed lncRNA (grey) loci in the sh-PTEN HMEL tumorigenic melanoma cell line [32]. Differences between groups were tested using a two-tailed Mann-Whitney U test, and p values are indicated. (C) Schematic illustration of the human DIRC3 locus and neighbouring protein coding genes (GRCh37/hg19). Rapid amplification of cDNA ends (RACE) and RT-PCR experiments defined DIRC3 as a 3,384 nucleotide multi-exonic transcript in human melanoma cells. (D) TCGA survival data for Skin Cutaneous Melanoma (SKCM) was linked to DIRC3 expression using OncoLnc [33]. Patients were sorted based on DIRC3 expression and percent survival compared between DIRC3 high (top third) and DIRC3 low (bottom third) groups. Cox regression analysis shows that low DIRC3 expression correlates with statistically significant decreased survival in melanoma patients (logrank p-value = 0.0263). (E) DIRC3 levels correlate with an invasiveness gene expression signature [31] in melanoma. The 471 TCGA human melanoma RNA-seq samples were ranked by increasing invasion signature score. Vertical grey lines indicate DIRC3 expression in each melanoma sample. Moving averages are plotted in bold.
Fig 2
Fig 2. DIRC3 is a direct MITF and SOX10 transcriptional target.
(A) UCSC genome browser view showing that the DIRC3 locus contains multiple ChIP-seq defined binding sites for MITF and SOX10 in 501mel cells [29]. MITF (B) and SOX10 (C) repress DIRC3 in human melanoma cells. MITF and SOX10 were depleted in SK-MEL-28, 501mel and A375 cells using siRNA transfection. Expression changes were analysed using RT-qPCR. POLII was used as a reference gene. Results presented as mean +/- SEM., n≥3; one-tailed t-test * p<0.05, ** p<0.01. MITF and SOX10 protein levels are shown in S3 Fig. (D, E) DIRC3 expression inversely correlates with MITF (D) and SOX10 (E) in melanoma patients. DIRC3 levels were analysed in 471 TCGA human melanoma samples ranked using increasing MITF or SOX10. Vertical grey lines indicate DIRC3 expression in each melanoma sample. Moving averages are plotted in bold.
Fig 3
Fig 3. DIRC3 acts locally to activate expression of the adjacent IGFBP5 tumour suppressor gene.
(A) DIRC3 transcript is enriched in the nucleus in melanoma cells. SK-MEL-28 cells were biochemically separated into cytoplasmic and nuclear fractions. The relative levels of DIRC3 and control DANCR (cytoplasm) and NEAT1 (nuclear) transcripts in each fraction were determined by qRT-PCR. (B) DIRC3 and IGFBP5 are located within the same TAD. Heatmap displaying chromosomal interactions, measured using HiC, at regions surrounding DIRC3 (red), IGFBP5 (green) and TSN1 (purple), shown in gene browser view, in NHEK (chr2: 217,000,000–219,000,000). The dotted black square box on the heatmap represents a TAD. Chromosomal looping interactions are indicated by black circles. MITF and SOX10 binding sites are denoted as blue boxes. (C) DIRC3 expression correlates with IGFBP5 in melanoma patient samples. Analysis of DIRC3 expression in TCGA human melanoma samples ranked by increasing IGFBP5. Vertical grey lines indicate DIRC3 expression in each melanoma sample. Bold black indicates IGFBP5 expression; the blue line is the moving average of DIRC3 expression across 20 melanoma samples. (D-F) DIRC3 specifically activates IGFBP5 expression in a transcript dependent manner. DIRC3 levels were depleted by dCas9-KRAB mediated CRISPRi (D), steric hindrance with dCas9 (E) or ASO LNA GapmeR mediated transcript degradation (F) in SK-MEL-28 cells. Expression of DIRC3 and the indicated neighbouring genes were measured using RT-qPCR with results normalised to POLII. Expression changes are shown relative to a non-targeting control (set at 1). (G) Ectopic DIRC3 fails to activate IGFBP5. SK-MEL-28 cells were transfected with pCAGGS-DIRC3 or pCAGGS alone and cells harvested for expression analysis 3 days later. Results are presented relative to the pCAGGS control. For all RT-qPCR reactions, mean values +/- SEM are shown, n≥3. One-tailed student’s t-test p < 0.05 * p < 0.01 **
Fig 4
Fig 4. DIRC3 regulates IGFBP5-dependent gene expression programmes involved in cancer.
(A) DIRC3 depletion induces statistically significant changes (FRD 5%) in the expression of 1886 genes in SK-MEL-28 cells using RNA-seq. (B) RNA-seq of IGFBP5 knockdown SK-MEL-28 cells identifies 557 IGFBP5 target genes (FDR 5%). (C) Intersection of DIRC3- and IGFBP5-regulated genes detects 240 common targets. (D) The expression levels of all DIRC3-IGFBP5 shared target genes change in the same direction following either DIRC3 or IGFBP5 depletion. (E) Gene Ontology enrichment analysis of DIRC3- and IGFBP5 shared target genes was performed using GOstats and FDR correction was applied. Representative significantly enriched categories are shown and the number of genes found in each category are indicated.
Fig 5
Fig 5. DIRC3 acts through IGFBP5 to block anchorage-independent growth in melanoma.
Stable DIRC3 (A) and IGFBP5 (B) loss-of-function SK-MEL-28 cells were generated using CRISPRi and DIRC3 and IGFBP5 expression measured using RT-qPCR. Knockdown and control cell lines were seeded on soft agar and colony formation quantified 21 days later using ImageJ. Mean values +/- SEM, n = 3 (right panels). DIRC3 depletion increases the anchorage-independent growth of multiple melanoma cell lines in soft agar. DIRC3 expression was depleted in A375 (C) and 501mel (D) human melanoma cells using CRISPRi with two independent DIRC3 targeting sgRNAs and a non-targeting negative control. DIRC3 and IGFBP5 levels were determined using RT-qPCR and expression changes shown relative to control (set at 1). Results are presented as mean values +/- SEM, n = 3. One-tailed student’s t-test p < 0.05 * p < 0.01 **. Knockdown and control cell lines were seeded on soft agar and colony formation quantified 21 days later using ImageJ. Mean values +/- SEM, n = 3 (right panels).
Fig 6
Fig 6. DIRC3 induces closed chromatin at its site of expression thereby blocking SOX10 DNA binding and activating IGFBP5.
ChIP assays were performed in DIRC3 depleted SK-MEL-28 and control cell lines using the indicated antibodies against either SOX10, H3K27ac or an isotype specific IgG control. (A) DIRC3 depletion was confirmed using qRT-PCR. Western blotting showed that SOX10 protein levels do not change upon DIRC3 knockdown. ACTIN was used as a loading control. (B) The indicated SOX10 binding sites were analysed by qPCR. % input was calculated as 100*2^(Ct Input-Ct IP). (C) DIRC3 depletion leads to an increase in H3K27ac levels at SOX10 bound regulatory elements within the DIRC3 locus. (D) SOX10 represses IGFBP5 expression. SOX10 was reduced in SK-MEL-28 cells using transfection of two independent siRNAs (see Fig 2C for SOX10 levels). IGFBP5 expression was quantified using RT-qPCR three days later. POLII was used as a reference gene and expression changes are shown relative to a non-targeting control (set at 1). (E) Model illustrating that DIRC3 acts locally to close chromatin and prevent SOX10 chromatin binding at melanoma regulatory elements within its locus. This leads to a block in SOX10 mediated repression of IGFBP5 and subsequent increase in IGFBP5 expression. All qPCR results are presented as mean values +/- SEM, n = 3. One-tailed student’s t-test p < 0.05 * p < 0.01 **.

References

    1. Kopp F, Mendell JT. Functional Classification and Experimental Dissection of Long Noncoding RNAs. Cell. 2018;172(3):393–407. 10.1016/j.cell.2018.01.011 . - DOI - PMC - PubMed
    1. Vance KW, Ponting CP. Transcriptional regulatory functions of nuclear long noncoding RNAs. Trends Genet. 2014;30(8):348–55. 10.1016/j.tig.2014.06.001 . - DOI - PMC - PubMed
    1. Blank-Giwojna A, Postepska-Igielska A, Grummt I. lncRNA KHPS1 Activates a Poised Enhancer by Triplex-Dependent Recruitment of Epigenomic Regulators. Cell reports. 2019;26(11):2904–15.e4. 10.1016/j.celrep.2019.02.059 . - DOI - PubMed
    1. Davidovich C, Goodrich KJ, Gooding AR, Cech TR. A dimeric state for PRC2. Nucleic Acids Res. 2014;42(14):9236–48. 10.1093/nar/gku540 . - DOI - PMC - PubMed
    1. Anderson KM, Anderson DM, McAnally JR, Shelton JM, Bassel-Duby R, Olson EN. Transcription of the non-coding RNA upperhand controls Hand2 expression and heart development. Nature. 2016;539(7629):433–6. 10.1038/nature20128 . - DOI - PMC - PubMed

Publication types

MeSH terms

Substances