

Effect of growth rate on transcriptomic responses to immune stimulation in wild-type, domesticated, and GH-transgenic coho salmon
- PMID: 31881844
- PMCID: PMC6935076
- DOI: 10.1186/s12864-019-6408-4
Effect of growth rate on transcriptomic responses to immune stimulation in wild-type, domesticated, and GH-transgenic coho salmon
Abstract
Background: Transcriptomic responses to immune stimulation were investigated in coho salmon (Oncorhynchus kisutch) with distinct growth phenotypes. Wild-type fish were contrasted to strains with accelerated growth arising either from selective breeding (i.e. domestication) or genetic modification. Such distinct routes to accelerated growth may have unique implications for relationships and/or trade-offs between growth and immune function.
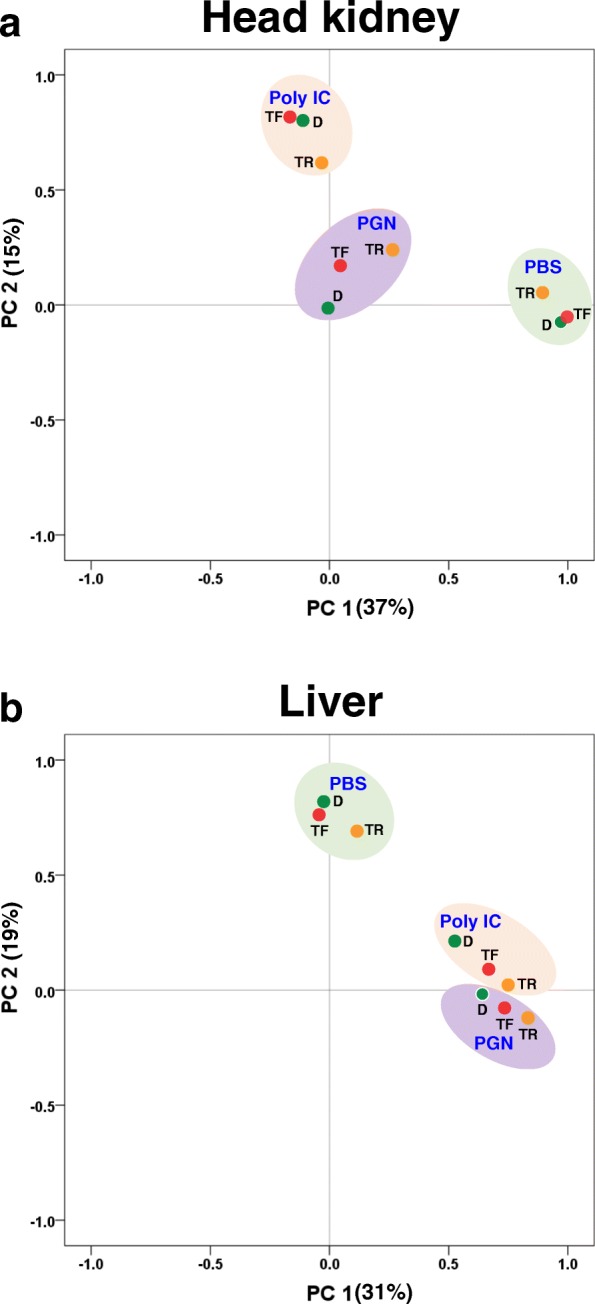
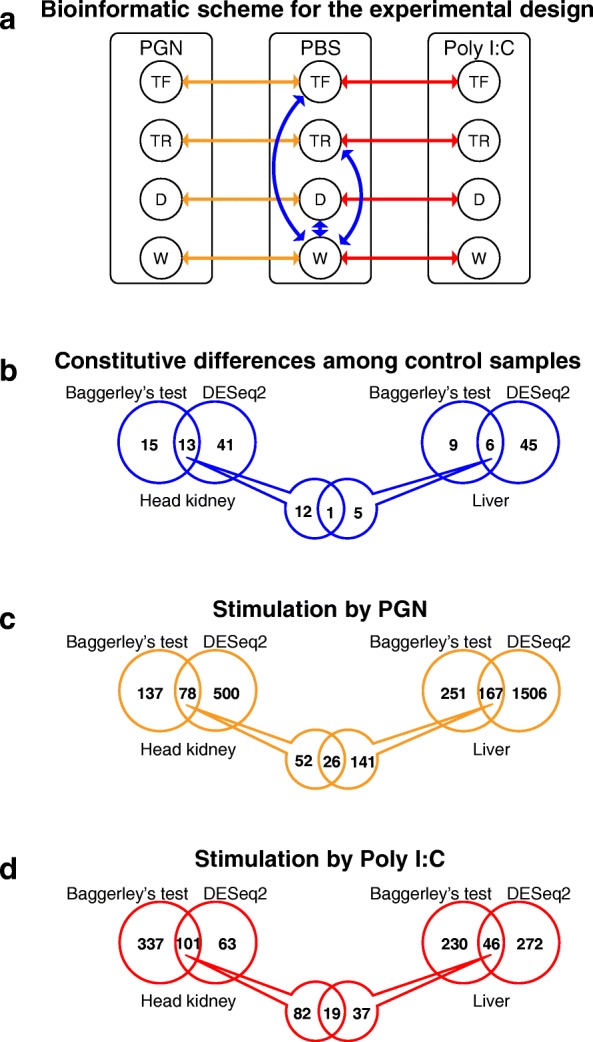
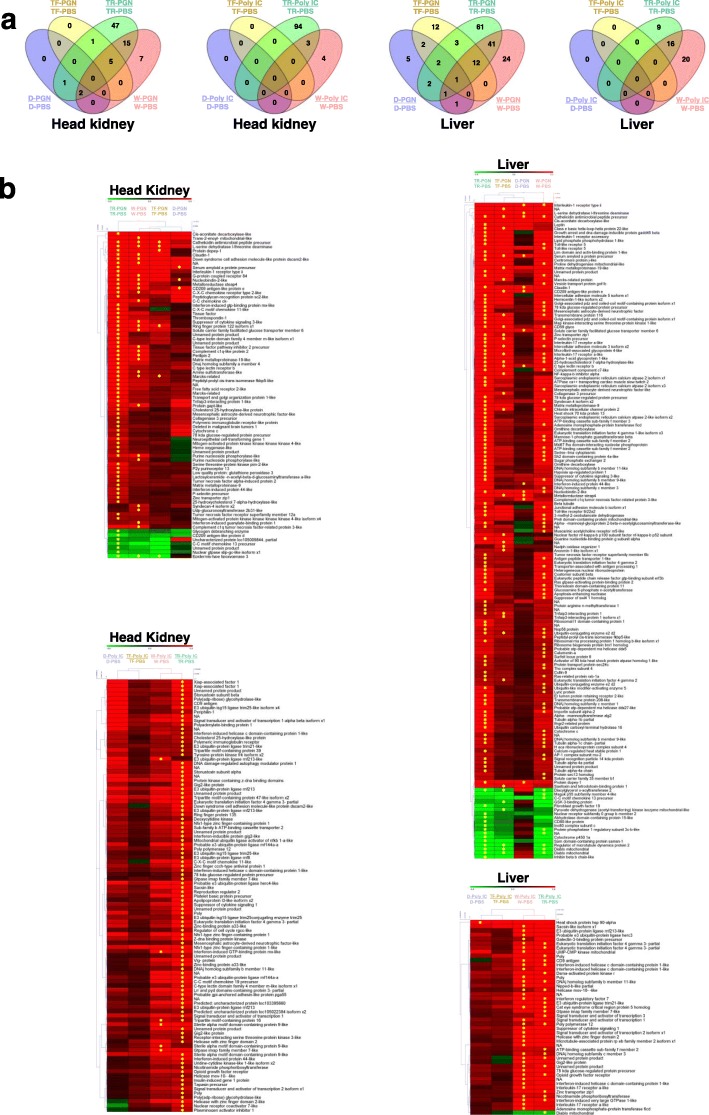
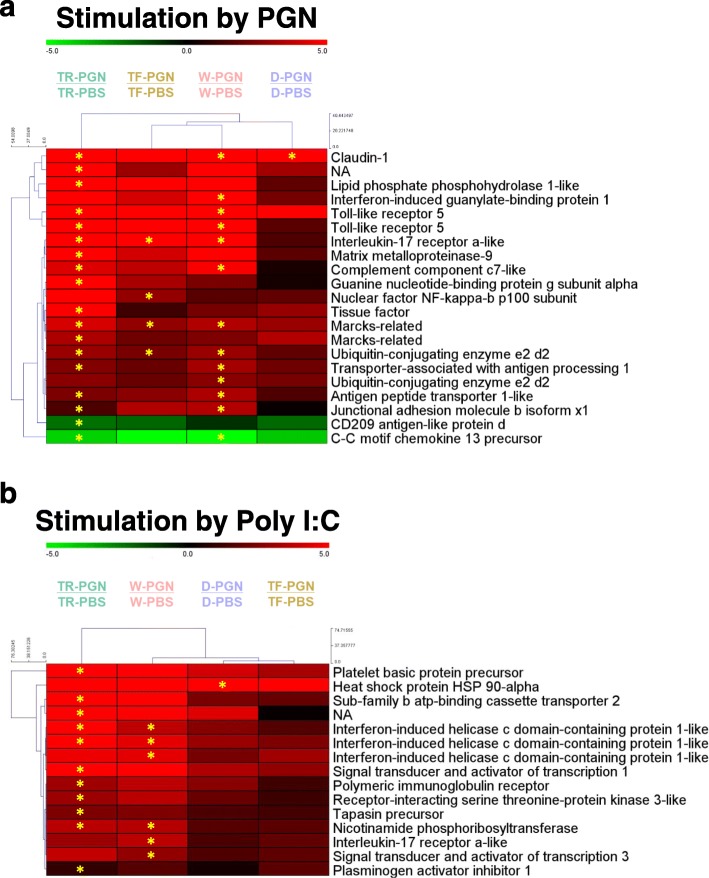
Results: RNA-Seq was performed on liver and head kidney in four 'growth response groups' injected with polyinosinic-polycytidylic acid (Poly I:C; viral mimic), peptidoglycan (PGN; bacterial mimic) or PBS (control). These groups were: 1) 'W': wild-type, 2) 'TF': growth hormone (GH) transgenic salmon with ~ 3-fold higher growth-rate than W, 3) 'TR': GH transgenic fish ration restricted to possess a growth-rate equal to W, and 4) 'D': domesticated non-transgenic fish showing growth-rate intermediate to W and TF. D and TF showed a higher similarity in transcriptomic response compared to W and TR. Several immune genes showed constitutive expression differences among growth response groups, including perforin 1 and C-C motif chemokine 19-like. Among the affected immune pathways, most were up-regulated by Poly I:C and PGN. In response to PGN, the c-type lectin receptor signalling pathway responded uniquely in TF and TR. In response to stimulation with both immune mimics, TR responded more strongly than other groups. Further, group-specific pathway responses to PGN stimulation included NOD-like receptor signalling in W and platelet activation in TR. TF consistently showed the most attenuated immune response relative to W, and more DEGs were apparent in TR than TF and D relative to W, suggesting that a non-satiating ration coupled with elevated circulating GH levels may cause TR to possess enhanced immune capabilities. Alternatively, TF and D salmon are prevented from acquiring the same level of immune response as TR due to direction of energy to high overall somatic growth. Further study of the effects of ration restriction in growth-modified fishes is warranted.
Conclusions: These findings improve our understanding of the pleiotropic effects of growth modification on the immunological responses of fish, revealing unique immune pathway responses depending on the mechanism of growth acceleration and nutritional availability.
Keywords: Coho salmon; Growth; Growth hormone; Immunity; PGN; Pleiotropy; Poly I:C; Selective breeding; Transcriptomics; Transgenesis.
Conflict of interest statement
The authors declare that they have no competing interests.
Figures


Similar articles
-
Environment and genotype predict the genomic nature of domestication of salmonids as revealed by gene expression.Proc Biol Sci. 2022 Dec 14;289(1988):20222124. doi: 10.1098/rspb.2022.2124. Epub 2022 Dec 7. Proc Biol Sci. 2022. PMID: 36475438 Free PMC article. Review.
-
RNAseq analysis of fast skeletal muscle in restriction-fed transgenic coho salmon (Oncorhynchus kisutch): an experimental model uncoupling the growth hormone and nutritional signals regulating growth.BMC Genomics. 2015 Jul 31;16(1):564. doi: 10.1186/s12864-015-1782-z. BMC Genomics. 2015. PMID: 26228074 Free PMC article.
-
Effects of chronic growth hormone overexpression on appetite-regulating brain gene expression in coho salmon.Mol Cell Endocrinol. 2015 Sep 15;413:178-88. doi: 10.1016/j.mce.2015.06.024. Epub 2015 Jun 26. Mol Cell Endocrinol. 2015. PMID: 26123591
-
Domestication and growth hormone transgenesis cause similar changes in gene expression in coho salmon (Oncorhynchus kisutch).Proc Natl Acad Sci U S A. 2009 Mar 3;106(9):3047-52. doi: 10.1073/pnas.0809798106. Epub 2009 Feb 17. Proc Natl Acad Sci U S A. 2009. PMID: 19223591 Free PMC article.
-
Growth hormone transgenesis in coho salmon disrupts muscle immune function impacting cross-talk with growth systems.J Exp Biol. 2018 Jul 4;221(Pt 13):jeb173146. doi: 10.1242/jeb.173146. J Exp Biol. 2018. PMID: 29700060
Cited by
-
Evolution and Expression of the Immune System of a Facultatively Anadromous Salmonid.Front Immunol. 2021 Feb 26;12:568729. doi: 10.3389/fimmu.2021.568729. eCollection 2021. Front Immunol. 2021. PMID: 33717060 Free PMC article.
-
Crosstalk between Growth and Osmoregulation of GHRH-SST-GH-IGF Axis in Triploid Rainbow Trout (Oncorhynchus mykiss).Int J Mol Sci. 2022 Aug 4;23(15):8691. doi: 10.3390/ijms23158691. Int J Mol Sci. 2022. PMID: 35955823 Free PMC article.
-
Environment and genotype predict the genomic nature of domestication of salmonids as revealed by gene expression.Proc Biol Sci. 2022 Dec 14;289(1988):20222124. doi: 10.1098/rspb.2022.2124. Epub 2022 Dec 7. Proc Biol Sci. 2022. PMID: 36475438 Free PMC article. Review.
-
Recurrent expansions of B30.2-associated immune receptor families in fish.Immunogenetics. 2022 Feb;74(1):129-147. doi: 10.1007/s00251-021-01235-4. Epub 2021 Dec 1. Immunogenetics. 2022. PMID: 34850255
-
Comparative Transcriptomic Analysis Reveals the Regulated Expression Profiles in Oreochromis niloticus in Response to Coinfection of Streptococcus agalactiae and Streptococcus iniae.Front Genet. 2022 Mar 3;13:782957. doi: 10.3389/fgene.2022.782957. eCollection 2022. Front Genet. 2022. PMID: 35309129 Free PMC article.
References
-
- Doyle RW. An approach to the quantitative analysis of domestication selection in aquaculture. Aquaculture. 1983;33(1):167–185. doi: 10.1016/0044-8486(83)90398-8. - DOI
-
- Bilio M. Controlled reproduction and domestication in aquaculture—The current state of the art, Part I. Aquac Eur. 2007;32:5–14.
MeSH terms
Substances
Grants and funding
LinkOut - more resources
Full Text Sources
Miscellaneous
