. 2019 Dec 27;9(1):19843.
doi: 10.1038/s41598-019-56296-z.

The spectraplakin Dystonin antagonizes YAP activity and suppresses tumourigenesis

Affiliations

The spectraplakin Dystonin antagonizes YAP activity and suppresses tumourigenesis

Praachi B Jain et al. Sci Rep. .

Abstract

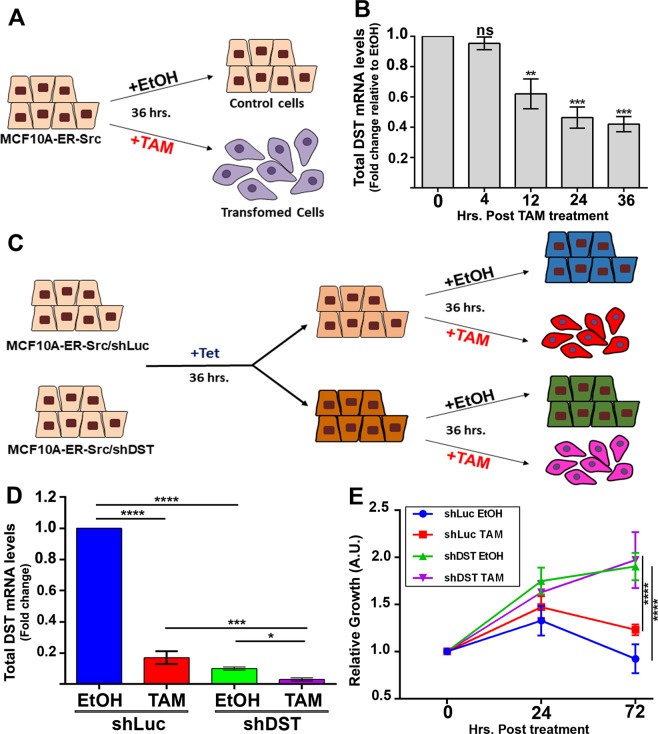
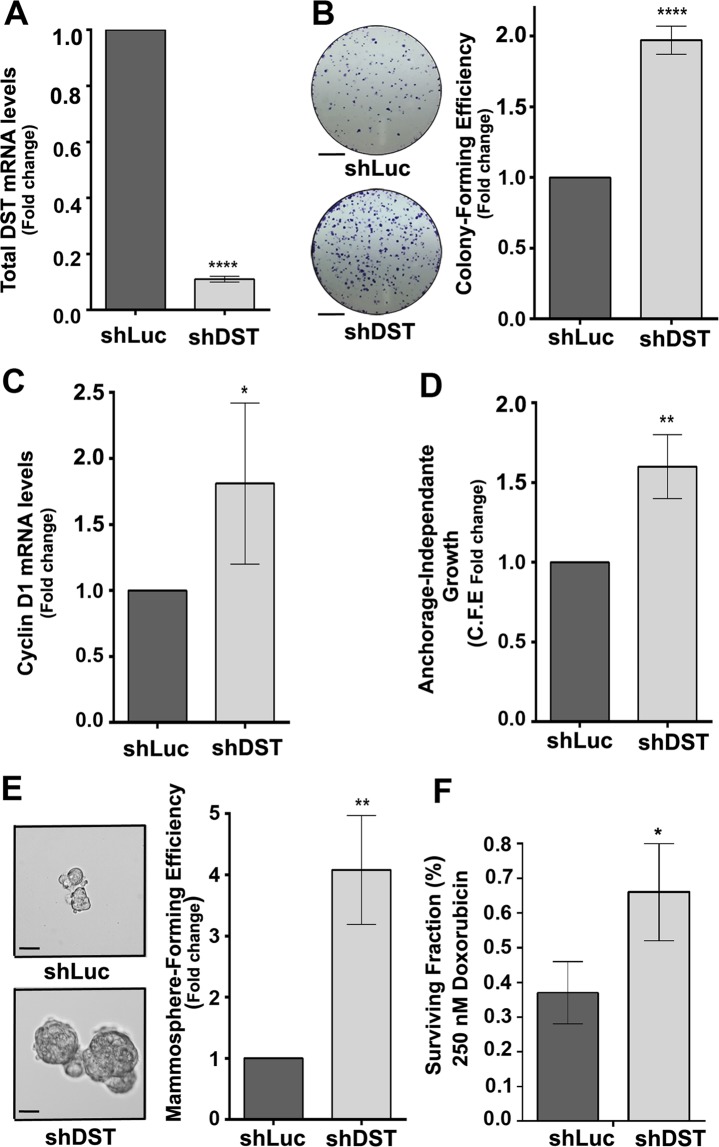
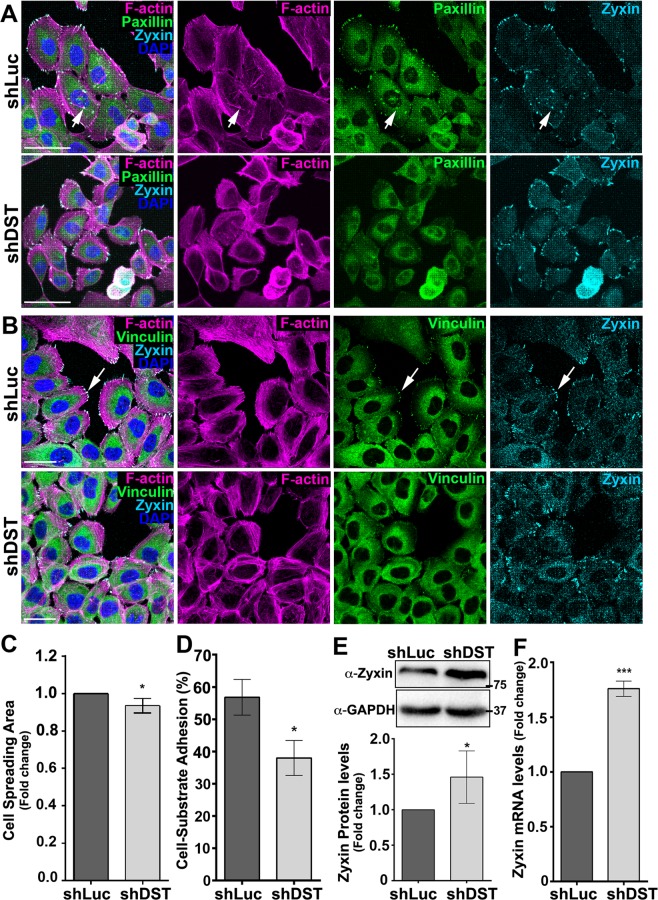
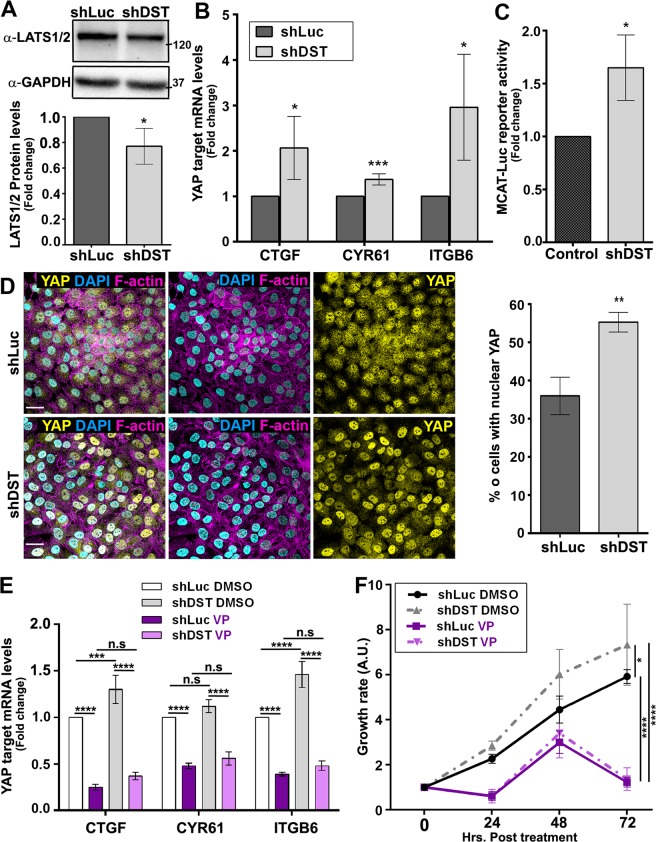
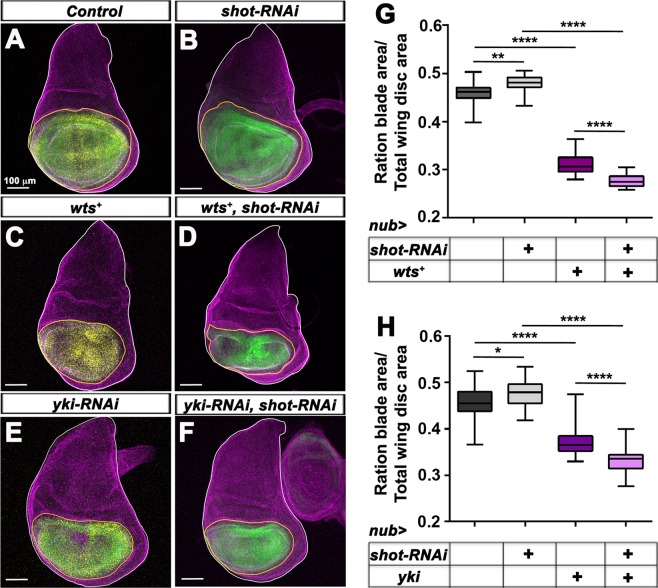
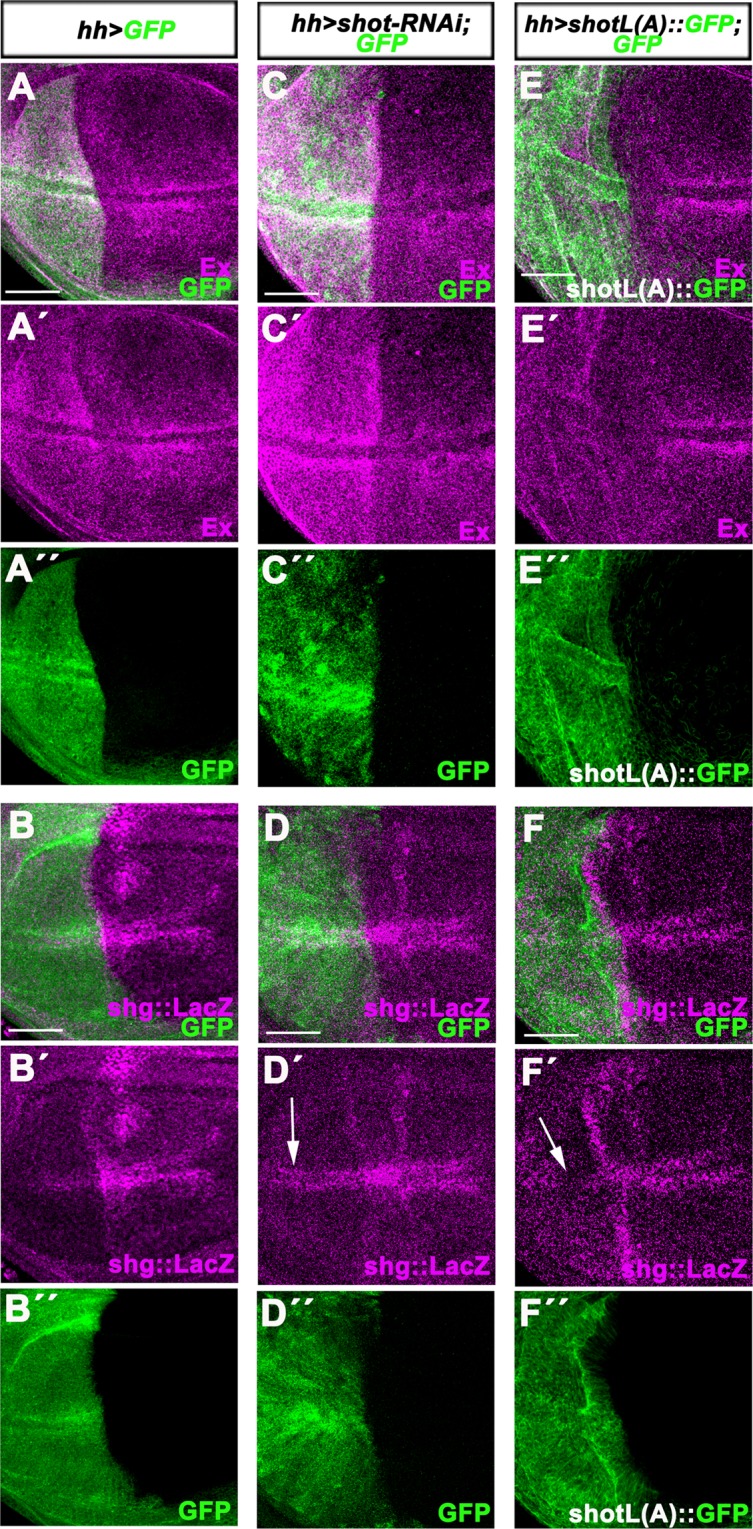
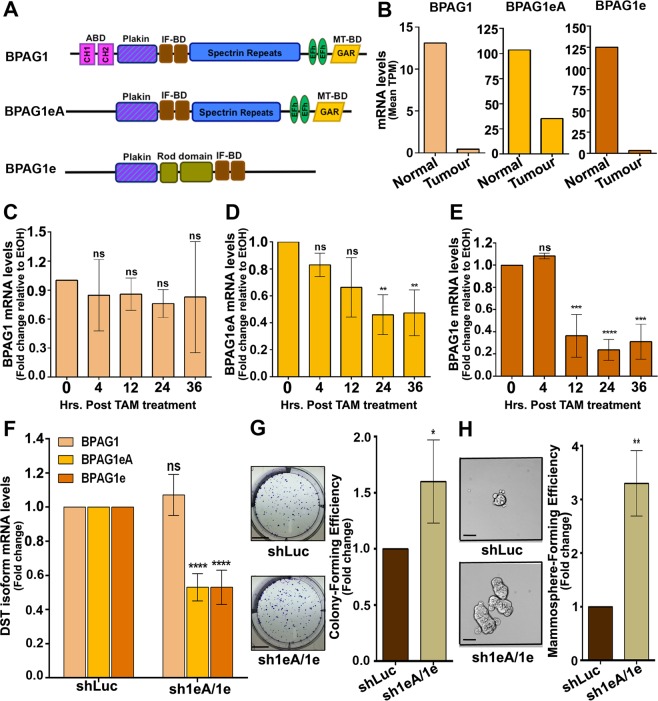
Aberrant expression of the Spectraplakin Dystonin (DST) has been observed in various cancers, including those of the breast. However, little is known about its role in carcinogenesis. In this report, we demonstrate that Dystonin is a candidate tumour suppressor in breast cancer and provide an underlying molecular mechanism. We show that in MCF10A cells, Dystonin is necessary to restrain cell growth, anchorage-independent growth, self-renewal properties and resistance to doxorubicin. Strikingly, while Dystonin maintains focal adhesion integrity, promotes cell spreading and cell-substratum adhesion, it prevents Zyxin accumulation, stabilizes LATS and restricts YAP activation. Moreover, treating DST-depleted MCF10A cells with the YAP inhibitor Verteporfin prevents their growth. In vivo, the Drosophila Dystonin Short stop also restricts tissue growth by limiting Yorkie activity. As the two Dystonin isoforms BPAG1eA and BPAG1e are necessary to inhibit the acquisition of transformed features and are both downregulated in breast tumour samples and in MCF10A cells with conditional induction of the Src proto-oncogene, they could function as the predominant Dystonin tumour suppressor variants in breast epithelial cells. Thus, their loss could deem as promising prognostic biomarkers for breast cancer.


Conflict of interest statement

All authors of this manuscript declare that they have no conflict of interest and no competing financial interests in relation to the work described. The material of this work is original research, has not been previously published and has not been submitted for publication elsewhere while under consideration.

Figures

Figure 1
Figure 1
DST is downregulated by Src and limits Src-induced cell growth. (A) Schematic of the experimental design to analyse the effect of Src activation on DST mRNA levels. In contrast to MCF10A-ER-Src cells treated with EtOH, those treated with TAM for 36 hours acquire transformed features,,. (B) Ratio of total DST mRNA levels between TAM- and EtOH-treated MCF10A-ER-Src cells for the same time points (0, 4, 12, 24 and 36 hours), normalized to GAPDH. Data are from three biological replicates performed in triplicates. (C) Schematic of the experimental design to analyse the effect of reducing further DST levels in MCF10A cells with conditional Src induction. MCF10A-ER-Src cells stably transfected with shDST or shLuc were treated with Tet for 36 hours and with EtOH or TAM for an additional 36 hours. (D) Total DST mRNA levels on extracts from MCF10A-ER-Src/shLuc or MCF10A-ER-Src/shDST treated with Tet for 36 hours and with EtOH or TAM for an additional 36 hours. Data are from three biological replicates performed in triplicates. (E) Time course of growth rate for MCF10A-ER-Src/shLuc or MCF10A-ER-Src/shDST before treatment (0 hours post-treatment) or treated with Tet for 24 hours (24 hours post-treatment) or treated with Tet for 36 hours and with EtOH or TAM for an additional 36 hours (72 hours post-treatment). A.U. Arbitrary Unit. Data are from three biological replicates performed in triplicates. For all quantifications, error bars indicate SD; ns indicates non-significant; *indicates P < 0.05; **indicates P < 0.005; ***indicates P < 0.001; ****indicates P < 0.0001.
Figure 2
Figure 2
Knocking down DST is sufficient to induce the acquisition of transformed features to MCF10A cells. (A) Fold change of total DST mRNA levels between shLuc- and shDST-expressing MCF10A cells, normalized to GAPDH. Data are from four biological replicates performed in triplicates. (B) (left panels) Representative images of colonies from shLuc- or shDST-expressing MCF10A cells grown in clonogenic assays. Scale bars represent 5 mm. (Right panel) Fold change in colony-forming efficiency between shLuc- and shDST-expressing MCF10A cells. Data are from three biological replicates performed in triplicates. (C) Fold change in Cyclin D1 mRNA levels between shLuc- and shDST-expressing MCF10A cells. Data are from four biological replicates performed in triplicates. (D) Fold change in colony-forming efficiency (C.F.E.) between shLuc- and shDST-expressing MCF10A cells grown in soft agar. Data are from three biological replicates performed in triplicates. (E) (Left panels) Representative images of shLuc- or shDST-expressing MCF10A mammospheres. Scale bars represent 50 μm. (Right panel) Fold change in mammosphere-forming efficiency between shLuc- and shDST-expressing MCF10A cells. Data are from three biological replicates performed in triplicates. (F) Percentage (%) of surviving shLuc- or shDST-expressing MCF10A cells, treated with 250 nM of Doxorubicin. Data are from three biological replicates performed in triplicates. For all quantifications, error bars indicate SD.; *indicates P < 0.05; **indicates P < 0.005; ****indicates P < 0.0001.
Figure 3
Figure 3
Knocking down DST affects FAs and cell-substratum adhesion. (A,B) Standard confocal sections of shLuc- or shDST-expressing MCF10A cells, stained with Phalloidin (Magenta) to mark F-actin, DAPI (Blue) to mark nuclei, anti-Zyxin (Cyan blue) and (A) anti-Paxillin (Green) or (B) anti-Vinculin. Scale bars represent (A) 50 µm or (B) 30 µm. (C) Fold change in cell spreading area between shLuc- and shDST-expressing MCF10A cells. Data are from three biological replicates performed in triplicates. A total of 1099 and 948 shLuc- and shDST-expressing cells, respectively, were quantified (D) Percentage (%) of shLuc- or shDST-expressing MCF10A cells adhering to the substratum. Data are from three biological replicates performed in triplicates. (E) (Upper panels) Western blots on protein extracts from shLuc- or shDST-expressing MCF10A cells, blotted with anti-Zyxin (upper bands) or anti-GAPDH (lower bands). (Lower panels) Ratio of Zyxin levels between shLuc- and shDST-expressing MCF10A cells, normalized to GAPDH. Data are three four biological replicates. (F) Fold change in Zyxin mRNA levels between shLuc- and shDST-expressing MCF10A cells. Data are from three biological replicates, performed in triplicate. For all quantifications, error bars indicate SD.; *indicates P < 0.05; ***indicates P < 0.001.
Figure 4
Figure 4
Knocking down DST enhances YAP activity. (A) (Upper panels) Western blots on protein extracts from shLuc- or shDST-expressing MCF10A cells, blotted with anti-LATS1/2 (upper bands) or anti-GAPDH (lower bands). (Lower panels) Ratio of LATS1/2 levels between shLuc- and shDST-expressing MCF10A cells, normalized to GAPDH. Data are from three biological replicates. (B) Fold changes in CTGF or CYR61 or ITGB6 mRNA levels between shLuc- and shDST-expressing MCF10A cells. Data are from four biological replicates, performed in triplicates. (C) Fold changes in Luciferase activity between untreated MCF10A-shLuc cells and Tet-treated MCF10A-shDST cells, transfected with the YAP/TAZ-responsive MCAT-Luc reporter gene. Data are from three biological replicates, performed in triplicates. (D) (Left panels) Standard confocal sections of shLuc- or shDST-expressing MCF10A cells, stained with Phallodin (Magenta) to mark F-actin, anti-YAP (Yellow) and anti-Lamin (Blue) to mark the nuclear membrane. Scale bars represent 30 µm. (Right panel) quantifications of the percentage (%) of shLuc- or shDST-expressing MCF10A cells in which the ratio of YAP staining is higher in the nucleus than in the cytoplasm. Data are from three biological replicates. A total of 775 and 809 shLuc- and shDST-expressing cells, respectively, were quantified blind twice. (E) Fold changes in CTGF or CYR61 or ITGB6 mRNA levels in shLuc- or shDST-expressing MCF10A cells, treated with DMSO or Verteporfin (VP). Data are from three biological replicates, performed in triplicates. (F) Time course of growth rate for shLuc- or shDST-expressing MCF10A cells, before treatment (0 hours post-treatment) or treated with DMSO or VP for 24, 48 or 36 hours. A.U. Arbitrary Unit. Data are from three biological replicates. For all quantifications, error bars indicate SD.; ns indicates non-significant; *indicates P < 0.05; **indicates P < 0.005; ***indicates P < 0.001; ****indicates P < 0.0001.
Figure 5
Figure 5
Overexpressing wts or knocking down yki suppresses the overgrowth of distal wing discs knocked down for shot. (A–F) standard confocal sections of third instar wing imaginal discs from females with dorsal up in which nub-Gal4 drives (A) UAS-GFP (green), UAS-mCherry (yellow) and UAS-RFP (yellow) or (B) two copies of UAS-GFP (green) and UAS-shot-RNAi or (C) UAS-mCherry (yellow), UAS-RFP (yellow) and UAS-Myc::wts (wts+) or (D) UAS-GFP (green), UAS-shot-RNAi and UAS-Myc::wts (wts+) or (E) UAS-GFP (green), UAS-mCherry (yellow) and UAS-yki-RNAi or (F) UAS-GFP (green), UAS-shot-RNAi and UAS-yki-RNAi. Discs are stained with anti-Disc large (Dlg) (magenta) to outline the disc area. The white lines outline the whole wing disc area. The yellow lines outline the nub > GFP- and/or nub > mCherry; RFP-expressing domains. Scale bars represent 100μm. (G,H) Quantification of the ratio between the GFP- or mCherry-expressing area and the total wing disc area in discs expressing the indicated UAS constructs under nub-Gal4. (G) 23 samples were analysed for nub > GFP, mCherry, RFP. 28 samples were analysed for nub > 2XGFP, shot-RNAi. 23 samples were analysed for nub > mCherry, RFP, wts+. 20 samples were analysed for nub > GFP, shot-RNAi, wts+. (H) 24 samples were analysed for nub > GFP, mCherry, RFP. 28 samples were analysed for nub > 2XGFP, shot-RNAi. 30 samples were analysed for nub > GFP, mCherry, yki-RNAi. 28 samples were analysed for nub > GFP, shot-RNAi, yki-RNAi. Error bars indicate SD. *indicates P < 0.05, **indicates P < 0.001, ****indicates P < 0.0001.
Figure 6
Figure 6
Knocking down or overexpressing shot in the distal wing disc epithelium affects the expression of Yki target genes. All panels show standard confocal sections of third instar wing imaginal discs with posterior to the left and dorsal up in which hh-Gal4 drives (A-A,B-B) UAS-GFP (green in A,A′,B,B′) or (C-C,D-D) UAS-GFP (green in C,C″, D,D″) and UAS-shot-RNAi or (E-E,F-F) UAS-shotL(A)::GFP (green in E,E″,F,F″). Discs are stained with (A-A,C-C,E-E′) anti-Ex (magenta) or (B-B′,D-D′,F-F′) anti-β.galactosidade to reveal shg-LacZ expression (magenta). The white arrows in (D′ and F′) indicate the upregulation or downregulation, respectively, of shg::LacZ in cells flanking the dorsal-ventral boundary. Scale bars represent 50 μm.
Figure 7
Figure 7
BPAG1eA and BPAG1e are downregulated by Src activation and in breast tumours and promote transformation of MCF10A cells when knocked down. (A) Schematic domain representation of the human BPAG1 long isoforms and the two shorter BPAG1eA and BPAG1e isoforms. (B) Median number of Transcripts Per Million (Median TPM) for BPAG1, BPAG1eA and BPAG1e in 114 normal breast tissues or 1097 breast tumour samples. (C–E) Ratio of BPAG1 (C) or BPAG1eA (D) or BPAG1e (E) mRNA levels between TAM- and EtOH-treated MCF10A-ER-Src cells for the same time points (0, 4, 12, 24 and 36 hours), normalized to GAPDH. Data are from three biological replicates, performed in triplicates. (F) Fold change of BPAG1 or BPAG1eA or BPAG1e mRNA levels between shLuc- and shBPAG1eA/1e-expressing MCF10A cells, normalized to GAPDH. Data are from three biological replicates performed in triplicates. (G) (Left panels) Representative images of colonies from shLuc- or shBPAG1eA/1e-expressing MCF10A cells grown in clonogenic assays. Scale bars represent 5 mm. (Right panel) Fold change in colony-forming efficiency between shLuc- and shBPAG1eA/1e-expressing MCF10A cells. Data are from three biological replicates performed in triplicates. (H) (Left panels) Representative images of shLuc- or shBPAG1eA/1e-expressing MCF10A mammospheres. Scale bars represent 50 μm. (Right panel) Fold change in mammosphere-forming efficiency between shLuc- and shBPAG1eA/1e-expressing MCF10A cells. Data are from three biological replicates performed in triplicates. For all quantifications, error bars indicate SD.; ns indicates non-significant; *indicates P < 0.05; **indicates P < 0.005; ***indicates P < 0.001; ****indicates P < 0.0001.

References

    1. Martins D, Schmitt F. Microenvironment in breast tumorigenesis: Friend or foe? Histol. Histopathol. 2019;34:13–24. - PubMed
    1. Byler S, et al. Genetic and epigenetic aspects of breast cancer progression and therapy. Anticancer Res. 2014;34:1071–7. - PubMed
    1. Dai X, Xiang L, Li T, Bai Z. Cancer Hallmarks, Biomarkers and Breast Cancer Molecular Subtypes. J. Cancer. 2016;7:1281–1294. doi: 10.7150/jca.13141. - DOI - PMC - PubMed
    1. Sever R, Brugge JS. Signal transduction in cancer. Cold Spring Harb. Perspect. Med. 2015;5:a006098–a006098. doi: 10.1101/cshperspect.a006098. - DOI - PMC - PubMed
    1. Wu, L. & Yang, X. Targeting the Hippo Pathway for Breast Cancer Therapy. Cancers (Basel). 10 (2018). - PMC - PubMed

Publication types

MeSH terms