Multicenter Study
. 2019 Dec 27;9(1):19880.
doi: 10.1038/s41598-019-56328-8.

Sex and race differences in J-Tend, J-Tpeak, and Tpeak-Tend intervals

Affiliations
Multicenter Study

Sex and race differences in J-Tend, J-Tpeak, and Tpeak-Tend intervals

Katerina Hnatkova et al. Sci Rep. .

Abstract

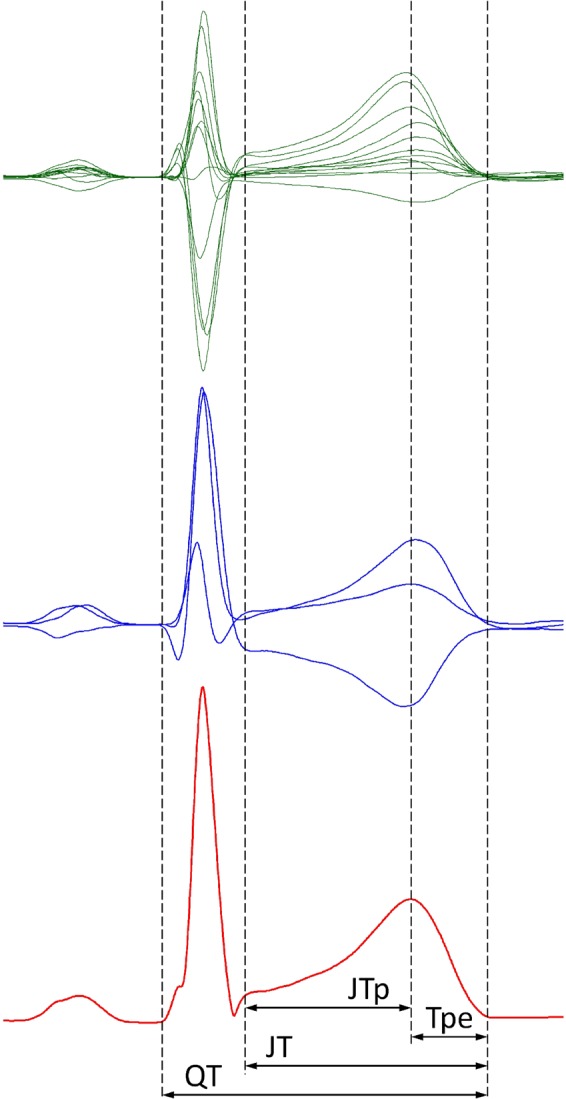
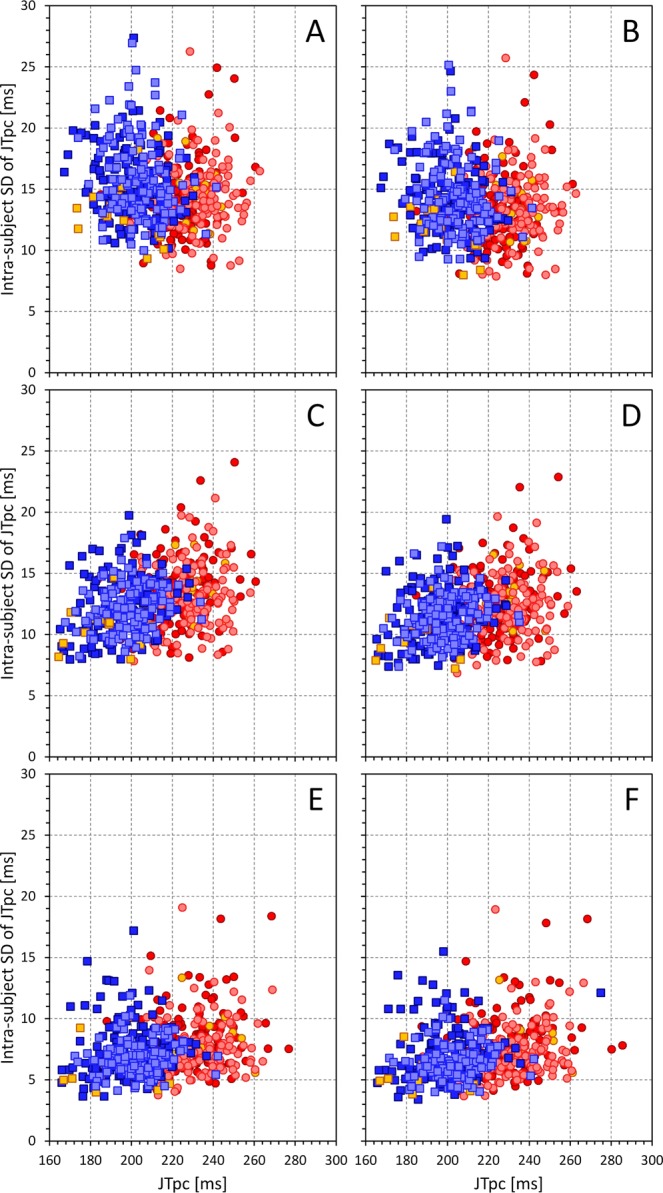
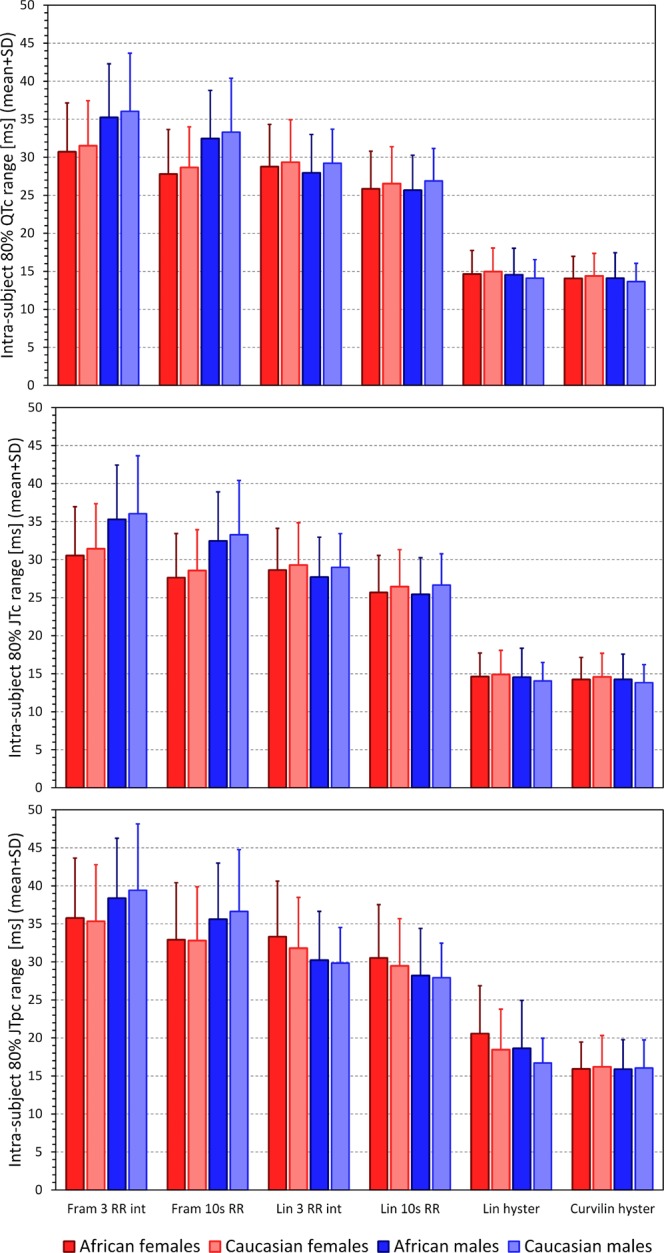
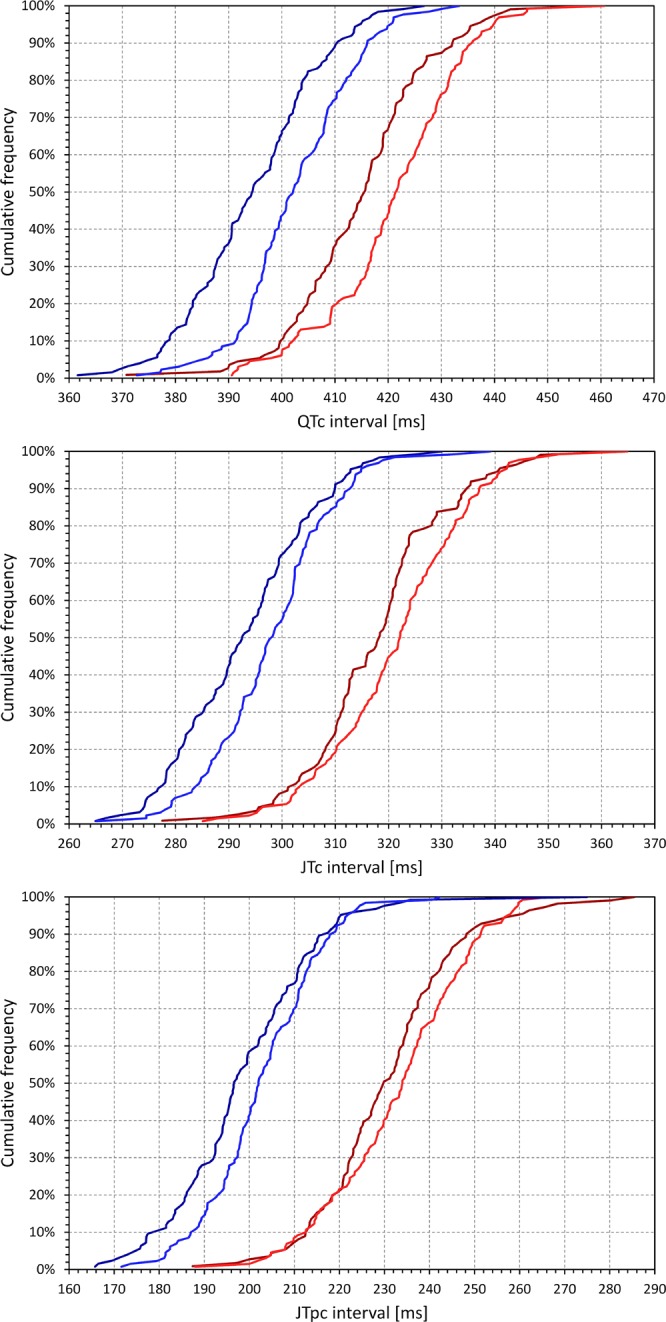
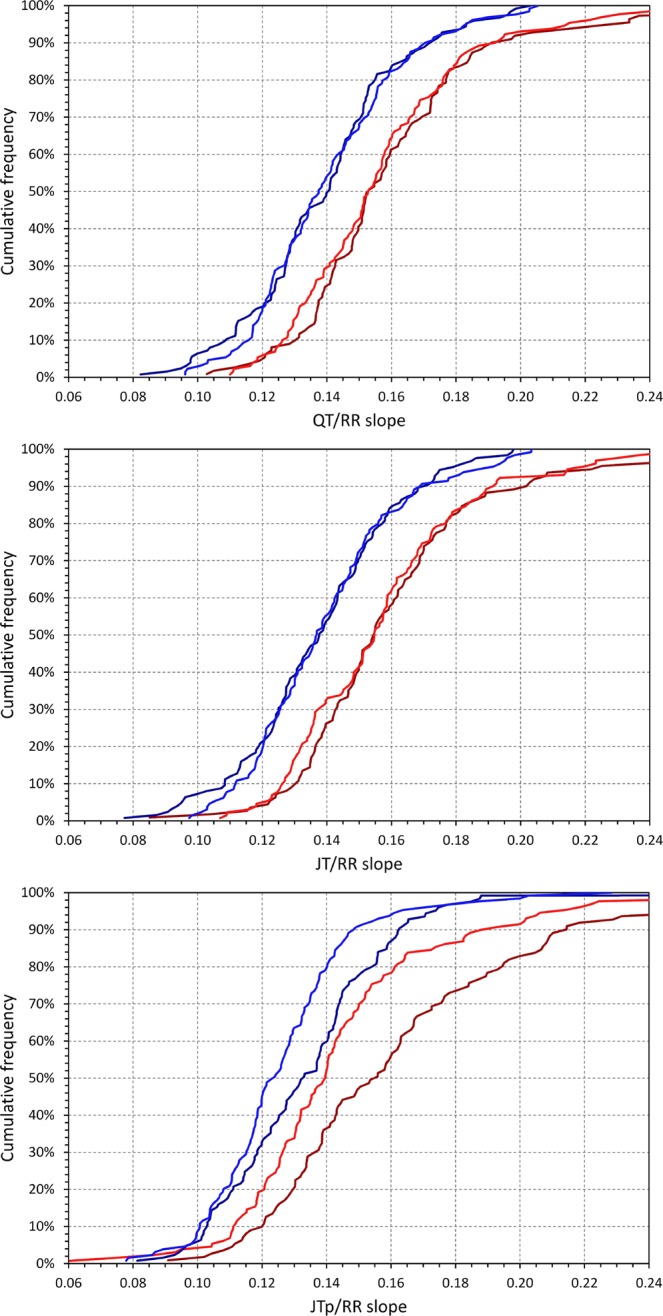
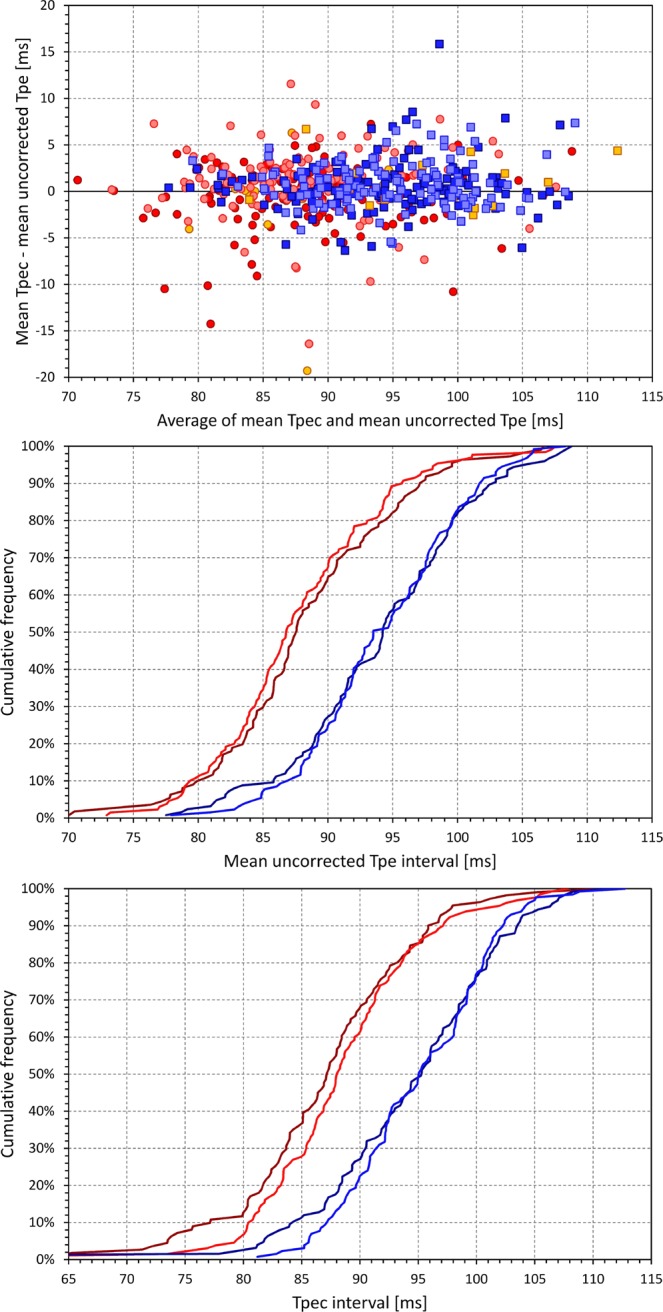
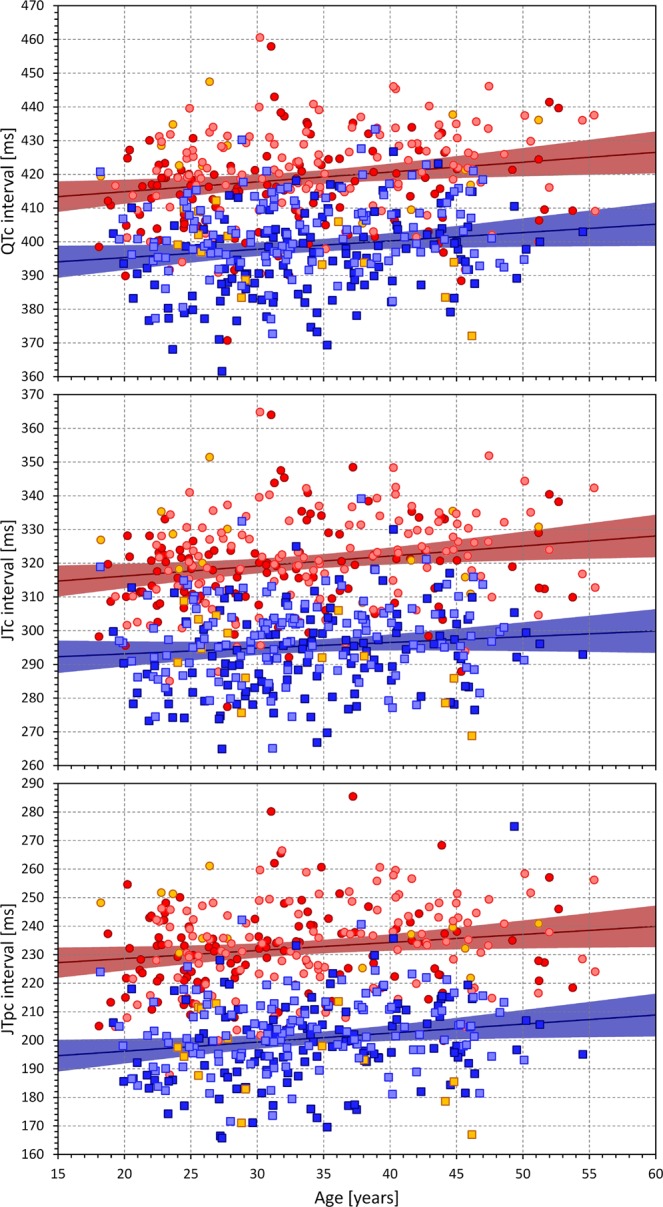
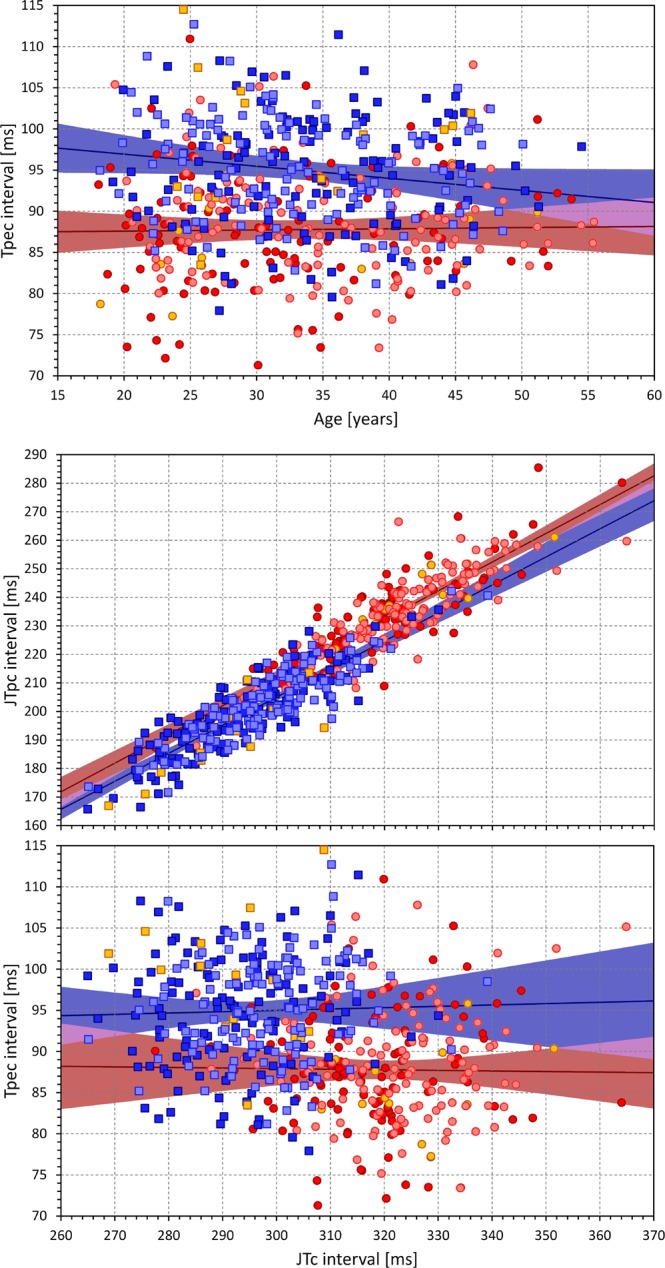
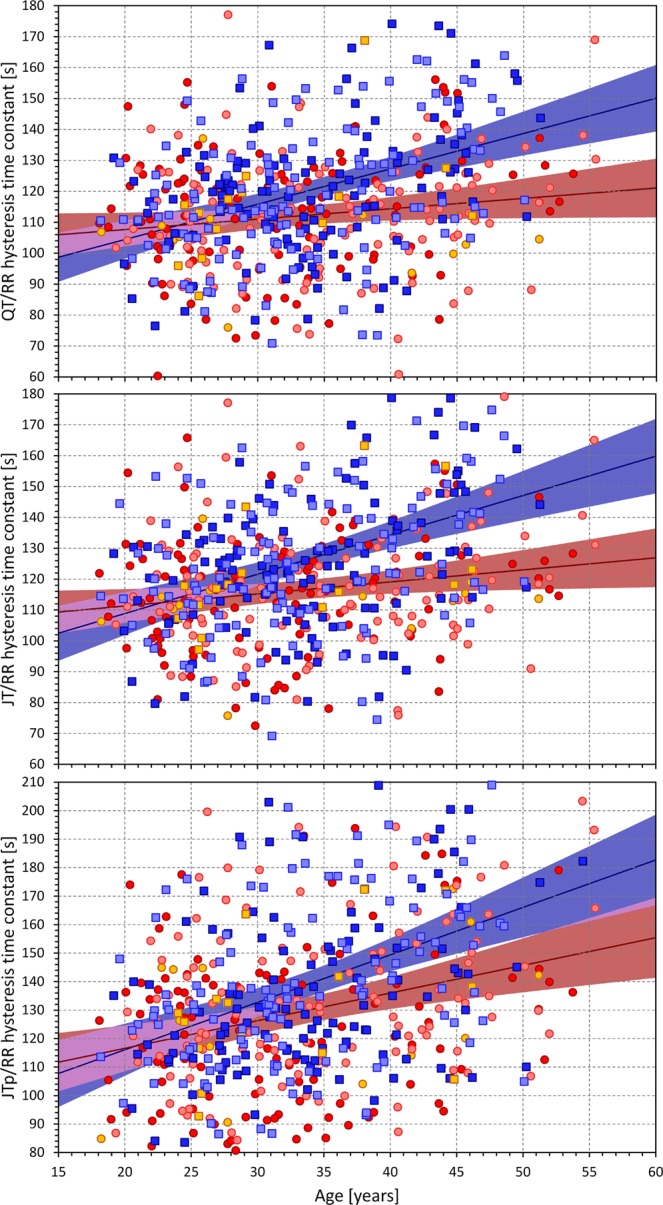
To facilitate the precision of clinical electrocardiographic studies of J-to-Tpeak (JTp) and Tpeak-to-Tend (Tpe) intervals, the study investigated their differences between healthy females and males, and between subjects of African and Caucasian origin. In 523 healthy subjects (254 females; 236 subjects of African origin), repeated Holter recordings were used to measure QT, JT, JTp, and Tpe intervals preceded by both stable and variable heart rates. Subject-specific curvilinear regression models were used to obtain individual QTc, JTc, JTpc and Tpec intervals. Rate hysteresis, i.e., the speed with which the intervals adapted after heart rate changes, was also investigated. In all sex-race groups, Tpe intervals were not systematically heart rate dependent. Similar to QTc intervals, women had JTc, and JTpc intervals longer than males (difference 20-30 ms, p < 0.001). However, women had Tpec intervals (and rate uncorrected Tpe intervals) shorter by approximately 10 ms compared to males (p < 0.001). Subjects of African origin had significantly shorter QTc intervals than Caucasians (p < 0.001). Gradually diminishing race-difference was found for JTc, JTpc and Tpec intervals. JTc and JTpc were moderately increasing with age but Tpe/Tpec were not. Rate hysteresis of JTp was approximately 10% longer compared to that of JT (p < 0.001). In future clinical studies, Tpe interval should not be systematically corrected for heart rate and similar to the QT interval, the differences in JT, JTp and Tpe intervals should be corrected for sex. The differences in QT and JT, and JTp intervals should also be corrected for race.


Conflict of interest statement

The authors declare no competing interests.

Figures

Figure 1
Figure 1
Schema of the ECG interval measurement. The top green panel shows the representative beatforms of all 12 ECG leads superimposed on the same isoelectric axis. The middle blue panel shows the derived orthogonal XYZ leads. The bottom red panel shows the vector magnitude of the orthogonal XYZ leads. The vertical dashed lines show the positions of QRS onset, QRS offset (J point), T wave peak, and T wave offset. The interval measurements are shown below the bottom panel. Note that while the 3 panels are synchronised along the horizontal time axis, the scales of the vertical axes are different for the panels. Note also in the top panel that the position of the T wave peak is slightly lead dependent.
Figure 2
Figure 2
Summary of intra-subject standard deviations of QTc (top panel), JTc (middle panel) and JTpc (bottom panel) intervals obtained with Framingham formula using the average of last 3 RR interval preceding the interval measurement (Fram 3 RR int), Framingham formula using the 10-second average of RR intervals (Fram 10 s RR), subject-specific linear formula using the average of last 3 RR interval preceding the interval measurement (Lin 3 RR int), subject-specific linear formula using the 10-second average of RR intervals (Lin 10 s RR), subject-specific linear formula using universal rate hysteresis correction (Lin hyster), and curvilinear subject-specific formula using subject-specific hysteresis correction (Curvilin hyster). The population mean + standard deviations of the intra-subject standard deviations are shown for each of the sex- and race-defined (African vs Caucasian) sub-population. In each of these sub-populations, the intra-subject standard deviations of all the intervals obtained with curvilinear model + hysteresis correction were statistically significantly smaller compared to all other correction possibilities (p < 0.001 for all).
Figure 3
Figure 3
Graphical display of the gradual reduction of the intra-subject standard deviations of JTpc intervals (vertical axes) and of the changes of their intra-subject mean values (horizontal axes) by different rate corrections: Framingham formula using the average of last 3 RR interval preceding the interval measurement (panel A), Framingham formula using the 10-second average of RR intervals (panel B), subject-specific linear formula using the average of last 3 RR interval preceding the interval measurement (panel C), subject-specific linear formula using the 10-second average of RR intervals (panel D), subject-specific linear formula using universal rate hysteresis correction (panel E), and curvilinear subject-specific formula using subject-specific hysteresis correction (panel F). In each panel, the dark red circles, light red circles, amber circles, dark blue squares, light blue squares, and amber squares correspond to the measurements in African females, Caucasian females, other race females, African males, Caucasian males, and other race males, respectively.
Figure 4
Figure 4
Summary of intra-subject 80th-percentile ranges of QTc (top panel), JTc (middle panel) and JTpc (bottom panel) intervals obtained with different rate correction formulas. The layout of the Figure and the meaning of the correction formula labels is the same as in Fig. 2. In each of the study sub-populations, the intra-subject 80th-percentile ranges of all the intervals obtained with curvilinear model + hysteresis correction were statistically significantly smaller compared to all other correction possibilities (p < 0.001 for all).
Figure 5
Figure 5
Cumulative distributions of QTc (top panel), JTc (middle panel), and JTpc (bottom panel) intervals in the investigated population. In each panel, the dark red, light red, dark blue, and light blue lines correspond to the measurements in African females, Caucasian females, African males, and Caucasian males, respectively. The data of subjects of other races are not shown.
Figure 6
Figure 6
Cumulative distributions of QT/RR (top panel), JT/RR (middle panel), and JTp/RR (bottom panel) slopes of the curvilinear regression models in the investigated population. In each panel, the dark red, light red, dark blue, and light blue lines correspond to the measurements in African females, Caucasian females, African males, and Caucasian males, respectively. The data of subjects of other races are not shown.
Figure 7
Figure 7
Top panel shows the Bland-Altman-like scatter diagram comparing intra-subject Tpec and uncorrected Tpe intervals. Their average is shown on the horizontal axis and their difference on the vertical axis. The dark red circles, light red circles, amber circles, dark blue squares, light blue squares, and amber squares correspond to the measurements in African females, Caucasian females, other race females, African males, Caucasian males, and other race males, respectively. The middle and bottom panels show cumulative distributions of Tpe (middle panel) and Tpec (bottom panel) intervals in the investigated population. In these panels, the dark red, light red, dark blue, and light blue lines correspond to the measurements in African females, Caucasian females, African males, and Caucasian males, respectively. The data of subjects of other races are not shown in the middle and bottom panels.
Figure 8
Figure 8
Age dependency of QTc (top panel), JTc (middle panel), and JTpc (bottom panel) intervals in the investigated population. In each panel, the dark red circles, light red circles, amber circles, dark blue squares, light blue squares, and amber squares correspond to the measurements in African females, Caucasian females, other race females, African males, Caucasian males, and other race males, respectively. In each panel, the solid red and solid blue lines show the linear regressions between the measured intervals and age in all females and all males, respectively. The red shaded and blue shaded areas are the 95% confidence intervals of the regression lines.
Figure 9
Figure 9
The top panel shows the age dependency of the Tpec intervals. The middle and bottom panels show the relationship between the JTpc (middle panel) and Tpec (bottom panel) and JTc intervals. The layout of the graphs and the meaning of the symbols are the same as in Fig. 8 (in the middle and bottom panel, linear regressions were calculated between the compared ECG intervals). The violet areas are the overlaps between the confidence intervals of the sex-specific regressions.
Figure 10
Figure 10
Age dependency of the QT/RR (top panel) JT/RR (middle panel) and JTp/RR (bottom panel) hysteresis time constants. The layout of the graphs and the meaning of the symbols are the same as in Fig. 8. The violet areas are the overlaps between the confidence intervals of the sex-specific regressions.

References

    1. Malik M, Huikuri H, Lombardi F, Schmidt G, Zabel M. Conundrum of the Tpeak-Tend interval. J. Cardiovasc. Electrophysiol. 2018;29:767–770. doi: 10.1111/jce.13474. - DOI - PubMed
    1. Tse G, et al. The Tpeak - Tend interval as an electrocardiographic risk marker of arrhythmic and mortality outcomes: A systematic review and meta-analysis. Heart Rhythm. 2017;14:1131–1137. doi: 10.1016/j.hrthm.2017.05.031. - DOI - PubMed
    1. O’Neal, W. T. et al. Association between QT-interval components and sudden cardiac death: The ARIC study (Atherosclerosis Risk in Communities). Circ. Arrhythm. Electrophysiol. 10, 10.1161/circep.117.005485 (2017). - PMC - PubMed
    1. Johannesen L, et al. Differentiating drug-induced multichannel block on the electrocardiogram: randomized study of dofetilide, quinidine, ranolazine, and verapamil. Clin. Pharmacol. Ther. 2014;96:549–558. doi: 10.1038/clpt.2014.155. - DOI - PubMed
    1. Johannesen L, et al. Ability of late sodium or calcium current block to balance the ECG effects of potassium current block. Clin. Pharmacol. Ther. 2016;99:214–223. doi: 10.1002/cpt.205. - DOI - PMC - PubMed

Publication types