

New statistical method identifies cytokines that distinguish stool microbiomes
- PMID: 31882682
- PMCID: PMC6934614
- DOI: 10.1038/s41598-019-56397-9
New statistical method identifies cytokines that distinguish stool microbiomes
Abstract
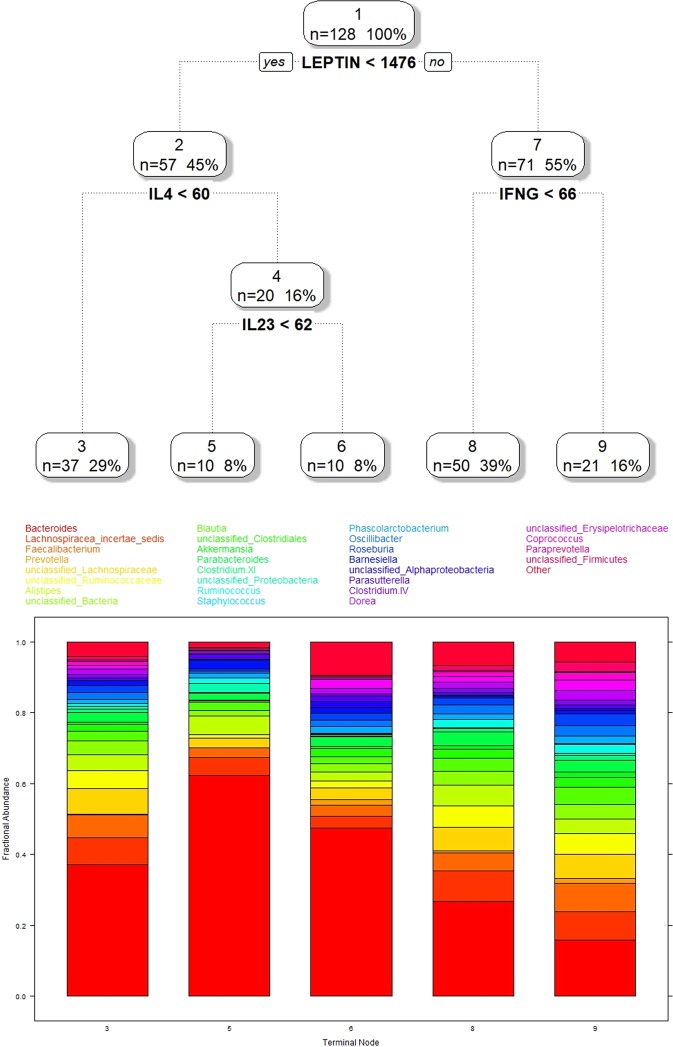
Regressing an outcome or dependent variable onto a set of input or independent variables allows the analyst to measure associations between the two so that changes in the outcome can be described by and predicted by changes in the inputs. While there are many ways of doing this in classical statistics, where the dependent variable has certain properties (e.g., a scalar, survival time, count), little progress on regression where the dependent variable are microbiome taxa counts has been made that do not impose extremely strict conditions on the data. In this paper, we propose and apply a new regression model combining the Dirichlet-multinomial distribution with recursive partitioning providing a fully non-parametric regression model. This model, called DM-RPart, is applied to cytokine data and microbiome taxa count data and is applicable to any microbiome taxa count/metadata, is automatically fit, and intuitively interpretable. This is a model which can be applied to any microbiome or other compositional data and software (R package HMP) available through the R CRAN website.
Conflict of interest statement
The authors declare no competing interests.
Figures
References
-
- Harrell, F. E. Regression modeling strategies: with applications to linear models, logistic regression, and survival analysis. (Springer, 2001).
MeSH terms
Substances
LinkOut - more resources
Full Text Sources
Medical
