

Smartphone-based turbidity reader
- PMID: 31882742
- PMCID: PMC6934863
- DOI: 10.1038/s41598-019-56474-z
Smartphone-based turbidity reader
Abstract
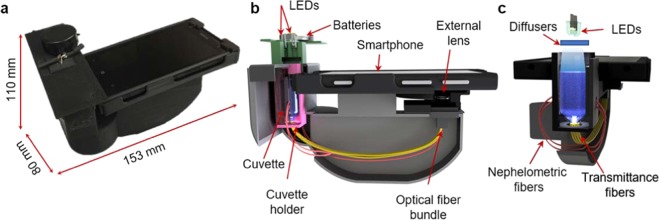
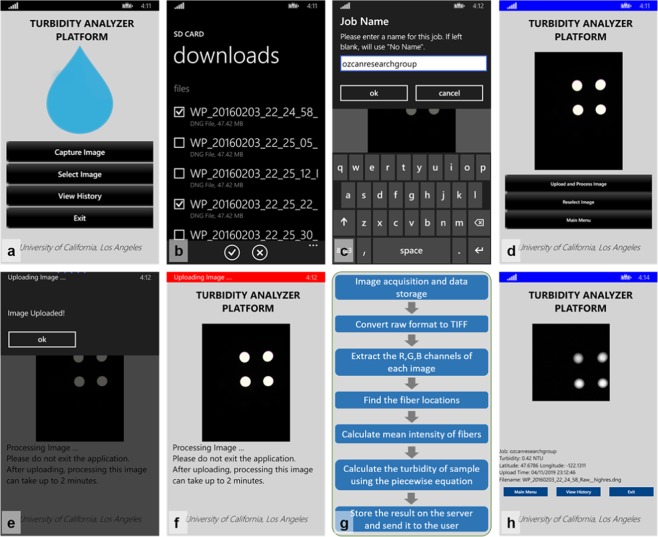
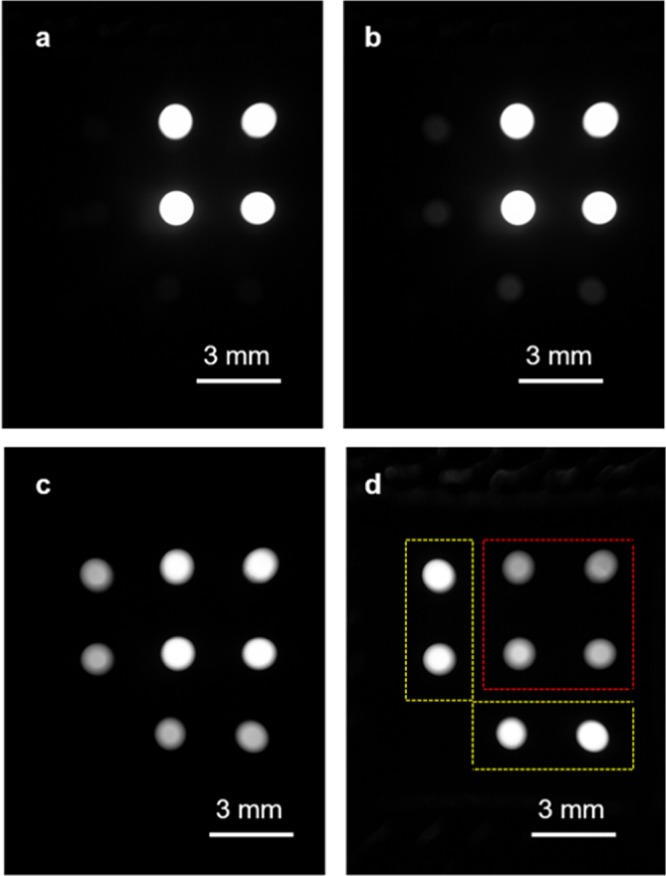
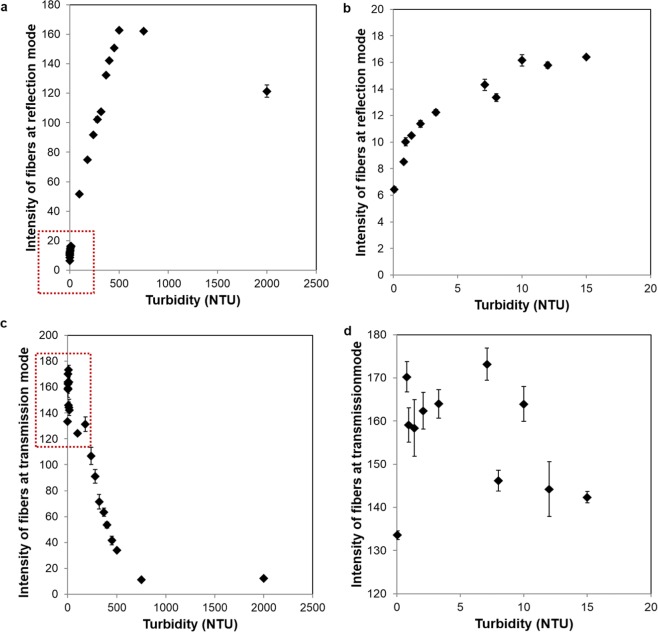
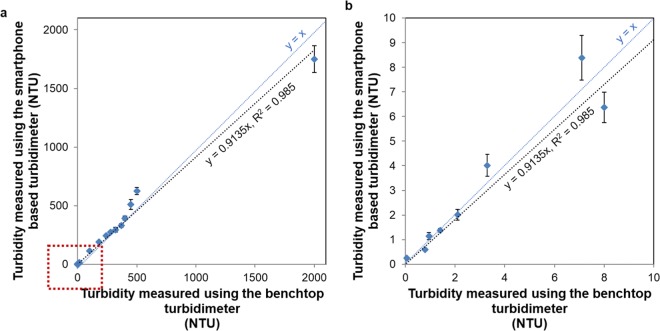
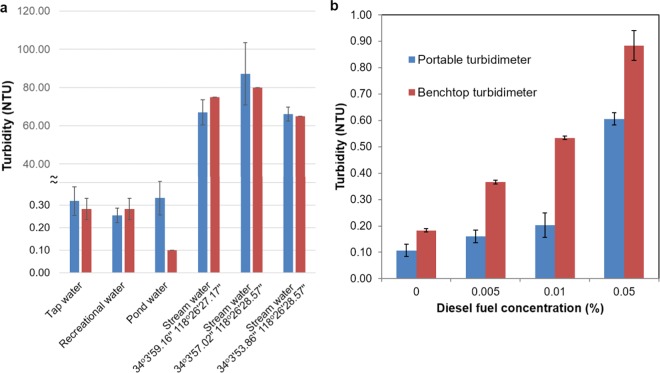
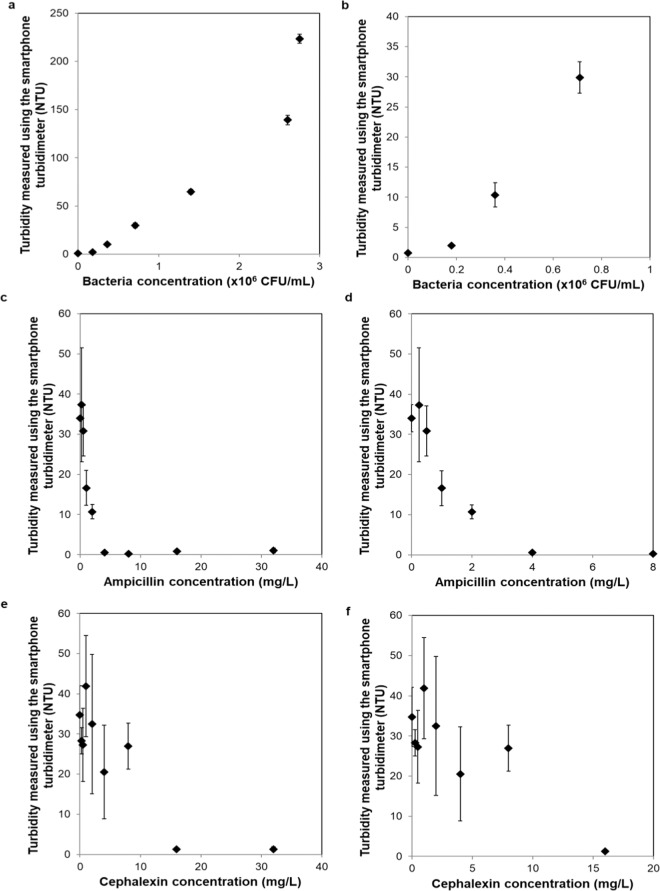
Water quality is undergoing significant deterioration due to bacteria, pollutants and other harmful particles, damaging aquatic life and lowering the quality of drinking water. It is, therefore, important to be able to rapidly and accurately measure water quality in a cost-effective manner using e.g., a turbidimeter. Turbidimeters typically use different illumination angles to measure the scattering and transmittance of light through a sample and translate these readings into a measurement based on the standard nephelometric turbidity unit (NTU). Traditional turbidimeters have high sensitivity and specificity, but they are not field-portable and require electricity to operate in field settings. Here we present a field-portable and cost effective turbidimeter that is based on a smartphone. This mobile turbidimeter contains an opto-mechanical attachment coupled to the rear camera of the smartphone, which contains two white light-emitting-diodes to illuminate the water sample, optical fibers to transmit the light collected from the sample to the camera, an external lens for image formation, and diffusers for uniform illumination of the sample. Including the smartphone, this cost-effective device weighs only ~350 g. In our mobile turbidimeter design, we combined two illumination approaches: transmittance, in which the optical fibers were placed directly below the sample cuvette at 180° with respect to the light source, and nephelometry in which the optical fibers were placed on the sides of the sample cuvette at a 90° angle with respect to the to the light source. Images of the end facets of these fiber optic cables were captured using the smart phone and processed using a custom written image processing algorithm to automatically quantify the turbidity of each sample. Using transmittance and nephelometric readings, our mobile turbidimeter achieved accurate measurements over a large dynamic range, from 0.3 NTU to 2000 NTU. The accurate performance of our smartphone-based turbidimeter was also confirmed with various water samples collected in Los Angeles (USA), bacteria spiked water samples, as well as diesel fuel contaminated water samples. Having a detection limit of ~0.3 NTU, this cost-effective smartphone-based turbidimeter can be a useful analytical tool for screening of water quality in resource limited settings.
Conflict of interest statement
The authors declare no competing interests.
Figures
References
-
- Fraser MW, et al. Effects of dredging on critical ecological processes for marine invertebrates, seagrasses and macroalgae, and the potential for management with environmental windows using Western Australia as a case study. Ecological Indicators. 2017;78:229–242. doi: 10.1016/j.ecolind.2017.03.026. - DOI
-
- Lloyd, D. S., Koenings, J. P. & Laperriere, J. D. Effects of Turbidity in Fresh Waters of Alaska. North American Journal of Fisheries Management7, 18–33, https://doi.org/10.1577/1548-8659(1987)7<18:eotifw>2.0.co;2 (1987).
-
- @PCIGlobal. Access to Clean Water., https://www.pciglobal.org/clean-water/. Last accessed date: 10 April2019 (2019).
Publication types
MeSH terms
Substances
Grants and funding
LinkOut - more resources
Full Text Sources
Other Literature Sources
Miscellaneous
