. 2019 Dec 27;9(1):19963.
doi: 10.1038/s41598-019-56529-1.

Collagen fibrils and proteoglycans of peripheral and central stroma of the keratoconus cornea - Ultrastructure and 3D transmission electron tomography

Affiliations

Collagen fibrils and proteoglycans of peripheral and central stroma of the keratoconus cornea - Ultrastructure and 3D transmission electron tomography

Aljoharah Alkanaan et al. Sci Rep. .

Abstract

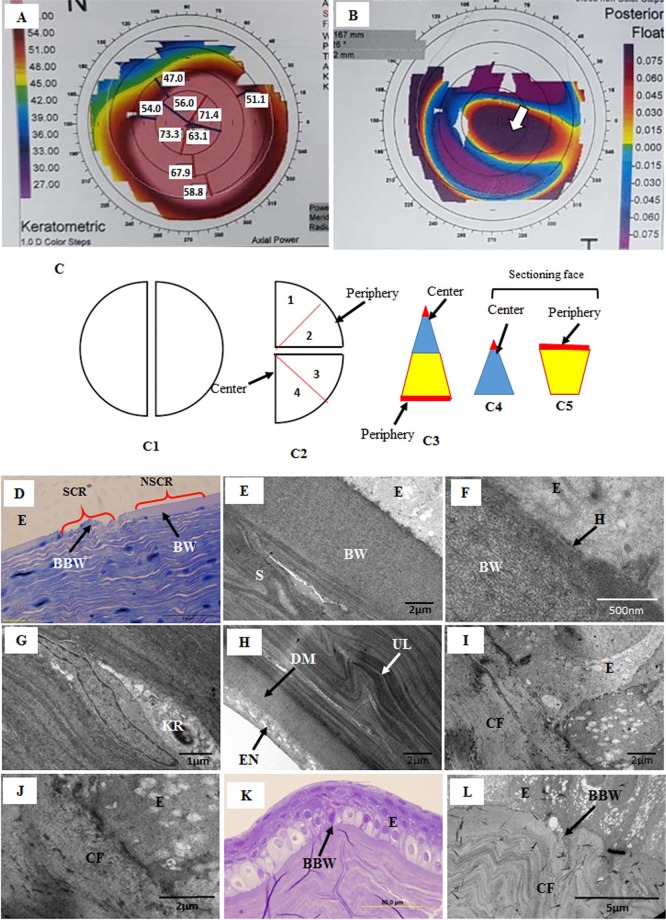
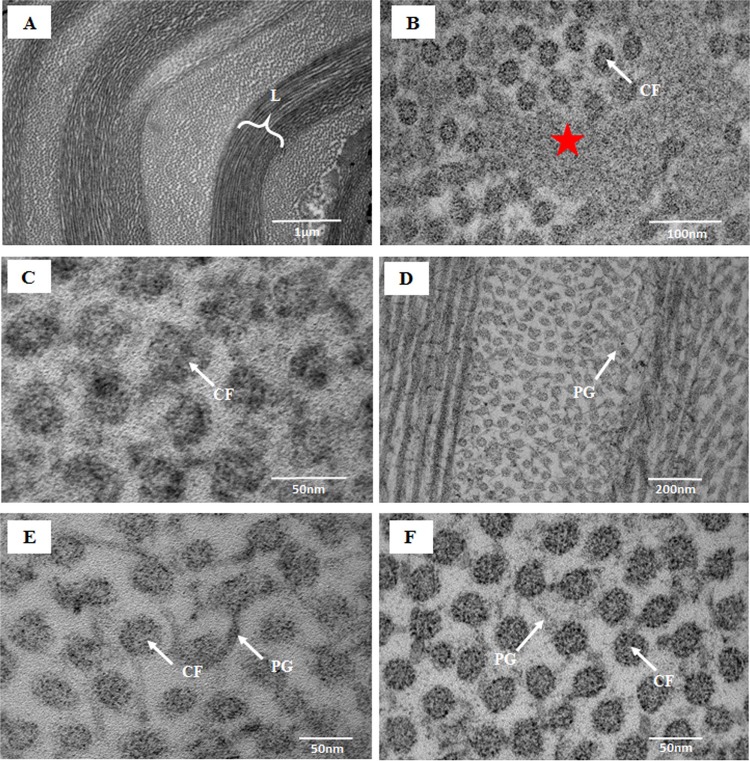
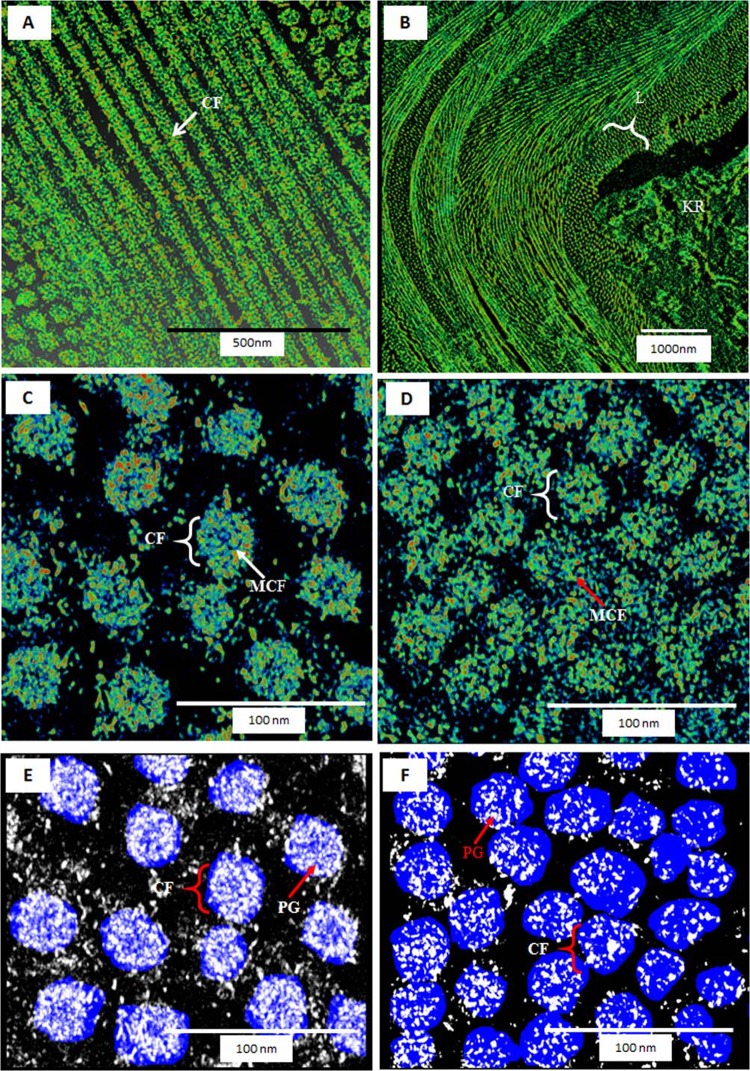
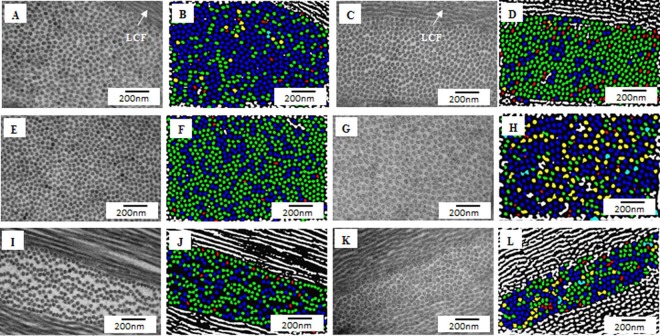
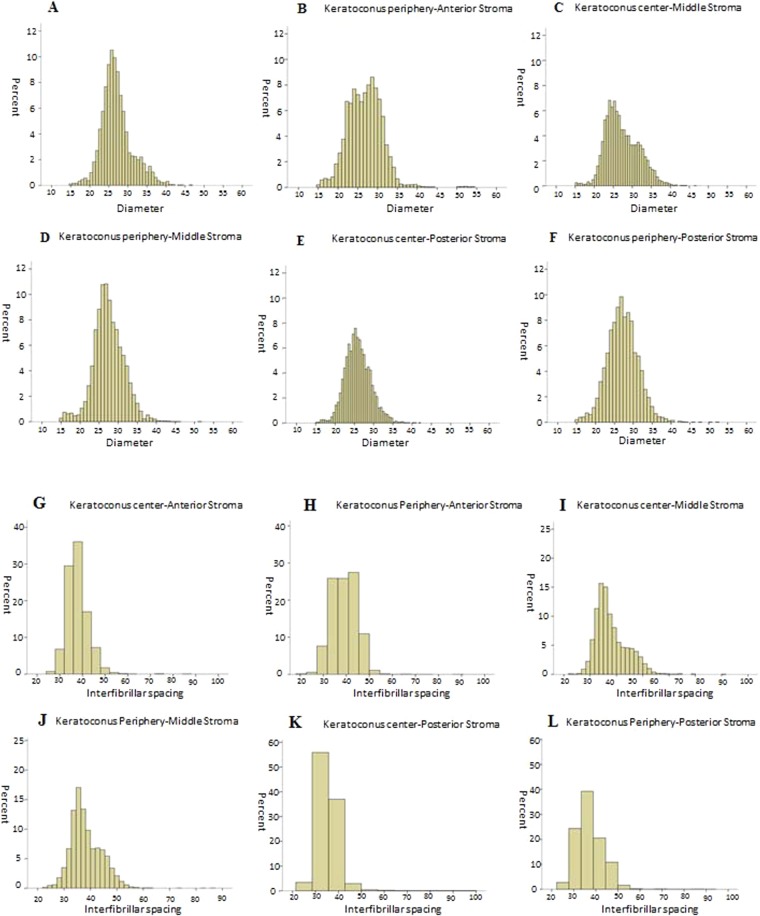
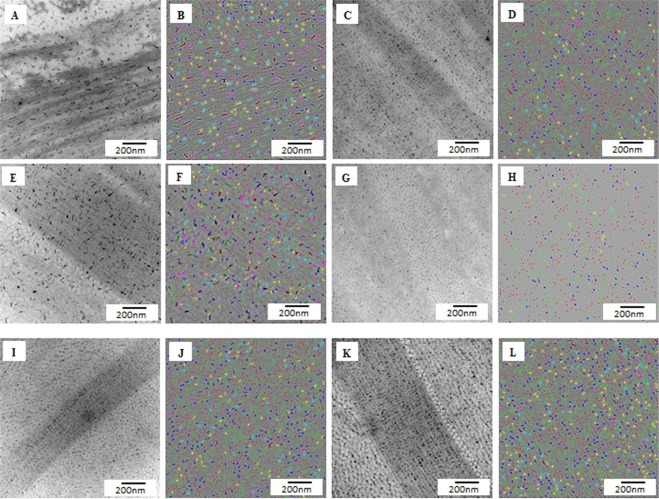
Keratoconus (KC) is a progressive corneal disorder in which vision gradually deteriorates as a result of continuous conical protrusion and the consequent altered corneal curvature. While the majority of the literature focus on assessing the center of this diseased cornea, there is growing evidence of peripheral involvement in the disease process. Thus, we investigated the organization of collagen fibrils (CFs) and proteoglycans (PGs) in the periphery and center of KC corneal stroma. Three-dimensional transmission electron tomography on four KC corneas showed the degeneration of microfibrils within the CFs and disturbance in the attachment of the PGs. Within the KC corneas, the mean CF diameter of the central-anterior stroma was significantly (p ˂ 0.001) larger than the peripheral-anterior stroma. The interfibrillar distance of CF was significantly (p ˂ 0.001) smaller in the central stroma than in the peripheral stroma. PGs area and the density in the central KC stroma were larger than those in the peripheral stroma. Results of the current study revealed that in the pre- Descemet's membrane stroma of the periphery, the degenerated CFs and PGs constitute biomechanically weak lamellae which are prone to disorganization and this suggests that the peripheral stroma plays an important role in the pathogenicity of the KC cornea.


Conflict of interest statement

The authors declare no competing interests.

Figures

Figure 1
Figure 1
(A) Corneal topography axial map showing the extent of the cone (red area); (B) Corneal topography posterior elevation map showing the location of the cone (arrow head); (C) A schematic drawing of the cutting corneal central and peripheral pieces; (1C1) The cornea was divided into two halves; (1C2) Before embedding, the halve of the cornea was divided into two quarters and each quarter was further divided into equal triangle; (1C3) Each triangular piece was cut from the middle into two pieces; (1C4) the conical central part; and (1C5) wider peripheral part. Approximately less than 2 mm distance (red colour) from center point and approximately less than 1 mm distance (red colour) from the margin was used to cut semithin (0.5 µm) and ultrathin (70 nm) sections. (D) Light micrograph of keratoconus cornea showing non-scarred region (NSCR) with a normal Bowman’s layer (BW) and scarred region (SCR) with a break in BW; (E,F) Electron micrograph of non-scarred region (NSCR) shown in Figure A, a normal healthy BW, hemi-desmosome and stroma; (G) Electron micrograph of non-scarred region showing a healthy keratocyte; (H) At the posterior part of the non-scarred region, undulation of the lamellae was present just above the Descemet’s membrane; (I,J) Electron micrograph of scar region (SCR) shown in Figure A, showing break in BW and presence of collagen fibrils below epithelium; (K) Light micrograph of a very large scar region with a BW break; L) Electron micrograph of a large scar region (shown in Figure J), showing breaks in the BW and the presence of CF in the sub-epithelial region. E = Epithelium, BW = Bowman’s layer, BBW = Break in BW, H = Hemi-desmosomes, KR = Keratocyte, S = Stroma, SCR = Scar region, NSCR = Non-scar region.
Figure 2
Figure 2
Electron micrographs of the posterior stroma at the periphery of normal and keratoconus corneas; (A) Undulating lamellae at the pre-Descemet’s membrane of the KC cornea; (B) Electron dens material (red star) in between the degenerated collagen fibrils (CFs) of the undulating lamellae shown in (A) (Osmium tetroxide fixation); (C) Degenerated CFs at the pre-Descemet’s membrane of the KC cornea (Osmium tetroxide fixation); (D,E) Large proteoglycans (PGs) around the CF in the posterior stromal lamellae of KC cornea (Cuprolinic + glutaraldehyde fixation); (F) Organised CF connected by PGs in the posterior stroma of the normal cornea. CF = Collagen fibrils, PG = Proteoglycan, L = Undulating lamellae.
Figure 3
Figure 3
3D transmission electron tomography of posterior stroma at the periphery of normal and keratoconus corneas; (A) 3D tomography of the lamellae of the normal cornea (Cuprolinic blue fixation); (B) 3D tomography of the undulating lamellae of the KC cornea (Cuprolinic blue fixation); (C) 3D tomography of the collagen fibrils (CFs) of the normal cornea showing the micro-fibrillar arrangement within CFs (Cuprolinic blue fixation); (D) 3D tomography of the CF of the KC cornea showing the disintegration of the micro-fibrillar arrangement within CFs (Cuprolinic blue fixation); (E) 3D tomography of the CFs of the normal cornea showing large number of proteoglycans (PGs) within the CFs (Cuprolinic blue fixation); (F) 3D tomography of the CFs of the KC cornea showing small number of PGs within the CFs (Cuprolinic blue fixation). CF = Collagen fibrils, KR = Keratocyte, L = Lamellae, MCF = Microfibrils, PG = Proteoglycan.
Figure 4
Figure 4
Electron micrographs and digital colour coded images of collagen fibrils (CFs) in the keratoconus cornea; (A) Electron micrograph of anterior stroma of central part of the KC cornea; (B) Colour coded image of (A), containing mostly blue (25–30 nm) and few green (20–25 nm) colour coded CFs (Osmium tetroxide fixation); (C) Electron micrograph of anterior stroma of peripheral part of the KC cornea (D) Colour coded image of (C) containing mostly green (20–25 nm) and few blue (25–30 nm) colour coded CFs (Osmium tetroxide fixation); (E) Electron micrograph of middle stroma of central part of the KC cornea; (F) Colour coded image of (E) containing mixture of green (20–25 nm) and blue (25–30 nm) colour coded CFs (Osmium tetroxide fixation); (G) Electron micrograph of middle stroma of peripheral part of the KC cornea; (H) Colour coded image of (G) containing mostly blue (25–30 nm) and few yellow (30–35 nm) colour coded CFs (Osmium tetroxide fixation); (I) Electron micrograph of posterior stroma (PS) of central part of the KC cornea; (J) Colour coded image of (I) containing mixture of green (20–25 nm) and blue (25–30 nm) colour coded CFs (Osmium tetroxide fixation); (K) Electron micrograph of posterior stroma of peripheral part of the KC cornea; (L) Colour coded image of (K) containing mostly blue (25–30 nm) and few green (20–25 nm) colour coded CFs (Osmium tetroxide fixation). LCF = Longitudinal running collagen fibrils. Red: 15–20 nm; Green: 20–25 nm; Blue: 25–30 nm; Yellow: 30–35 nm; Terracotta: 35–40 nm.
Figure 5
Figure 5
Frequency distribution of collagen fibrils diameters (nm) in Keratoconus cornea; (A) Anterior stroma at the center; (B) Anterior stroma at the periphery; (C) Middle stroma at the center; (D) Middle stroma at the periphery; (E) Posterior stroma at the center; (F) Posterior stroma at the and periphery. Frequency distribution interfibrillar spacing (nm) in the keratoconus cornea; (G) Anterior stroma at the center; (H) Anterior stroma at the periphery; (I) Middle stroma at the center; (J) Middle stroma at the periphery; (K) Posterior stroma at the center, (L) Posterior stroma at the periphery.
Figure 6
Figure 6
Electron micrographs and digital colour coded images of proteoglycans in the keratoconus (KC) cornea; (A) Electron micrograph of anterior stroma (AS) of central part of the KC cornea; (B) Colour coded image of (A); (C) Electron micrograph of AS of peripheral part of the KC cornea; (D) Colour coded image of (C); (E) Electron micrograph of middle stroma (MS) of central part of the KC cornea; (F) Colour coded image of (E); (G) Electron micrograph of MS of peripheral part of the KC cornea; (H) Colour coded image of (G); (I) Electron micrograph of posterior stroma (PS) of central part of the KC cornea; (J) Colour coded image of (I); (K) Electron micrograph of PS of peripheral part of the KC cornea; (L) Colour coded image of (K). Red: 30–75 nm2; Green: 75–120 nm2; Blue: 120–165 nm2; Yellow: 165–210 nm2; Terracotta: 210–255 nm2, Pink: 255–300 nm2; Brown: 300–345 nm2; Olive: 345–390 nm2; Dark blue: 390–435 nm2, Purple: 435–480 nm2.

References

    1. Winkler M, et al. Three-dimensional distribution of transverse collagen fibers in the anterior human corneal stroma. Invest Ophthalmol Vis Sci. 2013;54:7293–7301. doi: 10.1167/iovs.13-13150. - DOI - PMC - PubMed
    1. Petsche SJ, Chernyak D, Martiz J, Levenston ME, Pinsky PM. Depth-dependent transverse shear properties of the human corneal stroma. Invest Ophthalmol Vis Sci. 2012;53:873–880. doi: 10.1167/iovs.11-8611. - DOI - PMC - PubMed
    1. Meek KM, Knupp C. Corneal structure and transparency. Progress in retinal and eye research. 2015;49:1–16. doi: 10.1016/j.preteyeres.2015.07.001. - DOI - PMC - PubMed
    1. Massoudi D, Malecaze F, Galiacy SD. Collagens and proteoglycans of the cornea: importance in transparency and visual disorders. Cell Tissue Res. 2016;363:337–349. doi: 10.1007/s00441-015-2233-5. - DOI - PubMed
    1. Pellegata NS, et al. Mutations in KERA, encoding keratocan, cause cornea plana. Nat Genet. 2000;25:91–95. doi: 10.1038/75664. - DOI - PubMed

Publication types

MeSH terms