

Measurement of Retinal Microvascular Blood Velocity Using Erythrocyte Mediated Velocimetry
- PMID: 31882799
- PMCID: PMC6934793
- DOI: 10.1038/s41598-019-56239-8
Measurement of Retinal Microvascular Blood Velocity Using Erythrocyte Mediated Velocimetry
Abstract
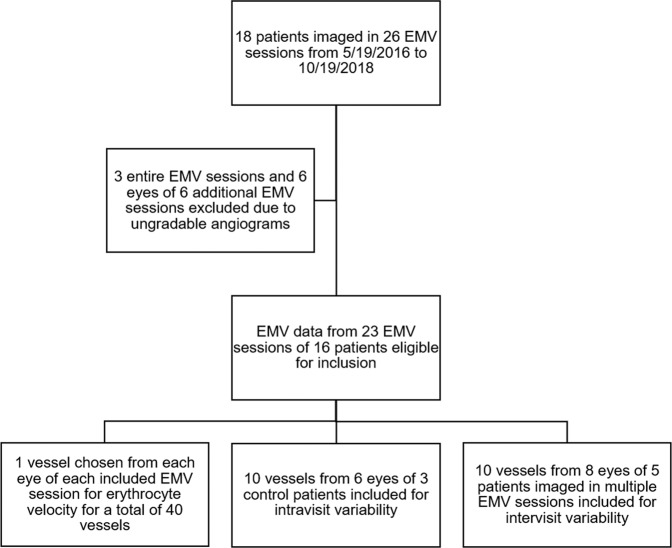
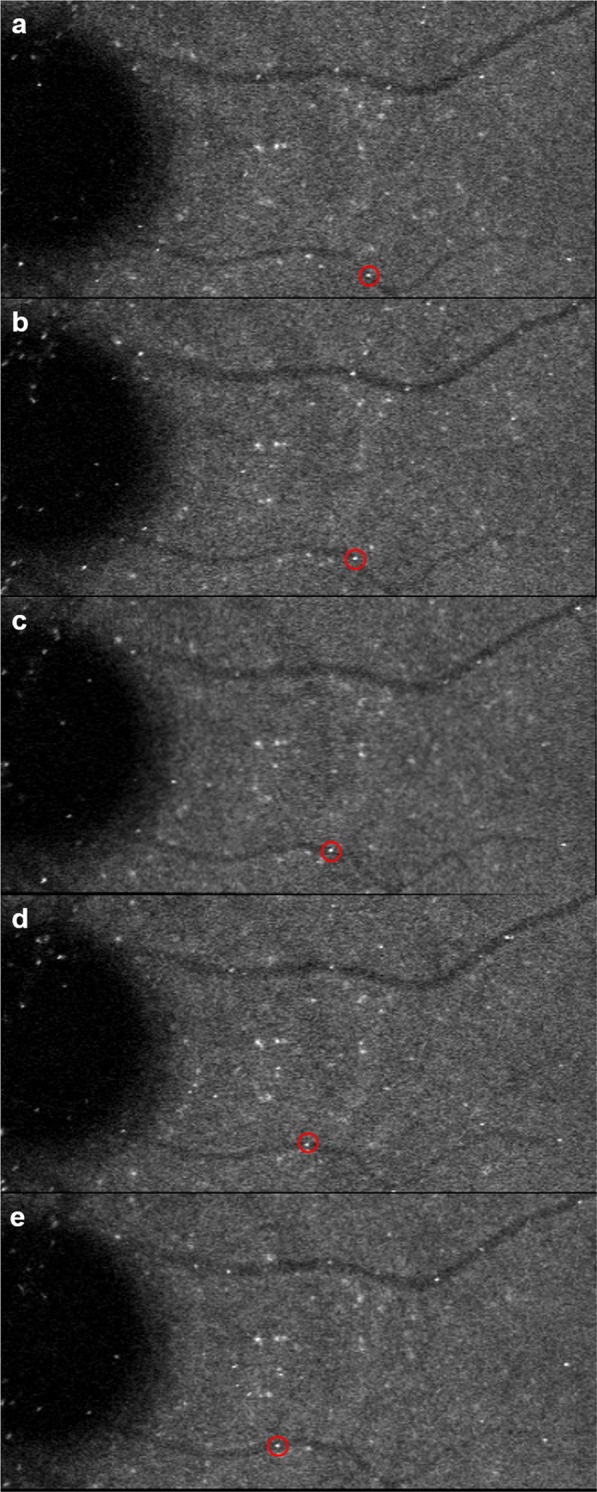
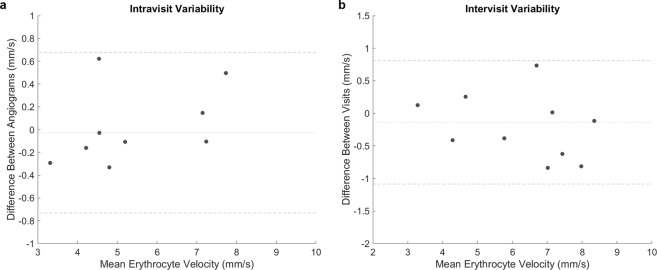
Changes in retinal blood flow may be involved in the pathogenesis of glaucoma and other ocular diseases. Erythrocyte mediated velocimetry (EMV) is a novel technique where indocyanine green (ICG) dye is sequestered in erythrocyte ghosts and autologously re-injected to allow direct visualization of erythrocytes for in vivo measurement of speed. The purpose of this study is to determine the mean erythrocyte speed in the retinal microvasculature, as well as the intravisit and intervisit variability of EMV. Data from 23 EMV sessions from control, glaucoma suspect, and glaucoma patients were included in this study. In arteries with an average diameter of 43.11 µm ± 6.62 µm, the mean speed was 7.17 mm/s ± 2.35 mm/s. In veins with an average diameter of 45.87 µm ± 12.04 µm, the mean speed was 6.05 mm/s ± 1.96 mm/s. Intravisit variability, as measured by the mean coefficient of variation, was 3.57% (range 0.44-9.68%). Intervisit variability was 4.85% (range 0.15-8.43%). EMV may represent reliable method for determination of retinal blood speed, potentially allowing insights into the effects of pharmacologic agents or pathogenesis of ocular diseases.
Conflict of interest statement
J.W. is employed by Heidelberg Engineering GmbH, who provided technical support and imaging devices used in the study. O.S. received occasional travel support from Heidelberg Engineering GmbH. The remaining authors have no competing interests to declare.
Figures

References
Publication types
MeSH terms
Grants and funding
LinkOut - more resources
Full Text Sources
Medical
