. 2019 Dec 27;9(1):19974.
doi: 10.1038/s41598-019-56610-9.

Zebrafish structural development in Mueller-matrix scanning microscopy

Affiliations

Zebrafish structural development in Mueller-matrix scanning microscopy

Aymeric Le Gratiet et al. Sci Rep. .

Abstract

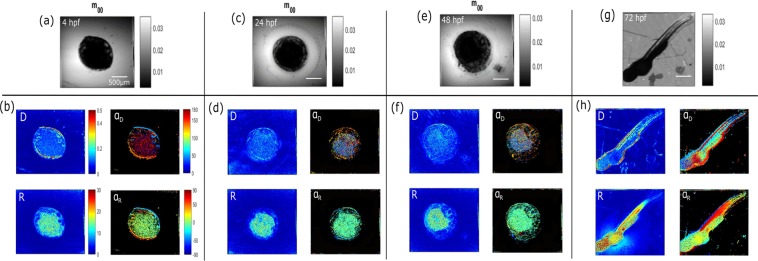
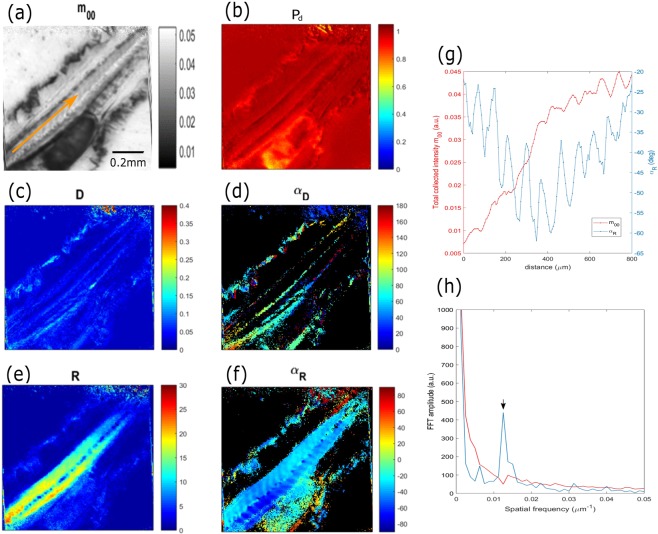
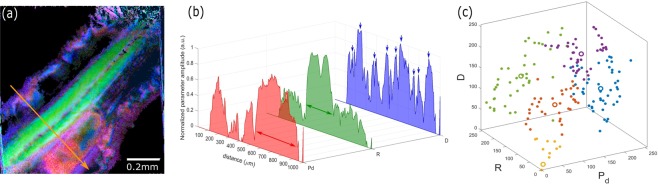
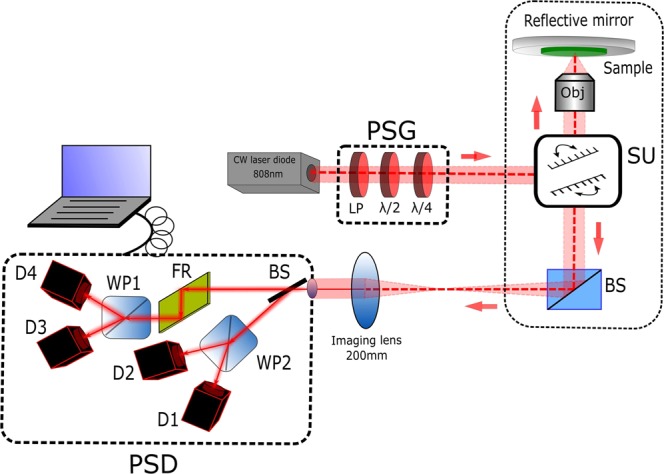
Zebrafish are powerful animal models for understanding biological processes and the molecular mechanisms involved in different human diseases. Advanced optical techniques based on fluorescence microscopy have become the main imaging method to characterize the development of these organisms at the microscopic level. However, the need for fluorescence probes and the consequent high light doses required to excite fluorophores can affect the biological process under observation including modification of metabolic function or phototoxicity. Here, without using any labels, we propose an implementation of a Mueller-matrix polarimeter into a commercial optical scanning microscope to characterize the polarimetric transformation of zebrafish preserved at different embryonic developmental stages. By combining the full polarimetric measurements with statistical analysis of the Lu and Chipman mathematical decomposition, we demonstrate that it is possible to quantify the structural changes of the biological organization of fixed zebrafish embryos and larvae at the cellular scale. This convenient implementation, with low light intensity requirement and cheap price, coupled with the quantitative nature of Mueller-matrix formalism, can pave the way for a better understanding of developmental biology, in which label-free techniques become a standard tool to study organisms.


Conflict of interest statement

The authors declare no competing interests.

Figures

Figure 1
Figure 1
Optical bright field images of fixed zebrafish embryos and larvae at different stages of development. At 4 hpf (hours post fertilization) (blastula stage), the embryo is formed by yolk cells (YC) and blastoderm (B). Moreover, a protective barrier, named chorion (Ch), surrounded the embryo. At 24 hpf (pharyngula stage), it is possible to identify the heart (Ht), eyes (E), spinal cord (SC) and the tail (T) attached to the yolk sac (YS). At 48 hpf, the embryo has a well-structured spine and evident skin pigmentation. At 72 hpf (larval stage), the embryogenesis is completed and the pigmentation progressive increased dorsally. The scale bars correspond to 500 μm.
Figure 2
Figure 2
Polarimetric images of fixed zebrafish embryos and larvae at 4 hpf, 24 hpf, 48 hpf and 72 hpf using a 4X/0.1NA objective. The images (a),(c),(e),(g) correspond to the total collected intensity from the Mueller-matrix, which is the m00 element. The images (b),(d),(f),(h) are the Lu and Chipman decomposition images, i.e coded in Diattenuation (D), in Retardance and its azimuthal orientations αD and αR, respectively.
Figure 3
Figure 3
(a–d) Histograms of the pixel values of the four polarimetric parameters at each development stage from Fig. 2 (one sample). (e–h) Averaged histograms over 10 samples of the four polarimetric parameters at each development stage. The blue, red and green and orange plots corresponded to 4 hpf, 24 hpf, 48 hpf and 72 hpf respectively.
Figure 4
Figure 4
(a) m00 image of fixed larvae tail at 72 hpf for a 10X/0.4NA objective zoom 1.1. (b–f) Polarimetric images from the Lu and Chipman decomposition coded in (b) depolarization index Pd, (c) diattenuation D and (d) its orientation αD, (e) retardance R and (f) its orientation αR. (g) Intensity profiles from the orange arrows in Figures (a,e), where the red and blue lines correspond to the m00 and the αR intensity, respectively. (h) 1D Fast Fourier Transform (FFT) of the intensity profiles of (g).
Figure 5
Figure 5
Lu and Chipman decomposition images of the fixed zebrafish tail at 72 hpf presented Fig. 4 for different orientations in the sample plane. (a) Diattenuation, (b) retardance and (c) depolarization index pixel distribution over the full image for each orientation. (d) αR images of the same tail Fig. 4 at different orientations related to the sample plane. (e) Intensity ratio, between the maximum and minimum intensity of the muscular tissue region from the tail for the αR images in (d).
Figure 6
Figure 6
(a) Polarimetric merged images of the fixed zebrafish tail at 72hpf from Fig. 4 coded in depolarization index (red), retardance (green) and diattenuation (blue). (b) Merged normalized intensity profiles of the orange arrow in (a) from the three channels, i.e. depolarization index Pd (red), retardance R (green) and diattenuation D (blue). The green, red and blue arrows showed the estimated muscular, yolk sac and the membranes areas, respectively. (c) 3D-clustered pixels intensity distribution of the three main polarimetric parameters from Fig. 4(b),(c),(e).
Figure 7
Figure 7
Schematic diagram of the experimental setup in reflection configuration. PSG: Polarization States Generator. PSD: Polarization States Detection. LP: Linear Polarizer. λ/2: Half-waveplate. λ/4: Quarter-waveplate. SU: Scanning Unit. BS: Beamsplitter. Obj: Objective lens. FR: Fresnel Rhomb. WPi (I = 1, 2): Wollaston Prism. Di (i = 1, 2, 3, 4): Detector.

References

    1. Howe K, et al. The zebrafish reference genome sequence and its relationship to the human genome. Nature. 2013;496:498–503. doi: 10.1038/nature12111. - DOI - PMC - PubMed
    1. d’Amora M, Giordani S. The Utility of Zebrafish as a Model for Screening Developmental Neurotoxicity. Front. Neurosci. 2018;12:976. doi: 10.3389/fnins.2018.00976. - DOI - PMC - PubMed
    1. Huisken J, Swoger J, Del Bene F, Wittbrodt J, Stelzer EHK. Optical Sectioning Deep inside Live Embryos by Selective Plane Illumination Microscopy. Science (80-.). 2016;305:1007–1009. doi: 10.1126/science.1100035. - DOI - PubMed
    1. Olivier N, et al. Cell Lineage Reconstruction of Early Zebrafish Embryos Using Label-Free Nonlinear Microscopy. Science (80-.). 2010;329:967–971. doi: 10.1126/science.1189428. - DOI - PubMed
    1. Shelden EA, et al. In Vivo Orientation of Single Myosin Lever Arms in Zebrafish Skeletal Muscle. Biophys. J. 2014;107:1403–1414. doi: 10.1016/j.bpj.2014.07.055. - DOI - PMC - PubMed

MeSH terms