. 2019 Dec 27;9(1):19979.
doi: 10.1038/s41598-019-56408-9.

ezTrack: An open-source video analysis pipeline for the investigation of animal behavior

Affiliations

ezTrack: An open-source video analysis pipeline for the investigation of animal behavior

Zachary T Pennington et al. Sci Rep. .

Abstract

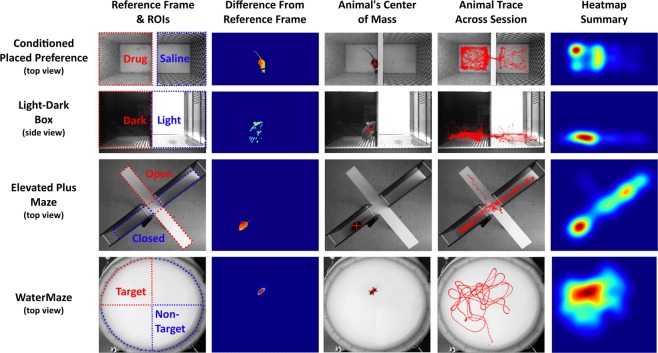
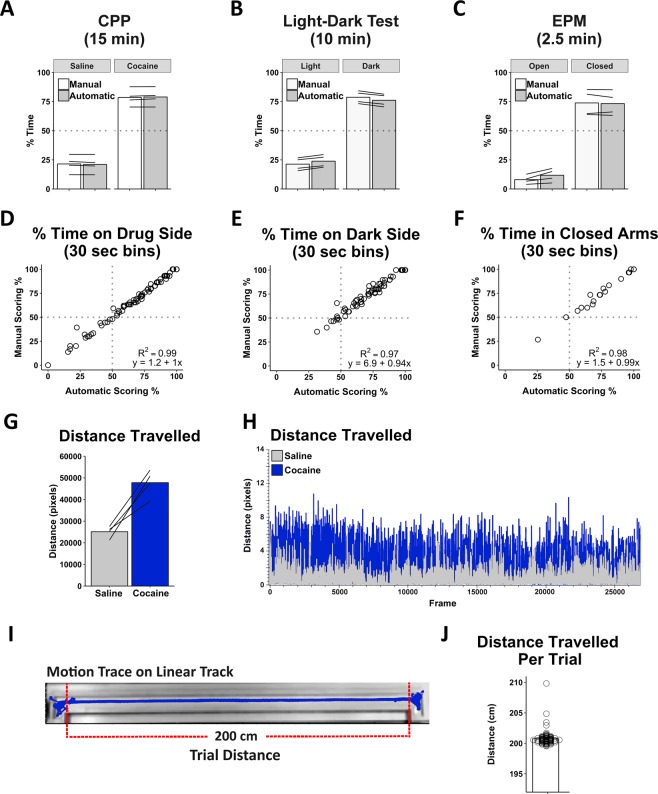
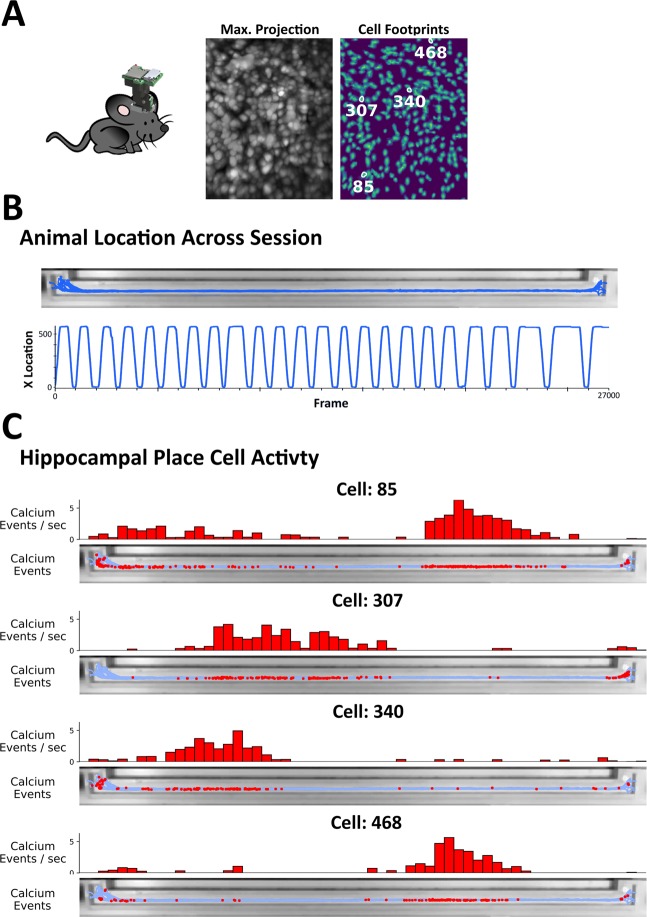
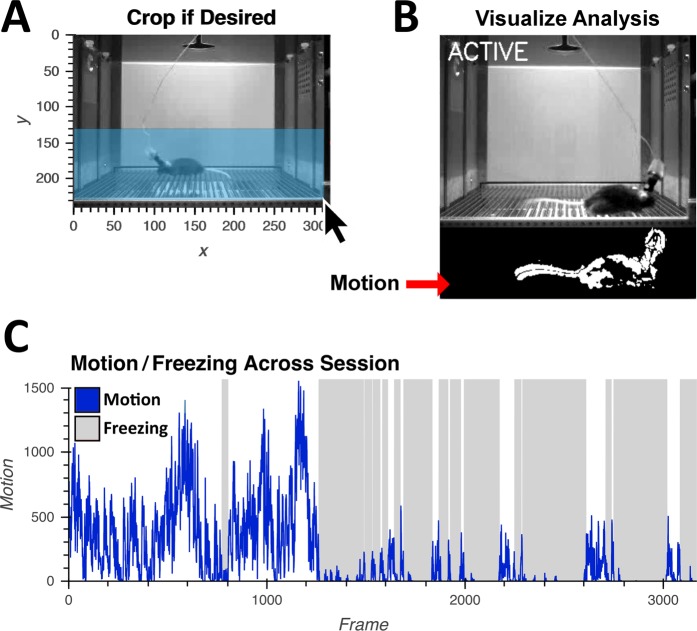
Tracking animal behavior by video is one of the most common tasks in the life sciences. Although commercial software exists for executing this task, they often present enormous cost to the researcher and can entail purchasing hardware that is expensive and lacks adaptability. Additionally, the underlying code is often proprietary. Alternatively, available open-source options frequently require model training and can be challenging for those inexperienced with programming. Here we present an open-source and platform independent set of behavior analysis pipelines using interactive Python that researchers with no prior programming experience can use. Two modules are described. One module can be used for the positional analysis of an individual animal, amenable to a wide range of behavioral tasks. A second module is described for the analysis of freezing behavior. For both modules, a range of interactive plots and visualizations are available to confirm that chosen parameters produce the anticipated results. Moreover, batch processing tools for the fast analysis of multiple videos is provided, and frame-by-frame output makes alignment with biological recording data simple. Lastly, options for cropping video frames to mitigate the influence of fiberoptic/electrophysiology cables, analyzing specified portions of time, and defining regions of interest, are readily implemented.


Conflict of interest statement

The authors declare no competing interests.

Figures

Figure 1
Figure 1
ezTrack Location Tracking Module. Using ezTrack’s Location Tracking Module, an animal’s center of mass is tracked across the session. After defining a reference frame and ROIs with a drawing tool (left-most panel), each frame is compared to the reference frame, taking their difference (2nd panel). From these differences, the animal’s center of mass is calculated (3rd panel, crosshair indicates center of mass). The animal’s center of mass is then saved, as well as displayed atop the reference frame for visual inspection of the results (4th panel). Interactive summary images, including heatmaps (5th panel) are also output. All images come directly from ezTrack output.
Figure 2
Figure 2
ezTrack Location Tracking Module Validation. Automated analysis of cocaine conditioned place preference (n = 4 animals), light-dark box (n = 4 animals), and elevated plus maze (n = 4 animals) rendered nearly identical results as scoring by hand, both when looking at mean session data (AC), and when session data was broken down into smaller time segments (DF), demonstrating ezTrack’s accuracy. Additionally, ezTrack reliably detects changes in locomotion, with increased motion in conditioned place preference following cocaine administration (GH). Further validating ezTrack distance measurements, across 93 trials traversing a 200 cm linear track (I), ezTrack consistently indicated that an animal ran just over 200 cm (J).
Figure 3
Figure 3
Alignment of Neurophysiological Data with ezTrack Results. A single mouse ran back and forth on a linear track wearing a Miniscope in order to track hippocampal place cells. (A) Animal with head-mounted Miniscope. Image on left shows max projection of Miniscope recording (for each pixel, max. value across session). Image on right shows isolated cell locations. Exemplary ‘place cells’ are highlighted. (B) Using ezTrack, animal’s spatial position was examined during a single session. Top image shows animal position superimposed on linear track. Bottom image shows animal’s x position across a session. Note smooth tracking throughout. (C) After deconvolving calcium activity, calcium events were aligned with spatial position to identify putative place cells. Top histogram shows normalized cell activity across track. Bottom image shows imposition of calcium events atop linear track.
Figure 4
Figure 4
ezTrack Freeze Analysis Module. Using ezTrack’s Freeze Analysis Module, an animal’s motion and freezing are processed. (A) Using point and click options, ezTrack’s Freeze Analysis Module allows the user to crop the the frame to remove the influence of cables. (B) After analyzing data, segments can be played back to visualize scoring of motion and freezing (See Supplementary Video 5). Parameters can then be adjusted to conform to the experimenter’s judgment. (C) Motion (blue) and freezing (gray) is plotted by ezTrack and frame-by-frame and binned summary data can then be saved to csv files.
Figure 5
Figure 5
ezTrack Freeze Analysis Module Validation. The results of ezTrack’s Freeze Analysis Module were compared to those obtained from manual scoring of freezing. Automated analysis of freezing behavior was highly correlated with manual freezing, both when examining (A) average freezing across a 5 min session (n = 17 animals), (B) and using 30 second time bins (n = 255 samples). (C) Moreover, both manual and automated scoring show increased freezing with the number of shocks animals previously received, and relative between-mouse freezing levels are preserved (each mouse is represented by a line). Naive animals had no surgical experience whereas Scope animals had a Miniscope attached during recording.

Similar articles

Cited by

References

    1. Mathis A, et al. DeepLabCut: markerless pose estimation of user-defined body parts with deep learning. Nat Neurosci. 2018;21:1281–1289. doi: 10.1038/s41593-018-0209-y. - DOI - PubMed
    1. O’Keefe J. Place units in the hippocampus of the freely moving rat. Exp Neurol. 1976;51:78–109. doi: 10.1016/0014-4886(76)90055-8. - DOI - PubMed
    1. Anagnostaras, S. G. et al. Automated assessment of pavlovian conditioned freezing and shock reactivity in mice using the video freeze system. Front Behav Neurosci4, 10.3389/fnbeh.2010.00158 (2010). - PMC - PubMed
    1. Cai DJ, et al. A shared neural ensemble links distinct contextual memories encoded close in time. Nature. 2016;534:115–118. doi: 10.1038/nature17955. - DOI - PMC - PubMed
    1. Perez F, Granger BE. A System for Interactive Scientific Computing. Computing in Science & Engineering. 2007;9:21–29. doi: 10.1109/MCSE.2007.53. - DOI

Publication types