. 2019 Dec 27;9(1):20027.
doi: 10.1038/s41598-019-56739-7.

Hydrodynamic stress stimulates growth of cell clusters via the ANXA1/PI3K/AKT axis in colorectal cancer

Affiliations

Hydrodynamic stress stimulates growth of cell clusters via the ANXA1/PI3K/AKT axis in colorectal cancer

Takeshi Hagihara et al. Sci Rep. .

Abstract

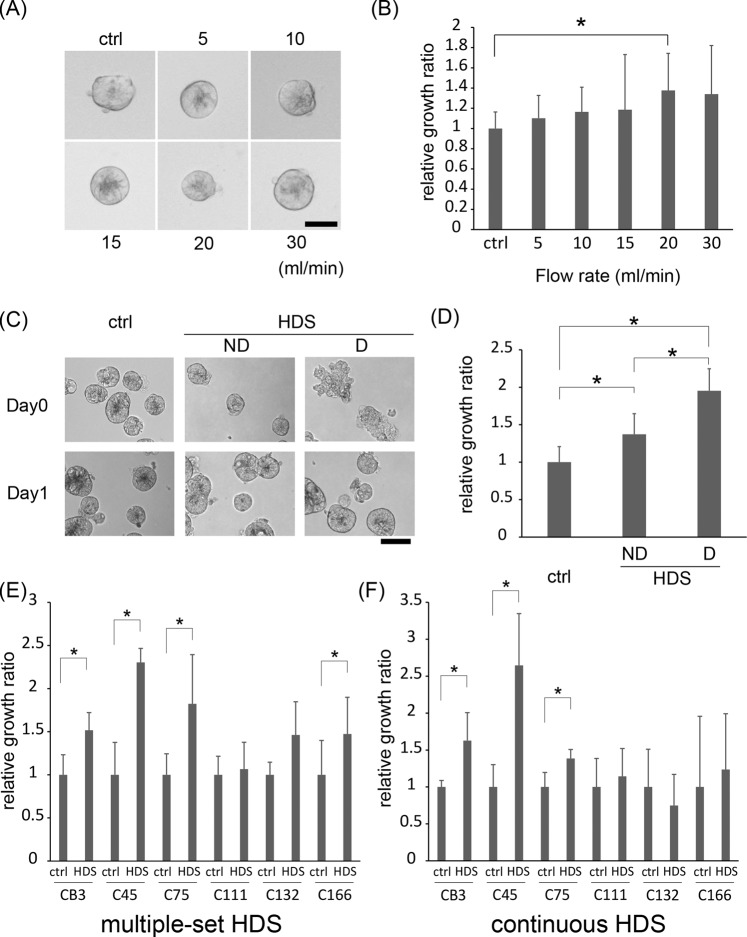
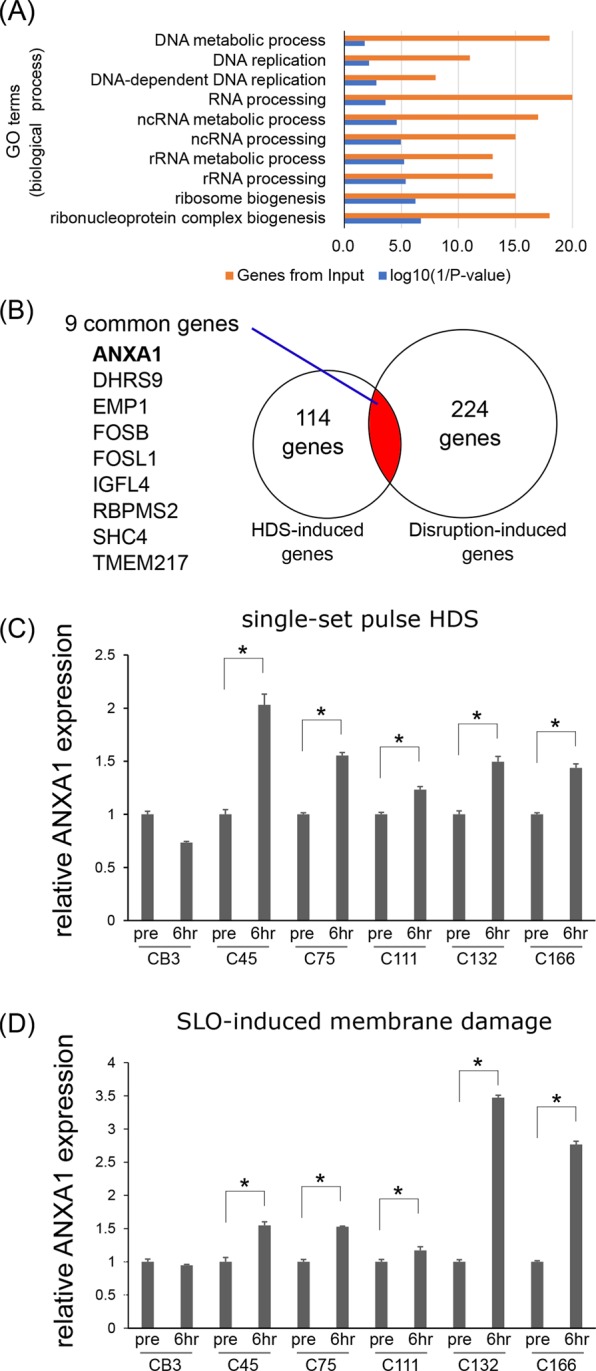
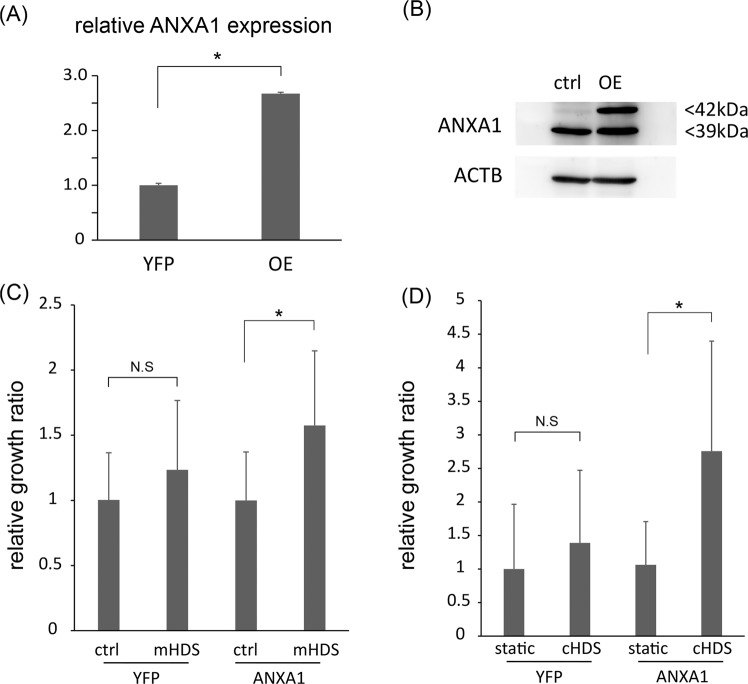
Cancer cells are exposed to various stresses in vivo, including hydrodynamic stress (HDS). HDS on cancer cells in the blood stream can influence the metastatic potential. Recent studies revealed that circulating tumor cell clusters are more responsible for metastasis than circulating single cells. Nevertheless, most studies on HDS are based on single cells prepared from established cancer cell lines. Here, we used cancer tissue-originated spheroids (CTOS) as a patient-derived, 3D organoid model to investigate the effect of HDS on cancer cell clusters. We found that HDS induced the growth of cancer cell clusters in a population of colorectal CTOSs. Microarray analyses revealed that the multifunctional protein, Annexin 1 (ANXA1), was upregulated upon HDS exposure. Chemically-induced membrane damage also triggered the expression of ANXA1. A knockdown of ANXA1 revealed that ANXA1 regulated HDS-stimulated growth in colorectal CTOSs. Mechanistically, activating the PI3K/AKT pathway downstream of ANXA1 contributed to the phenotype. These findings demonstrate that HDS induces the growth of cancer cell clusters via ANXA1/PI3K/AKT axis, which helps to elucidate the pro-metastatic feature of circulating cancer cell clusters.


Conflict of interest statement

J.K. and M.I. are members of the Department of Clinical Bio-resource Research and Development in Kyoto University, which is sponsored by KBBM, Inc. The other authors declare no competing interests.

Figures

Figure 1
Figure 1
Hydrodynamic stress (HDS) stimulates growth of some colorectal cancer tissue-originated spheroids (CTOSs). (A) Phase-contrast images of C45 CTOSs immediately after exposure to a single-set pulse HDS (4 syringe-passings). Images are representative of each flow rate, as indicated. Scale bar: 50 μm (B). Relative growth of C45 CTOS evaluated by ATP assay, 7 days after single-set pulse HDS (4 syringe-passings) delivered at different flow rates. The values are the average ± SD, normalized to the non-pulsed control (ctrl). N = 10 for each condition; *P < 0.05. (C) Phase-contrast images of C45 CTOSs immediately after exposure (day 0) to HDS (30 ml/min, 6 syringe-passings) and 1 day later (day 1). Representative images show CTOSs with non-disrupted (ND) and disrupted (D) architectures. Scale bar: 100 μm. (D) Relative growth of C45 CTOS evaluated by ATP assay, with or without disruption morphology, 7 days after a single-set pulse HDS. The values are the average ± SD, normalized to ctrl. N = 20 for each condition. *P < 0.01. (E) Relative growth of various CTOS lines evaluated by ATP assay, 14 days after multiple-set pulse HDS. The values are the average ± SD, normalized to ctrl. N = 12 for each condition. *P < 0.05. (F) Relative growth of various CTOS lines evaluated by ATP assay, after 7 days of culture with continuous HDS. The values are the average ± SD, normalized to the static condition (ctrl). N = 6 for each condition. *P < 0.05.
Figure 2
Figure 2
Hydrodynamic stress (HDS) induces membrane damage, which triggers growth stimulation in colorectal cancer tissue-originated spheroids (CTOSs). (A) Fluorescence and phase-contrast images of C45 CTOSs exposed to single-set pulse HDS, in the presence of FITC-conjugated dextran. Scale bar: 100 μm. (B) Quantified fluorescence intensity of CTOSs shown in panel (A). Data are the box-and-whisker dot plots; the boxes indicate inter-quartile range and the horizontal lines depict median, and the vertical lines show 1.5 times the inter-quartile range. Each dot is the intensity value of individual single CTOS, N = 51 and N = 42 for the control (ctrl) and HDS groups, respectively. Wilcoxon rank sum test was performed for the statistical analysis. *P < 0.05. (C) Fluorescence and phase-contrast images of C45 CTOSs treated with 125 ng/ml streptlysin-O (SLO) for 10 min in the presence of FITC-conjugated dextran. Scale bar: 100 μm. (D) Quantified fluorescence intensity of CTOSs shown in panel (C). Data are the box-and-whisker dot plots presented in the same fashion as (B). Each dot is the intensity value of individual single CTOS, N = 56 and N = 45 for control and SLO-treated groups, respectively. Wilcoxon rank sum test was performed for the statistical analysis. *P < 0.05. (E) Relative growth of CB3, C45, and C75 CTOSs evaluated by ATP assay, 7 days after treatment with different SLO concentrations. Values are the average ± SD, normalized to ctrl. N = 20 for each condition. *P < 0.05.
Figure 3
Figure 3
Hydrodynamic stress (HDS) induces upregulation of Annexin 1 (ANXA1) in cancer cell clusters. (A) Gene ontology (GO) analysis of gene-expression microarray data for C45 CTOS treated with single-set pulse HDS. At 6 h after HDS, 123 genes were upregulated by more than 1.5-fold; these genes were analyzed for GO enrichment. Orange bars: the number of genes included in each GO term. Blue bars: the log10(1/P-value) for each GO term. (B) Venn diagram shows overlap of 9 genes that were upregulated, both by mild HDS (single-set pulse HDS), which did not disrupt cell membranes, and by strong HDS, which caused architectural disruptions. (C) Relative expression of Annexin 1 (ANXA1) mRNA before (pre) and 6 h after single-set pulse HDS, in multiple CTOS lines. Data are the average ± SD; N = 3 for each run. *P < 0.05. (D) Relative expression of ANXA1 mRNA, before and 6 h after SLO treatment in multiple CTOS lines. Data are the average ± SD; N = 3 for each run. *P < 0.05.
Figure 4
Figure 4
Knock down of Annexin 1 (ANXA1) suppresses growth stimulated by hydrodynamic stress (HDS). (A) Semi-quantitative PCR analysis confirms the knockdown of ANXA1 gene expression. Relative ANXA1 expression levels are shown in C45 CTOS that were either transduced with an ANXA1 shRNA construct (sh#1 or sh#2) or a non-targeting (NT) control construct. ACTB: β-actin, the internal control gene. Data are the average ± SD. *P < 0.05. (B) Immunoblots show proteins from C45 CTOS that were not transduced (NT) or transduced with 2 different ANXA1 shRNAs (sh#1 and sh#2). Proteins were extracted at 1, 3, and 7 days (d1, d3, and d7, respectively) after subculturing. (C) Relative growth (ATP assay) of C45 CTOS transduced with control (NT) or ANXA1 shRNAs (sh#1 and sh#2) and cultured for 7 days after single-set pulse HDS. Data are the average ± SD, normalized to control (ctrl) values; N = 20 for each condition. *P < 0.05. (D,E) Relative growth (ATP assay) of C45 CTOS treated with control (NT) or ANXA1 shRNAs (sh#1 and sh#2), and cultured for 14 days with (D) multiple-set pulse HDS or with (E) continuous HDS. Data are the average ± SD, normalized to ctrl; N = 9 in (D) and N = 6 in (E) for each condition. *P < 0.05.
Figure 5
Figure 5
Forced overexpression of Annexin 1 (ANXA1) potentiates hydrodynamic stress (HDS)-induced growth stimulation in colorectal cancer cell clusters. (A) Semi-quantitative PCR analysis confirms ANXA1 expression levels in C132 CTOS, transduced with either the ANXA1 construct (overexpression; OE) or the yellow fluorescent protein (YFP) control construct. Data are the average ± SD. *P < 0.05. (B) Immunoblots show ANXA1 expression in C132 CTOS transduced with ANXA1 (OE) or YFP (ctrl). The transduced ANXA1 had a higher molecular weight, because it was tagged with 3x FLAG. (C) Relative growth (ATP assay) of C132 CTOS with ANXA1 OE and YFP as control. CTOSs were cultured for 14 days with multiple-set pulse HDS (mHDS) or without HDS (ctrl). Data are the average ± SD, normalized to YFP without HDS; N = 8 for each condition. *P < 0.05. (D) Relative growth (ATP assay) of C132 CTOS with ANXA1 OE and YFP as control. CTOSs were cultured for 7 days with continuous HDS (cHDS) or without HDS (ctrl). Data are the average ± SD, normalized to control; N = 6 for each condition *P < 0.05.
Figure 6
Figure 6
Hydrodynamic stress (HDS) stimulates growth by activating the PI3K/AKT pathway downstream of Annexin 1 (ANXA1). (A) Immunoblot shows changes in the expression of proteins from the C45 line of cancer tissue-originated spheroids (CTOSs), treated with single-set pulse HDS. Proteins were identified by the indicated antibodies over the 6 h following HDS treatment. pAKT: AKT phosphorylated (at the indicated residue); tAKT: total AKT protein; ACTB: β-actin, the internal control gene. (B) Densitometry analysis of immunoblots shows the level of phosphorylated AKT (at S473), relative to the total AKT at each time point. The C45 CTOS line was treated with control (NT) or ANXA1 shRNAs (sh#1 or sh#2), then single-set pulse HDS were applied. Protein samples were extracted at the indicated time points following HDS treatment. Data show the quantification of a single representative result, selected from 3 independent experiments (see Supplementary Fig. S10 for raw immunoblots). (C) Relative growth (ATP assay) of C45 CTOS, treated with 2.5 μM GDC-0941 (GDC), and cultured for 14 days with multiple-set pulse HDS (mHDS). Data are the average ± SD, normalized to the DMSO control (crtl); N = 8 for each condition. *P < 0.05. (D) Relative growth (ATP assay) of C45 CTOS, treated with 1 μM GDC-0941 (GDC), and cultured for 14 days with continuous HDS (cHDS). Data are the average ± SD, normalized to the DMSO control; N = 6 for each condition. *P < 0.05.

Similar articles

Cited by

References

    1. Chiarugi P, Giannoni E. Anoikis: a necessary death program for anchorage-dependent cells. Biochem. Pharmacol. 2008;76:1352–1364. doi: 10.1016/j.bcp.2008.07.023. - DOI - PubMed
    1. Regmi S, Fu A, Luo KQ. High Shear Stresses under Exercise Condition Destroy Circulating Tumor Cells in a Microfluidic System. Scientific Reports. 2017;7:39975. doi: 10.1038/srep39975. - DOI - PMC - PubMed
    1. Lien S-C, et al. Mechanical regulation of cancer cell apoptosis and autophagy: Roles of bone morphogenetic protein receptor, Smad1/5, and p38 MAPK. Biochimica et Biophysica Acta (BBA) - Molecular Cell Research. 2013;1833:3124–3133. doi: 10.1016/j.bbamcr.2013.08.023. - DOI - PubMed
    1. Fan R, et al. Circulatory shear flow alters the viability and proliferation of circulating colon cancer cells. Scientific Reports. 2016;6:27073. doi: 10.1038/srep27073. - DOI - PMC - PubMed
    1. Masiello T, et al. A Dynamic Culture Method to Produce Ovarian Cancer Spheroids under Physiologically-Relevant Shear Stress. Cells. 2018;7:277. doi: 10.3390/cells7120277. - DOI - PMC - PubMed

Publication types