. 2020 Jan 23;180(2):340-347.e9.
doi: 10.1016/j.cell.2019.12.003. Epub 2019 Dec 26.

Structural Basis of Human KCNQ1 Modulation and Gating

Affiliations

Structural Basis of Human KCNQ1 Modulation and Gating

Ji Sun et al. Cell. .

Abstract

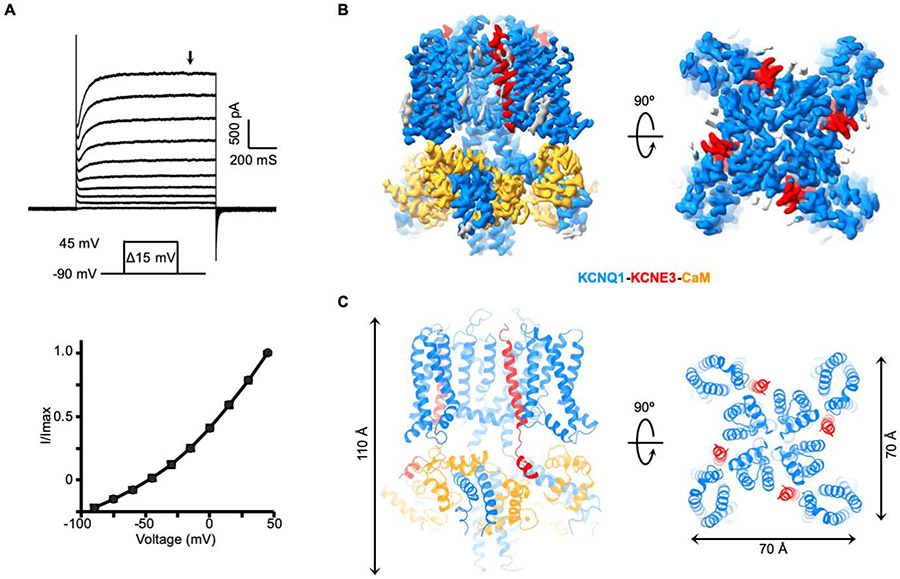
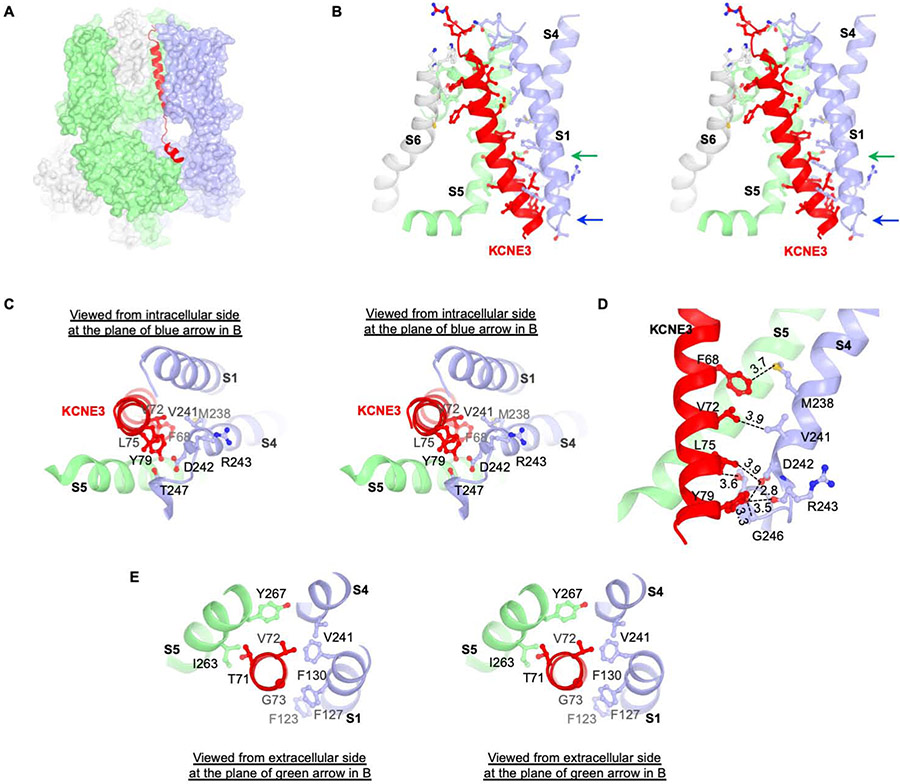
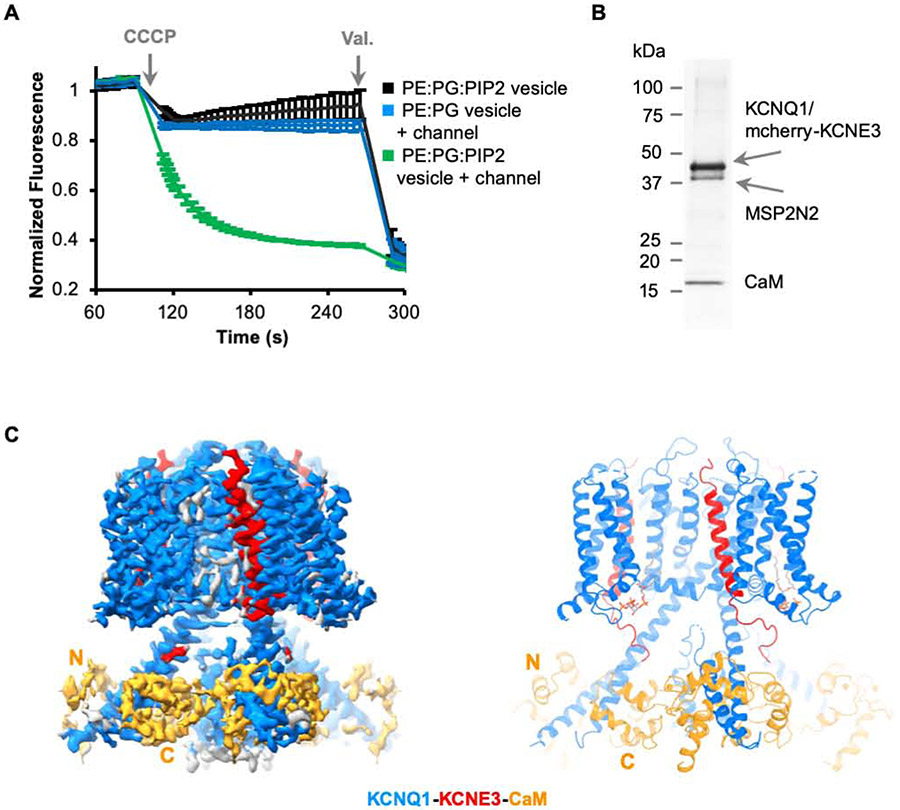
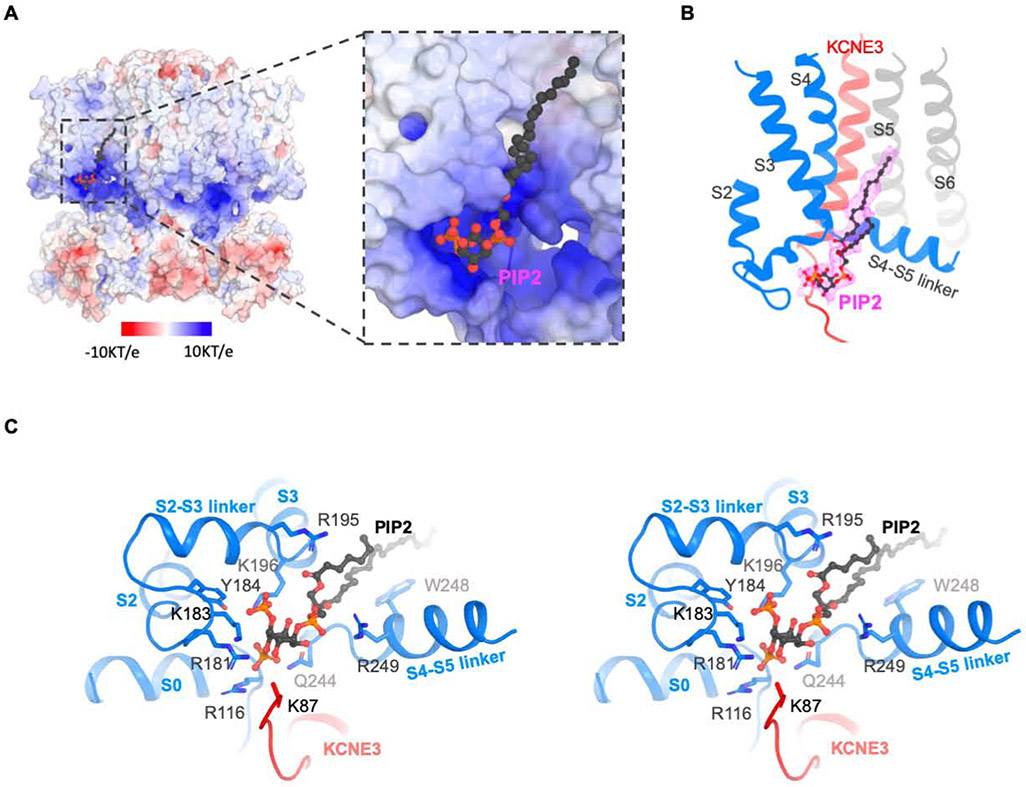
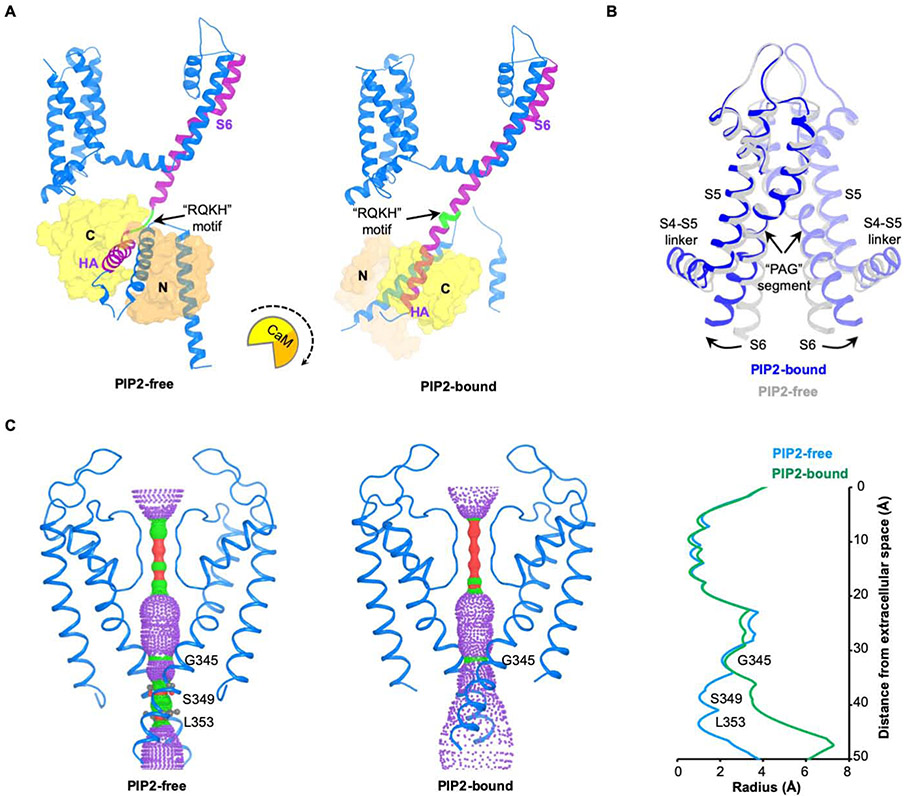
KCNQ1, also known as Kv7.1, is a voltage-dependent K+ channel that regulates gastric acid secretion, salt and glucose homeostasis, and heart rhythm. Its functional properties are regulated in a tissue-specific manner through co-assembly with beta subunits KCNE1-5. In non-excitable cells, KCNQ1 forms a complex with KCNE3, which suppresses channel closure at negative membrane voltages that otherwise would close it. Pore opening is regulated by the signaling lipid PIP2. Using cryoelectron microscopy (cryo-EM), we show that KCNE3 tucks its single-membrane-spanning helix against KCNQ1, at a location that appears to lock the voltage sensor in its depolarized conformation. Without PIP2, the pore remains closed. Upon addition, PIP2 occupies a site on KCNQ1 within the inner membrane leaflet, which triggers a large conformational change that leads to dilation of the pore's gate. It is likely that this mechanism of PIP2 activation is conserved among Kv7 channels.

Keywords: K channel beta-subunit; KCNE3; KCNQ1; PIP2; ion channel gating; ion channel modulation; long-QT syndromes.


Conflict of interest statement

Declaration of Interests

The authors declare no conflict of interest.

Figures

Figure 1.
Figure 1.. Function validation and structure determination of hKCNQ1EM-KCNE3-CaM complex
(A) Voltage family current trace of the hKCNQ1EM-KCNE3-CaM complex recorded in CHO cells (top) and the I-V curve of the channel activation plotted at the time point indicated by the black arrow. (B) Side and top view of the hKCNQ1EM-KCNE3-CaM cryo-EM density map. KCNQ1, KCNE3 and CaM are colored in blue, red and orange, respectively. (C) Structure model of the hKCNQ1EM-KCNE3-CaM complex oriented and colored as in (B).
Figure 2.
Figure 2.. Interaction between KCNQ1-CaM and KCNE3
(A) Interaction between KCNQ1 and KCNE3. KCNE3 is shown as ribbons and KCNQ1-CaM is shown as surface representation. KCNE3 interacts with three protomers of KCNQ1-CaM colored in green, light blue and grey, respectively. The same color code is used in panel (B), (C) and (D). (B) Stereo view of the interaction between KCNQ1 and KCNE3 in the transmembrane region. Side chains of residues on the interface are shown as stick and balls. (C) Stereo view from intracellular side of the KCNQ1 and KCNE3 interface at the plane indicated by blue arrow in (B). (D) Interactions between S4 of KCNQ1 and transmembrane helix of KCNE3. The distances between potential interaction residues (within 4 Å) are labeled. Main chain of R243 is shown in order to demonstrate the potential interaction between Y79 and main chain of R243. (E) Stereo view from extracellular side of the TVG region and its binding site in KCNQ1 at the plane indicated by green arrow in (B).
Figure 3.
Figure 3.. Structure of hKCNQ1EM-KCNE3-CaM complex in the presence of PIP2
(A) Liposome based flux assay. Recordings (n=3) from PE:PG:PIP2 alone, PE:PG with hKCNQ1EM-KCNE3-CaM and PE:PG:PIP2 with hKCNQ1EM-KCNE3-CaM vesicles are plotted in black, blue and green traces. (B) SDS-PAGE showing the reconstitution of hKCNQ1EM-KCNE3-CaM complex in nanodiscs containing PIP2 using MSP2N2 as the scaffold protein. (C) Cryo-EM map and structure model of hKCNQ1EM-KCNE3-CaM in the presence of PIP2. KCNQ1, KCNE3 and CaM are colored in blue, red and orange, respectively.
Figure 4.
Figure 4.. PIP2 binding site of the hKCNQ1EM-KCNE3-CaM channel complex
(A) Surface charge representation (−10KT/e to 10 KT/e) of the PIP2 binding site. The surface potential is calculated using APBS plugin in PyMOL. PIP2 binding site is zoomed in on the right. PIP2 molecule is shown as balls and sticks. (B) Cryo-EM density of PIP2 in the complex. Only the surrounding region of PIP2 binding site are shown in cartoon for clarity. KCNE3 is colored in red and two neighboring KCNQ1 subunits are colored in grey and blue, respectively. (C) Stereo view of the PIP2 binding site. The side chains of residues within 4 A of PIP2 are shown as sticks. PIP2 is shown as balls and sticks.
Figure 5.
Figure 5.. Conformational changes induced by PIP2
(A) Conformational change of the channel complex in one KCNQ1-CaM protomer. The “RQKH” motif that undergoes structural rearrangement from a loop to a helix is colored in green. S6 and HA helixes of KCNQ1 are colored in purple. CaM is shown as surface with its N-lobe in orange and C-lobe in yellow. The rotational motion of CaM associated with the conformational change is indicated by a cartoon with a dash arrow. (B) Overlay of the pore domains of PIP2-free and PIP2-bound structures showing the conformational change in the ion conducting pathway. The PIP2-free state is colored in grey and PIP2-bound state in blue. The S6 helix bends outward upon PIP2 binding at the point of PAG segment. (C) Left: view of ion conducting pathways for PIP2-free and PIP2-bound states with front and back subunits excluded for clarity. Right: radius of the pore calculated using HOLE program. The amino acids restricting the pore are labeled.

References

    1. Abbott GW, Tai KK, Neverisky DL, Hansler A, Hu Z, Roepke TK, Lerner DJ, Chen Q, Liu L, Zupan B, et al. (2014). KCNQ1, KCNE2, and Na+-coupled solute transporters form reciprocally regulating complexes that affect neuronal excitability. Sci Signal 7, ra22. - PMC - PubMed
    1. Afonine PV, Grosse-Kunstleve RW, Adams PD, and Urzhumtsev A (2013). Bulk-solvent and overall scaling revisited: faster calculations, improved results. Acta Crystallogr D Biol Crystallogr 69, 625–634. - PMC - PubMed
    1. Al-Hazza A, Linley J, Aziz Q, Hunter M, and Sandle G (2016). Upregulation of basolateral small conductance potassium channels (KCNQ1/KCNE3) in ulcerative colitis. Biochem Biophys Res Commun 470, 473–478. - PMC - PubMed
    1. Aromolaran AS, Subramanyam P, Chang DD, Kobertz WR, and Colecraft HM (2014). LQT1 mutations in KCNQ1 C-terminus assembly domain suppress IKs using different mechanisms. Cardiovasc Res 104, 501–511. - PMC - PubMed
    1. Barhanin J, Lesage F, Guillemare E, Fink M, Lazdunski M, and Romey G (1996). K(V)LQT1 and lsK (minK) proteins associate to form the I(Ks) cardiac potassium current. Nature 384, 78–80. - PubMed

Publication types

MeSH terms

Substances