. 2020 Jan 23;180(2):311-322.e15.
doi: 10.1016/j.cell.2019.11.039. Epub 2019 Dec 26.

Saltatory Conduction along Myelinated Axons Involves a Periaxonal Nanocircuit

Affiliations

Saltatory Conduction along Myelinated Axons Involves a Periaxonal Nanocircuit

Charles C H Cohen et al. Cell. .

Abstract

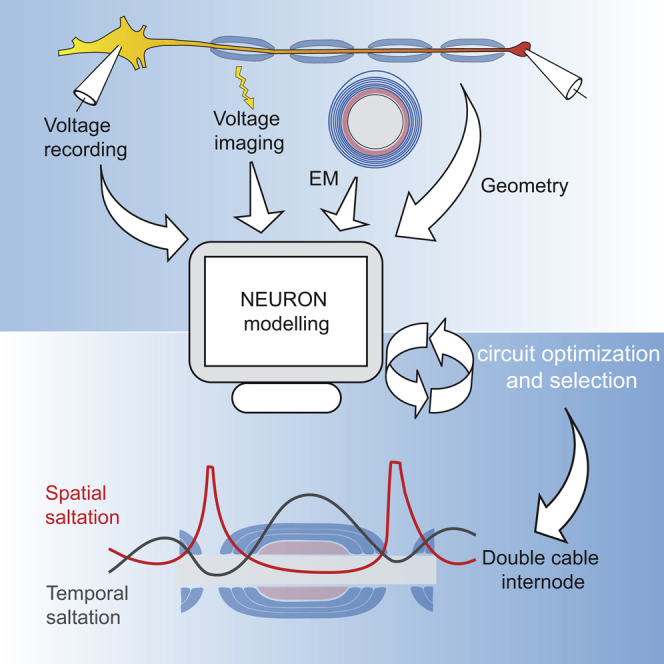
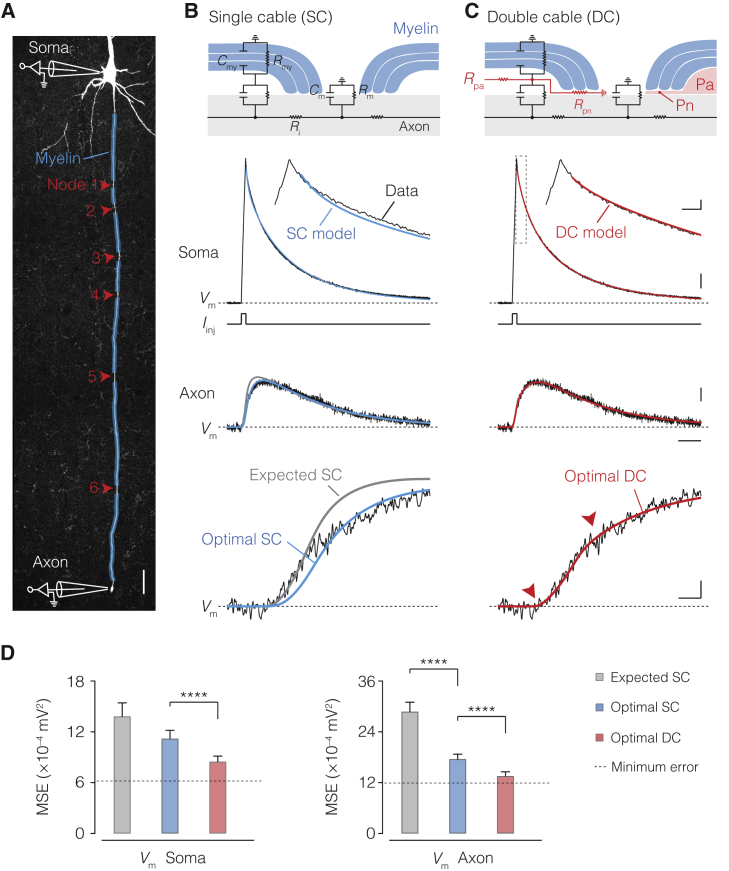
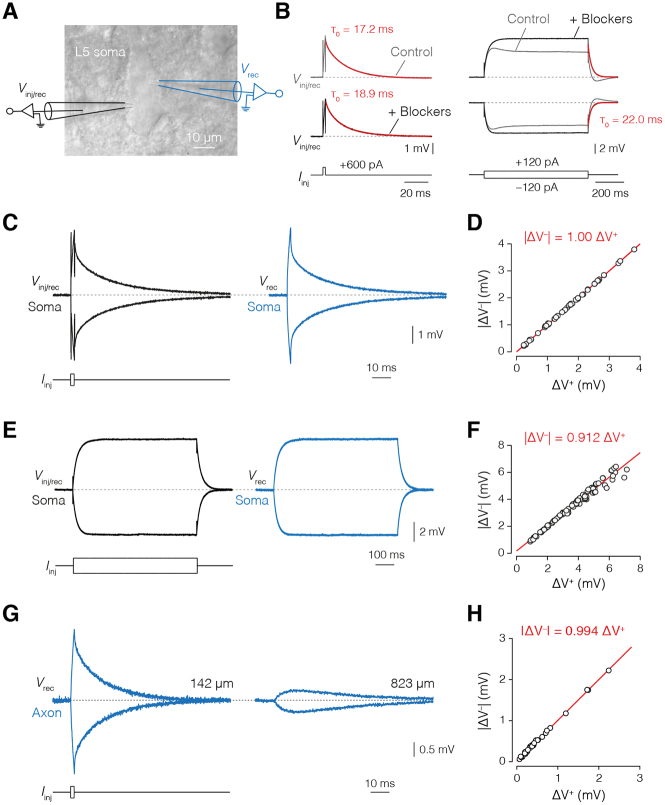
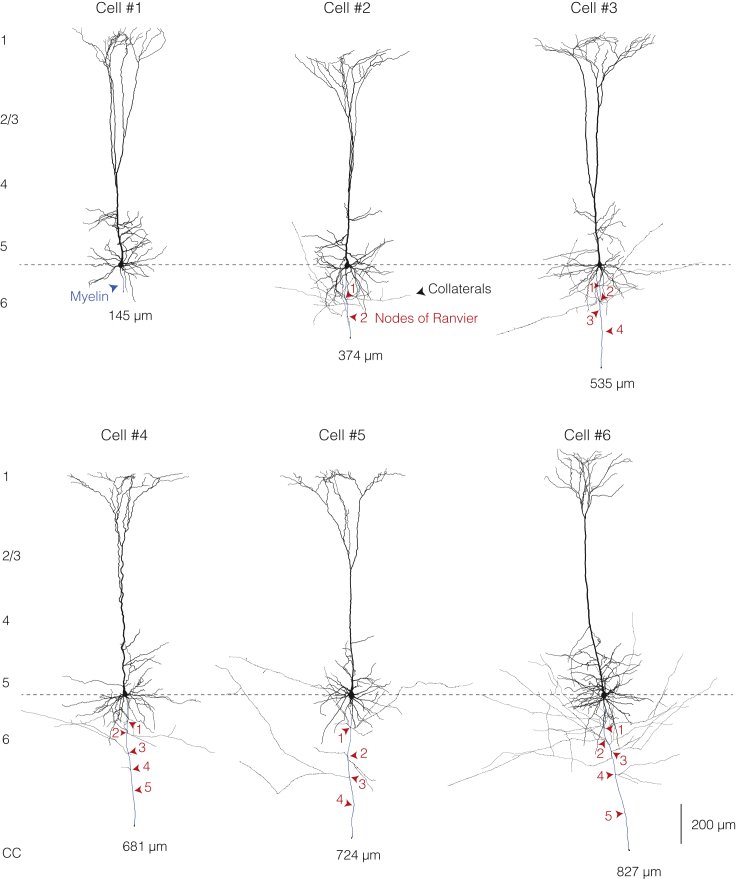
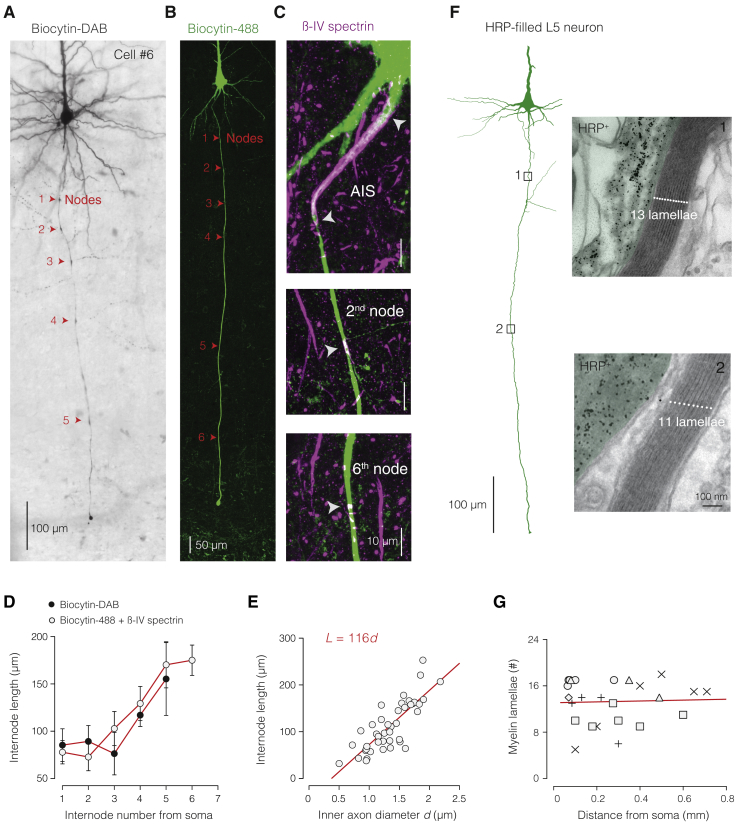
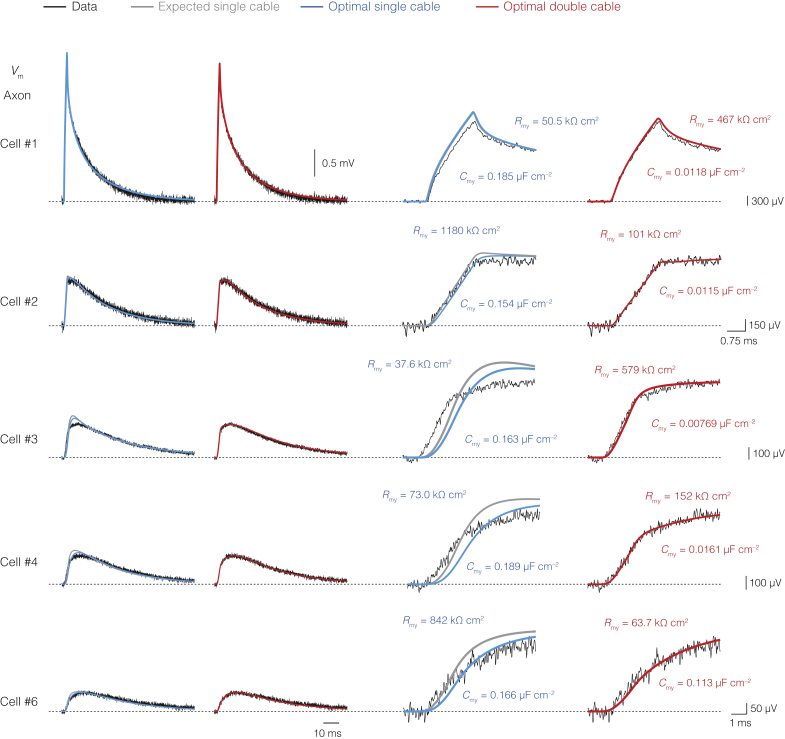
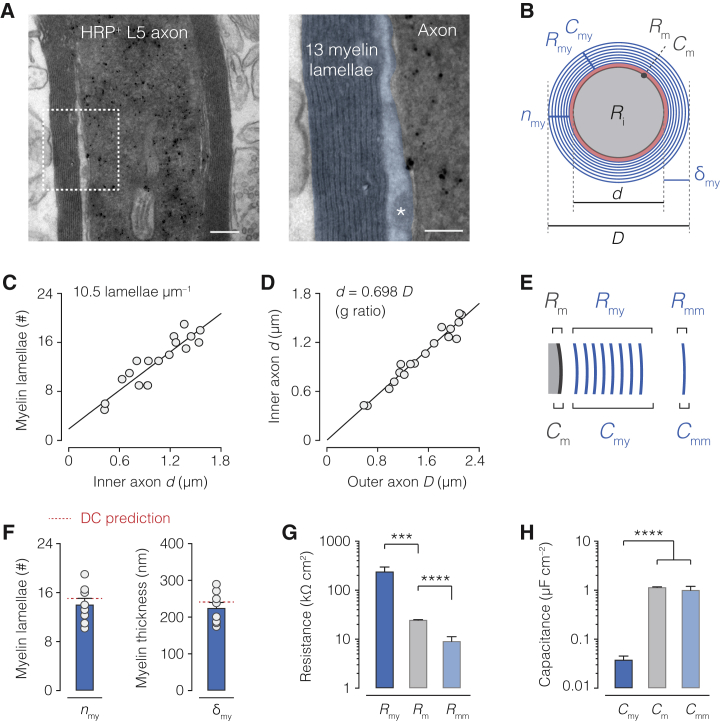
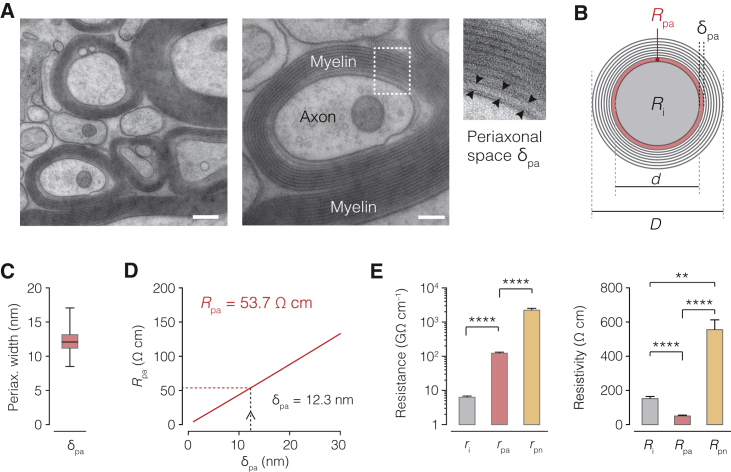
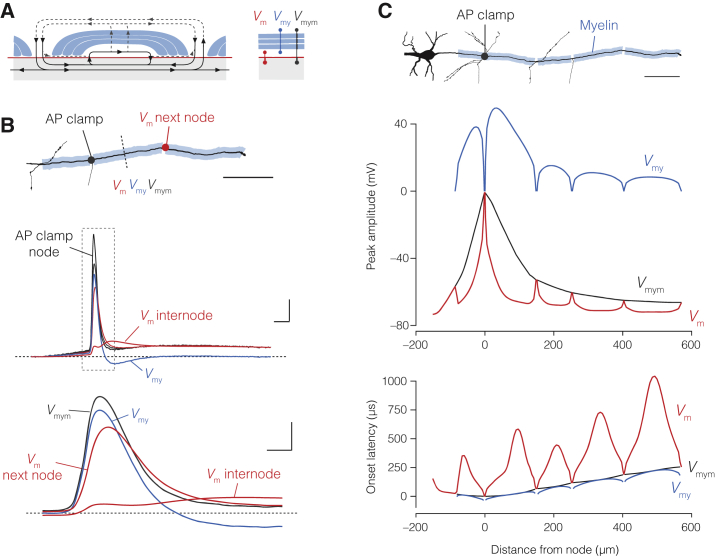
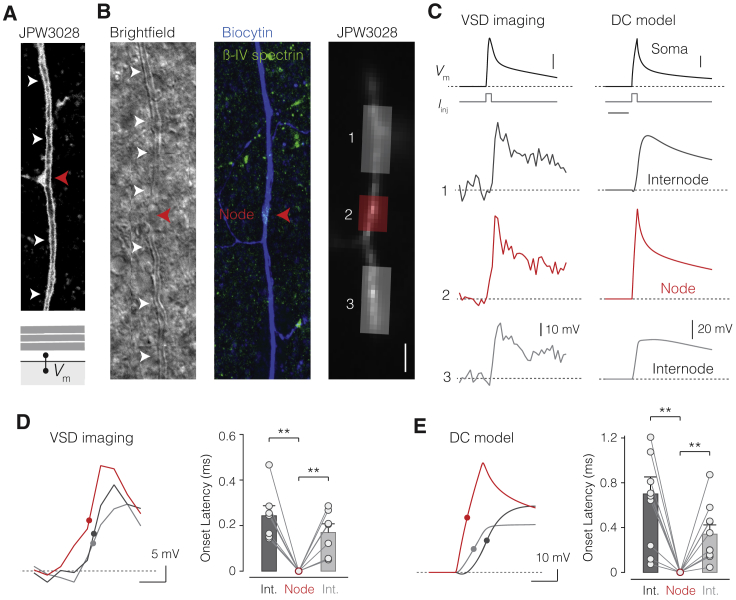
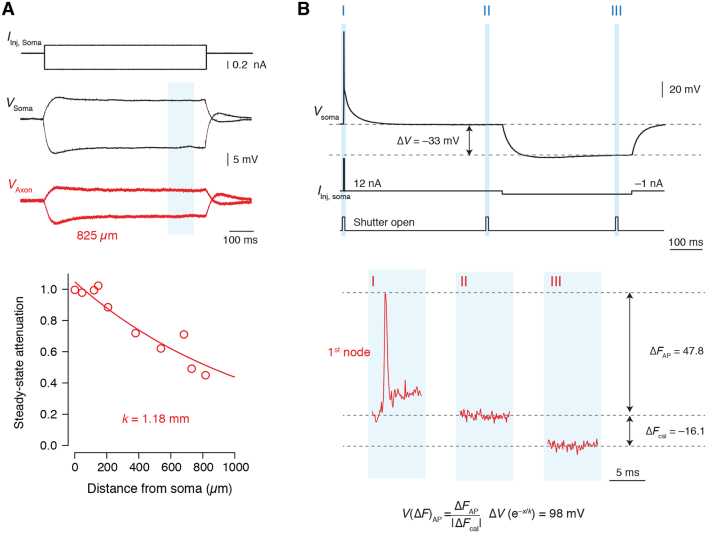
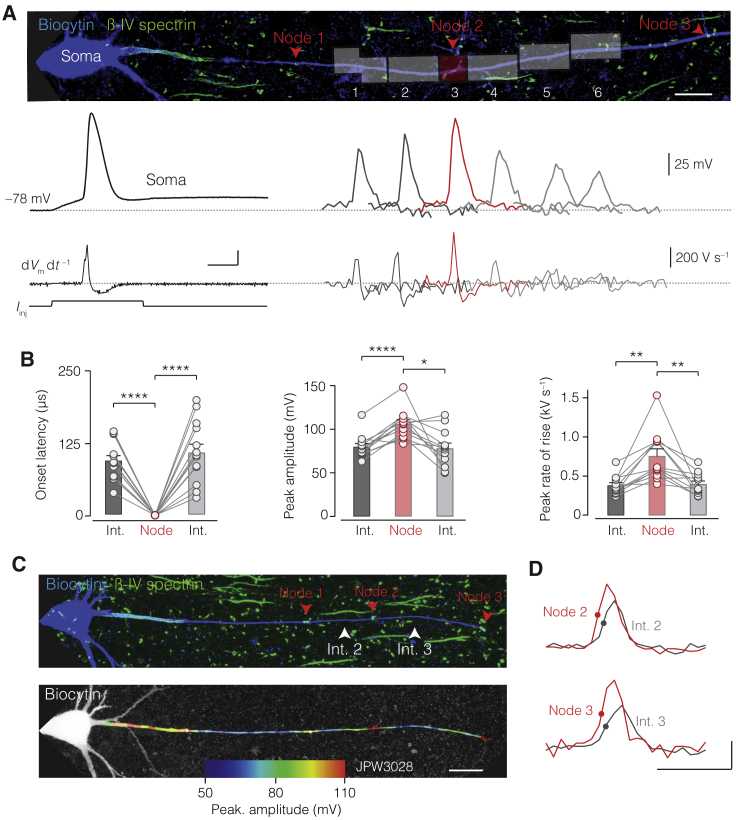
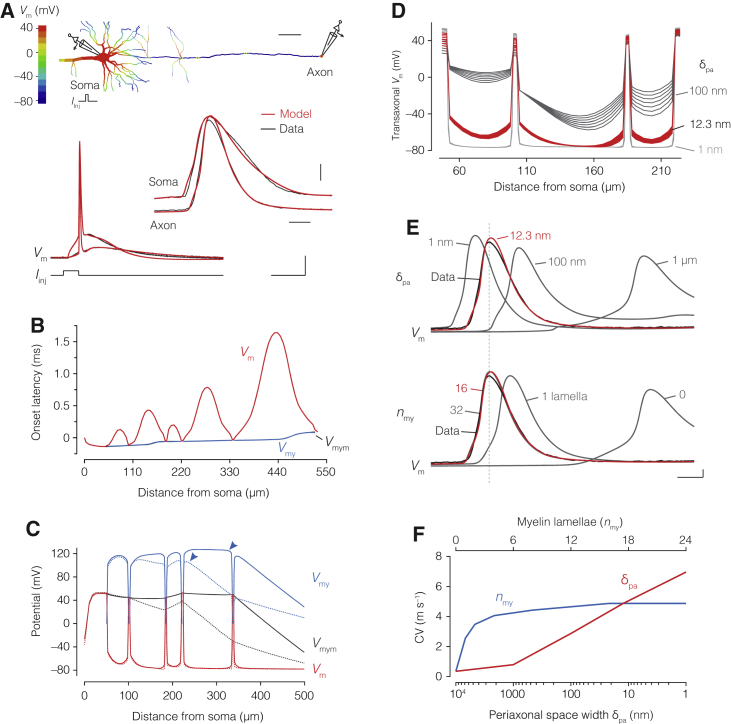
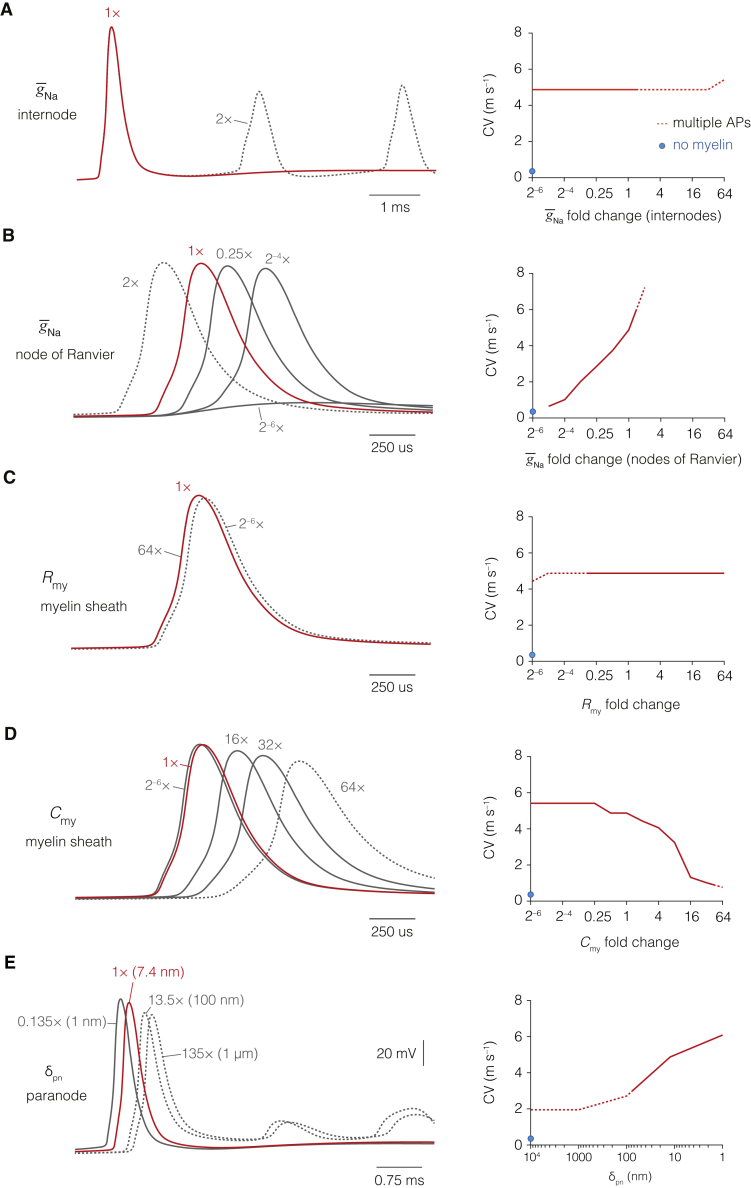
The propagation of electrical impulses along axons is highly accelerated by the myelin sheath and produces saltating or "jumping" action potentials across internodes, from one node of Ranvier to the next. The underlying electrical circuit, as well as the existence and role of submyelin conduction in saltatory conduction remain, however, elusive. Here, we made patch-clamp and high-speed voltage-calibrated optical recordings of potentials across the nodal and internodal axolemma of myelinated neocortical pyramidal axons combined with electron microscopy and experimentally constrained cable modeling. Our results reveal a nanoscale yet conductive periaxonal space, incompletely sealed at the paranodes, which separates the potentials across the low-capacitance myelin sheath and internodal axolemma. The emerging double-cable model reproduces the recorded evolution of voltage waveforms across nodes and internodes, including rapid nodal potentials traveling in advance of attenuated waves in the internodal axolemma, revealing a mechanism for saltation across time and space.

Keywords: action potential; axon; circuit; computational modelling; double cable; internode; myelin; periaxonal space; saltatory conduction; single cable.


Conflict of interest statement

The authors declare no competing interests.

Figures

None
Graphical abstract
Figure 1
Figure 1
Cable Modeling Reveals a Submyelin Conduction Pathway (A) Confocal image of a L5 axon with illustration of patch-clamp recording sites. Red arrows indicate node locations, transparent blue myelin sheaths. Scale bar, 50 μm. (B) Top to bottom, equivalent circuit of the SC model of internodes. Middle traces, optimized SC solutions (blue) overlaid with somatic and axonal voltage transients (black, traces of cell #5) evoked with a brief somatic current injection. For comparison, a SC model of myelin with an expected 20 myelin membranes (Rmy = 20 × Rm, Cmy = 0.05 × Cm, gray). Bottom, rising phase of axonal Vm with optimal SC (blue) or expected SC solutions (gray). (C) Top to bottom, schematic of the equivalent DC internodal circuit, with added periaxonal (Pa) and paranodal (Pn) axial resistances (red). Middle traces, same recording as in B overlaid with optimized DC solutions (red). Note the improved fit of the DC model to the inflection points (red arrows). Scale bars, top to bottom, 0.1 mV and 0.5 ms, 1 mV, 0.2 mV and 10 ms, 0.1 mV and 1 ms. (D) Population optimization error (mean squared error, MSE) for the expected (gray) and optimal SC (blue) and DC (red). The DC model improved solutions for both somatic and axonal recordings (Friedman test with Dunn’s correction p < 0.0001; n = 6 neurons with 8 voltage responses optimized from 8 current injections each). Column and error bars represent mean ± SEM. See also Figures S1, S2, S3, and S4 and Tables S1–S4.
Figure S1
Figure S1
Linearity of Somatic and Axonal Voltage Responses, Related to Figure 1 (A), Schematic of the injecting/recording (Vinj/rec) and recording-only (Vrec) patch-clamp electrodes at the soma of a thick-tufted L5 pyramidal neuron overlaid with brightfield image. (B), Comparison of voltage transients to brief (left) and long (right) current injections (2 ms, 600 pA and 700 ms, 120 pA, respectively) from the Vinj/rec electrode at the soma in control conditions (gray) or after the addition of a solution with conductance blockers (black). Note the uniform exponential decay observed in the ensuing steady-state responses in blocker (black) versus previous non-blocker (gray) conditions, consistent across recordings. (C), example traces for voltage recordings of passive transients used for cable modeling in blocker conditions where VRec (blue) yields a near-identical result to Vinj/rec (black). See STAR Methods for analysis of the parameter differences between these. (D), stepwise linearity of short-pulse recordings at all somatic recording sites (n = 19 cells) showing complete linearity of voltage responses (|ΔV| = 1.00 ΔV+) in the injected current range (±600, ± 500, ± 400, and ± 300 pA; STAR Methods). (E), long-pulse voltage recordings at the soma in blocker conditions from the same cells as in D. (F), plot of the stepwise linearity of all somatic long-pulse recordings (|ΔV| = 0.912 ΔV+, n = 19 cells) in the injected current range (±120, ± 100, ± 80, ± 60, ± 40, and ± 30 pA). (G), Two example axonal recording traces from axo-somatic short-pulse injections (2 ms, ± 600 pA) in blocker conditions from the minimum to maximum recording distances (~140–830 μm, n = 6 cells). (H), stepwise linearity plot of the axonal responses (|ΔV| = 0.994 ΔV+) evoked by somatic current injections (±600, ± 500, ± 400, and ± 300 pA).
Figure S2
Figure S2
Full Morphological Reconstructions of Neurons Used for Modeling, Related to Figure 1 Reconstructed thick-tufted L5 pyramidal neurons from the primary somatosensory cortex of the rat recorded with axo-somatic dual whole-cell recording. Cell numbers refer to the model numbers elsewhere in the text. Red arrows indicate the location of the identified nodes of Ranvier. Regions of myelinated internodes are shown in blue.
Figure S3
Figure S3
Nodal and Internodal Architecture of Thick-Tufted L5 Axons, Related to Figure 1 (A), Low magnification photomicrograph of a biocytin-stained cell (cell #6). Nodes were identified by an increased staining intensity and/or branch point, indicated by the position of arrows (red). (B), Immuofluorescence staining for biocytin-streptavidin (green) and the nodal/AIS marker βIV spectrin (magenta). Nodes of Ranvier, identified by the overlap of spectrin and biocytin, are indicated with arrows (red). (C), High magnification of the AIS and two nodes (2nd and 6th) from the axon shown in (B). (D), Comparison of internode length as a function of internode number for the biocytin-stained axons (cells #2–6) and the immunofluorescence identified L5 axons (n = 8) revealed a similarity in the sequence of internode lengths (two-way ANOVA, group-internode interaction (p > 0.890). The first 2–3 internodes are short, with collaterals emerging from the nodes of Ranvier. With increasing distance from the soma, internodes are progressively longer and lack collaterals. Data represent mean ± SEM (E), Internode length (L) scaled linearly with axon core diameter d, based on all immunofluorescence-identified internodes, (n = 42; r2 = 0.653). (F), Example of a L5 neuron filled with HRP and recovered for EM analysis. EM images are shown for the two indicated locations. (G), The number of myelin lamellae was constant with distance from the soma (red line, linear regression slope ≈0, F test p > 0.836; R2 = 0.00191, n = 25 internodes from 6 axons, represented by different symbols).
Figure S4
Figure S4
Single and Double-Cable Optimizations for the Axonal Voltage Responses, Related to Figure 1 Left, voltage response of recorded axonal voltage transients from cells #1–4 and #6 fit by either the minimum expected SC model (gray; Rmy = 20 × Rm, Cmy = 0.05 × Cm), the optimal SC (blue) or the DC model (red). Right, higher magnification of the first milliseconds of the fit. Corresponding values for myelin resistance and capacitance are indicated. Note the improved fits for all models with DC circuits implemented at the internodes (red) in comparison to expected (gray) and optimized SC circuits (blue). Neuron morphologies shown in Figure S2.
Figure 2
Figure 2
Myelin Sheath Ultrastructure Is Consistent with Double-Cable Parameters (A) Left, EM image of a L5 axon labeled with HRP (black precipitation). Right, higher magnification (white dotted box in left) revealing myelin membranes and lamellae (here, nmy = 13), false colored in blue. The cytoplasmic loop is marked with an asterisk. Scale bars, 200 nm (left) and 100 nm (right). (B) Cross-sectional schematic showing internode parameters with their radial circuit correlates, including those for myelin (blue: Rmy, Cmy, nmy, and δmy) and axon core (gray: Rm, Cm, and Ri). Also shown are axon core diameter (d) and total fiber diameter (D). (C) Linear variation of myelin lamellae with internodal d (linear regression, 10.5 lamella μm–1, F test p < 0.0001, R2 = 0.823; n = 18 internodes from 8 axons). (D) Linear variation of inner axon d with outer axon D reveals a g ratio of 0.698 (linear regression, F test p < 0.0001, R2 = 0.959; n = 18 internodes from 8 axons). (E) Schematic illustration of Rmy and Cmy composed by each myelin membrane (Rmm and Cmm). (F) Left and right, EM estimates for nmy and δmy, respectively. Data are shown as mean ± SEM and individual internodes (open circles, n = 8). Red dotted line, DC model prediction (n = 6 axons). (G) Population data for radial resistance values in DC models (Friedman test with Dunn’s correction p < 0.001 Rmy versus Rm; p < 0.0001 Rm versus Rmm; n = 6 models). (See Equations 7 and 8; STAR Methods.) (H) Population data for DC model estimates (Friedman test with Dunn’s correction p < 0.0001 Cmy versus Cm and Cmm; p = 0.0429 Cm versus Cmm; n = 6 models). Note, both Cmm and Cm are near 1 μF cm–2 (Equations 9 and 10; STAR Methods). Data represent mean ± SEM.
Figure 3
Figure 3
Ultrastructure of the Periaxonal Space Reveals a Low-Resistivity Pathway Relatively Sealed at Paranodes (A) Left, HPF EM image of the rat corpus callosum. Middle, higher magnification of one axon shown with the ROI (white dotted line). Right, 2.3 × magnification of the ROI. Periaxonal width (δpa) between the outer axon and inner myelin (black arrowheads). Scale bars, left 200 nm and middle 100 nm. (B) Schematic of cross-sectional myelinated axon showing the axial circuit correlates for axon core (Ri, black) and periaxonal space (Rpa and δpa, red). d and D as in Figure 2. (C) Boxplot of δpa shows median and 25th to 75th percentiles and min-max values (black bars; n = 195 axons from 3 animals). (D) Plot of average periaxonal resistivity Rpa predicted from possible δpa values (red line, Equation 5). With δpa = 12.3 nm, Rpa is 53.7 Ω cm (dotted lines). (E) Left, comparison of optimized ri, rpa, and rpn. Right, corresponding Ri, Rpa, and Rpn based on δpa = 12.3 nm and δpn = 7.4 nm (Nans et al., 2011) (Table S4 and Equations 4 and 5; Friedman test with Dunn’s correction, ****p < 0.0001 and **p < 0.01; n = 6 neurons). Data are represented as mean ± SEM.
Figure 4
Figure 4
A Double-Cable Model Generates Amplitude and Temporal Saltation in Vm (A) Left, schematic of currents in a DC internode including the submyelin and extracellular current return pathways (dotted lines). Right, the three potentials in the DC model (transaxonal Vm, between axon core and periaxonal space, transmyelin Vmy, between periaxonal and extracellular spaces, and transfiber Vmym, between axon core and extracellular). (B) Top, part of the morphology of cell #5 indicating site for the “AP voltage clamp” at the 3rd node. Active conductances are not included in this model. Middle, Vm (red), Vmy (blue), and Vmym (black) shown for the middle of the following internode (red dotted line) and the resulting Vm at the next node (red). Note the afterhyperpolarization in Vmy and depolarization transients in Vm. Bottom, expanded view of internodal potentials as well as Vm at the next node. Scale bars, top, 100 μm. Middle, 20 mV and 1 ms. Bottom, 20 mV and 200 μs. (C) Top, part of cell #5 morphology with AP clamp applied to the 1st node. Scale bar, 100 μm. Middle, spatial profiles of maximal Vm, Vmy, and Vmym. Bottom, spatial profile of the onset latencies of APs. Note the gradual amplitude and temporal saltation in Vm.
Figure 5
Figure 5
Optical Recording of Passive Transaxonal Vm Reveals Temporal Saltation (A) Top, confocal image of JPW3028 (VSD). Note, the dye remains in a single axolemma membrane (Vm) at the node (red arrow) and internodes (white arrows). Bottom, schematic of internodal Vm, between core and submyelin space. (B) Left, bright-field image of an axon with myelin (white arrows), putative node (red arrow). Middle, same axon stained with biocytin-streptavidin (blue) and βIV spectrin (green). Right, epifluorescence of VSD in the axon. Transparent areas correspond to the ROIs for node (red) and upstream (dark gray) and downstream internode (light gray). Scale bar, 10 μm. (C) Left, voltage-calibrated VSD fluorescence traces (2 kHz acquisition) in response to a brief current injection in the soma (1 ms, 50 nA; top). Right, corresponding DC model prediction for Vm (cell #3) at comparable locations (2 kHz simulation). Scale bars, top, 25 mV (VSD), 50 mV (model), and 4 ms. (D) Left, VSD traces overlaid and expanded in time. Dots, 50% onset time. Right, population data of onset latencies (one-way repeated-measures [RM] ANOVA with Bonferroni’s correction, node versus preceding internode (Int.) p < 0.0025 and node versus proceeding internode p < 0.0025; n = 7 axons). Scale bar, 1 ms. (E) Left, DC model prediction for Vm. Right, population data (one-way RM ANOVA with Bonferroni’s correction, node versus preceding internode p < 0.0021 and node versus proceeding internode p < 0.0037; n = 10 node/internodes, from n = 5 axons). Columns and error bars represent mean ± SEM. Circles and connected lines represent individual first and second nodes of Ranvier paired with their adjacent internodes. Scale bar, 1 ms. See also Figure S5.
Figure S5
Figure S5
Voltage-Calibration Protocol for Optical Recordings along the Axon, Related to Figures 5 and 6 (A), Top, example traces of a simultaneous axo-somatic whole-cell current-clamp recording in normal extracellular solution. Subthreshold depolarizing and hyperpolarizing steady-state current injections at the soma evoked voltage responses at the soma (black) and axon (red) measured in the indicated region (blue). Bottom, averaged amplitudes were normalized to the somatic amplitude and plotted as a function of recording distance from the soma. Data were fit according to an exponential function (V(x) = ex/k), with k being 1.18 mm (n = 10). (B), Top, protocol for voltage calibration. Within each imaging trial, a fast passive transient (Figure 5) or AP (Figure 6) or was evoked by current injections (1 ms, 50 nA or 3 ms, ~10 nA, respectively), followed by a long interval during which the Vm returned to baseline. Example traces show the protocol for an AP. Thereupon, a large hyperpolarizing current step was applied (up to –1.5 nA, 400 ms) to obtain a substantial steady-state potential. To reduce phototoxicity but optimally detect fluorescence during the hyperpolarizing pulse, total light exposure per trial was 21 ms divided into 3 × 7 ms segments (I-III, indicated in blue regions). Bottom, closer view of shutter segments and optically-recorded voltage responses. The first segment coincided with the fast transient or AP-generating current pulse, the second was immediately before the negative current injection, and the third was just prior to the end of the negative current injection near steady-state of the membrane potential. The difference in fluorescence between the baseline and plateau ΔFcal was used to calibrate the depolarization (Figure 5) or AP fluorescence signal (Figure 6), corrected for the known steady-state axo-somatic voltage attenuation (based on k), yielding the VSD-calibrated VF)AP.
Figure 6
Figure 6
High-Speed Optical Recording of Transaxonal Vm Reveals Temporal and Amplitude Saltation (A) Top, z-projected confocal image of a biocytin-filled L5 axon (blue) with βIV spectrin (green, red arrows). Transparent areas (1–3 pixels), imaged regions of the node (red), upstream and downstream internode (dark and light gray, respectively). Bottom, voltage-calibrated optical recordings of Vm (20 kHz rate) and temporal derivatives (dVm dt1) from the indicated ROIs. Scale bars, top, 10 μm, bottom left, 400 V s–1 and 1 ms. (B) Population data reveal increased onset latency, lower peak amplitude, and reduced rate of rise relative to adjacent nodes. Bars indicate mean ± SEM, and circles and connected lines indicate individual axons (one-way RM ANOVA with Bonferroni correction. Latency, node versus preceding internode (int.) p < 0.0001 and proceeding int. p < 0.0001; amplitude: node versus preceding p < 0.0001 and proceeding p < 0.021; rate of rise, preceding p < 0.0032 and proceeding p < 0.01; n = 12 axons). (C) Top, z-projected confocal image of L5 axon. Bottom, axon overlaid with color-coded profile of the maximum Vm (10 kHz). Scale bar, 25 μm. (D) Example traces of voltage-calibrated APs. Note the saltation in time and amplitude. Scale bars, 50 mV, 1 ms. See also Figure S5 and Video S1.
Figure 7
Figure 7
Action-Potential-Constrained Double-Cable Model Reproduces Saltatory Conduction (A) Top, color-coded spatial spread of Vm in cell #3. Bottom, overlay of experimentally recorded (black) and DC optimized APs from axon and soma (red). Scale bars, top to bottom, 50 μm, 20 mV, 250 μs, 20 mV, 10 ms. (B) Onset latency of the AP for Vm (red), Vmy (blue), and Vmym (black), revealing temporal saltation of Vm. (C) Spatial profile of Vm, Vmy, and Vmym before and after the jump from node 3 (dotted line) to node 4 (continuous lines), illustrating the charge transfer via Vmy (blue arrows, upstream and downstream ends). (D) Expanded view of the first 3 nodes and internodes showing Vm at 8 sequential time points during the AP peak in node 3 (80 μs) for optimal δpa (12.3 nm, red) in comparison to 1 and 100 nm (gray; Equation 5). Note the lack of depolarization within internodes for δpa = 1 nm. (E) Top and bottom, impact of δpa and nmy on CV. Optimal nmy was fixed to 16 (red), corresponding to the EM data. nmy variation was simulated by changing Rmy and Cmy (Equations 8 and 10). Traces temporally aligned to the soma AP (vertical line). Scale bars, 10 mV, 1 ms. (F) CV plotted as a function of δpa (red) and nmy (blue). See also Figure S6 and Videos S2, S3, and S4.
Figure S6
Figure S6
AP Conduction Velocity Depends upon Sodium Conductance at Nodes of Ranvier, Myelin Capacitance, and Submyelin Resistance, Related to Figure 7 (A), Conduction velocity (CV) was insensitive to changes in the peak sodium conductance density (gNa) at the internodal axolemma. However, increasing internodal gNaraised the probability of axonal spike generation (dotted line). Optimized trace is shown in red. (B), reducing gNa in nodes of Ranvier below the optimized model (red) strongly decelerated AP propagation. Increasing nodal gNa led to multiple APs as well as much faster CVs (dotted lines). (C), CV is independent of myelin sheath (Rmy) insulation but reducing Rmy below 0.25 times its model value (red) led to an increase spiking activity (dotted lines). (D), increasing myelin Cmy robustly decelerated AP velocity but little to no change was observed upon decreasing Cmy, suggesting Cmy was optimized for a high CV. Optimized model is shown in red. Raising Cmy extremely by > 64× led to multiple APs (dotted lines). (E), increasing δpn from 1 nm to 1 μm (with constant δpa) decreased CV by approximately half. Optimized trace is shown in red. An increase in δpn of 10× and beyond increased excitability (dotted lines).

Comment in

References

    1. Altevogt B.M., Kleopa K.A., Postma F.R., Scherer S.S., Paul D.L. Connexin29 is uniquely distributed within myelinating glial cells of the central and peripheral nervous systems. J. Neurosci. 2002;22:6458–6470. - PMC - PubMed
    1. Arancibia-Cárcamo I.L., Ford M.C., Cossell L., Ishida K., Tohyama K., Attwell D. Node of Ranvier length as a potential regulator of myelinated axon conduction speed. eLife. 2017;6:e23329. - PMC - PubMed
    1. Bakiri Y., Káradóttir R., Cossell L., Attwell D. Morphological and electrical properties of oligodendrocytes in the white matter of the corpus callosum and cerebellum. J. Physiol. 2011;589:559–573. - PMC - PubMed
    1. Barrett E.F., Barrett J.N. Intracellular recording from vertebrate myelinated axons: mechanism of the depolarizing afterpotential. J. Physiol. 1982;323:117–144. - PMC - PubMed
    1. Battefeld A., Tran B.T., Gavrilis J., Cooper E.C., Kole M.H.P. Heteromeric Kv7.2/7.3 channels differentially regulate action potential initiation and conduction in neocortical myelinated axons. J. Neurosci. 2014;34:3719–3732. - PMC - PubMed

Publication types