. 2020 Jan 9;180(1):188-204.e22.
doi: 10.1016/j.cell.2019.11.036. Epub 2019 Dec 26.

A Patient-Derived Glioblastoma Organoid Model and Biobank Recapitulates Inter- and Intra-tumoral Heterogeneity

Affiliations

A Patient-Derived Glioblastoma Organoid Model and Biobank Recapitulates Inter- and Intra-tumoral Heterogeneity

Fadi Jacob et al. Cell. .

Abstract

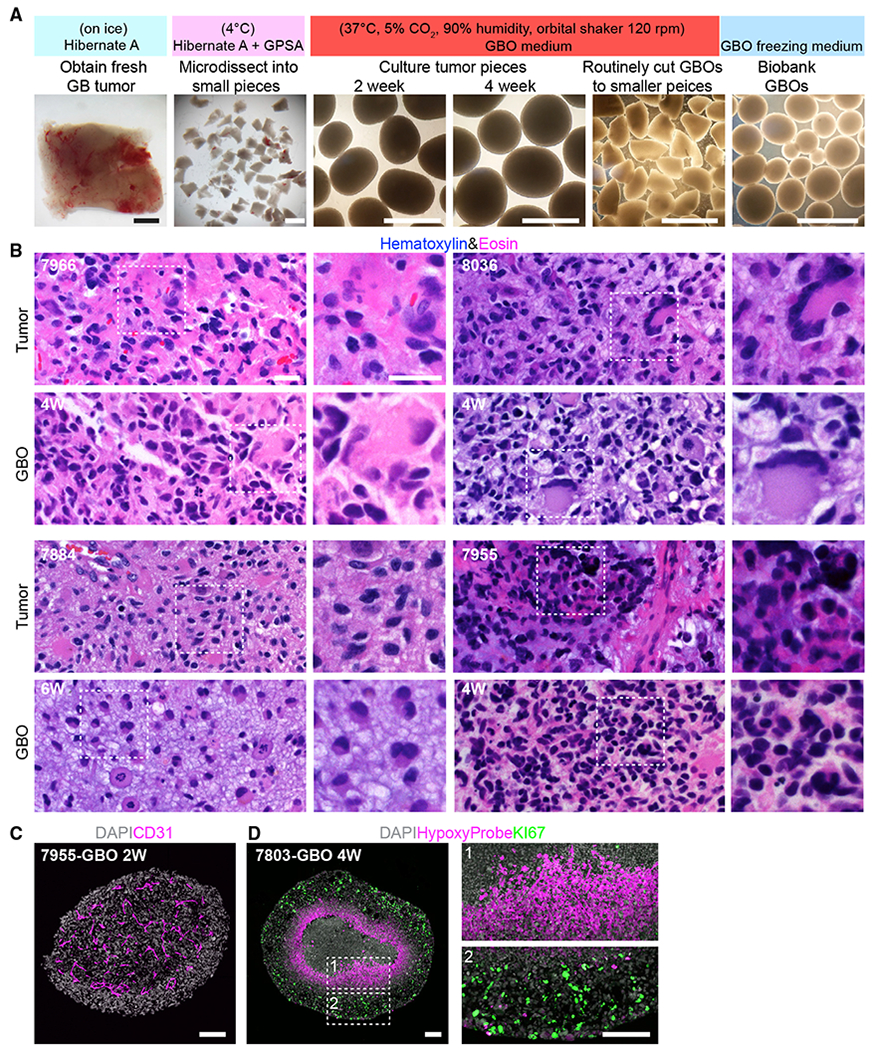
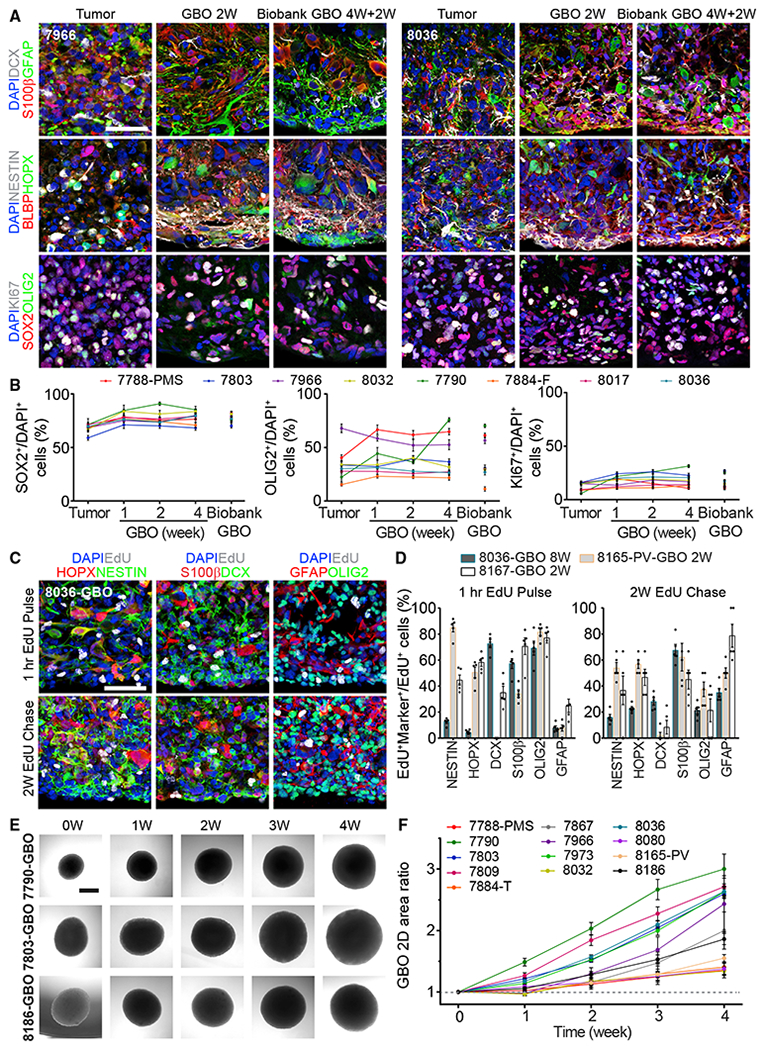
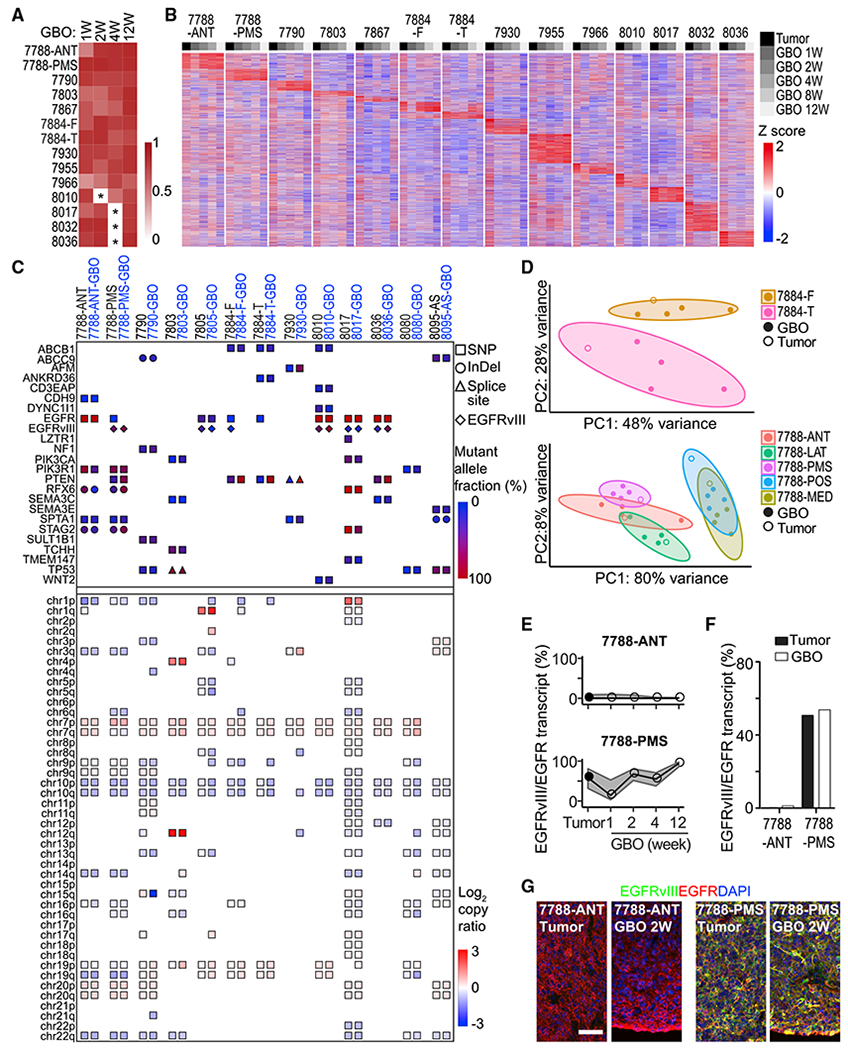
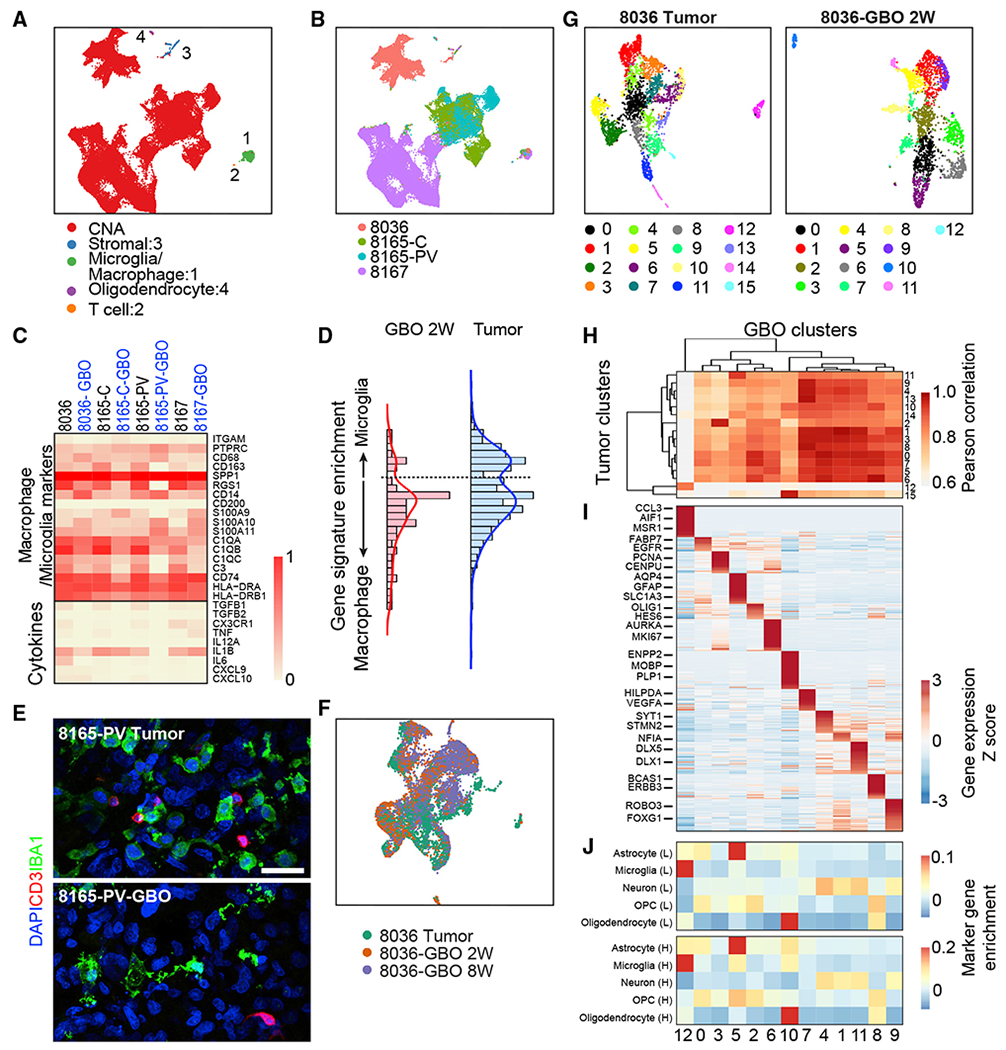
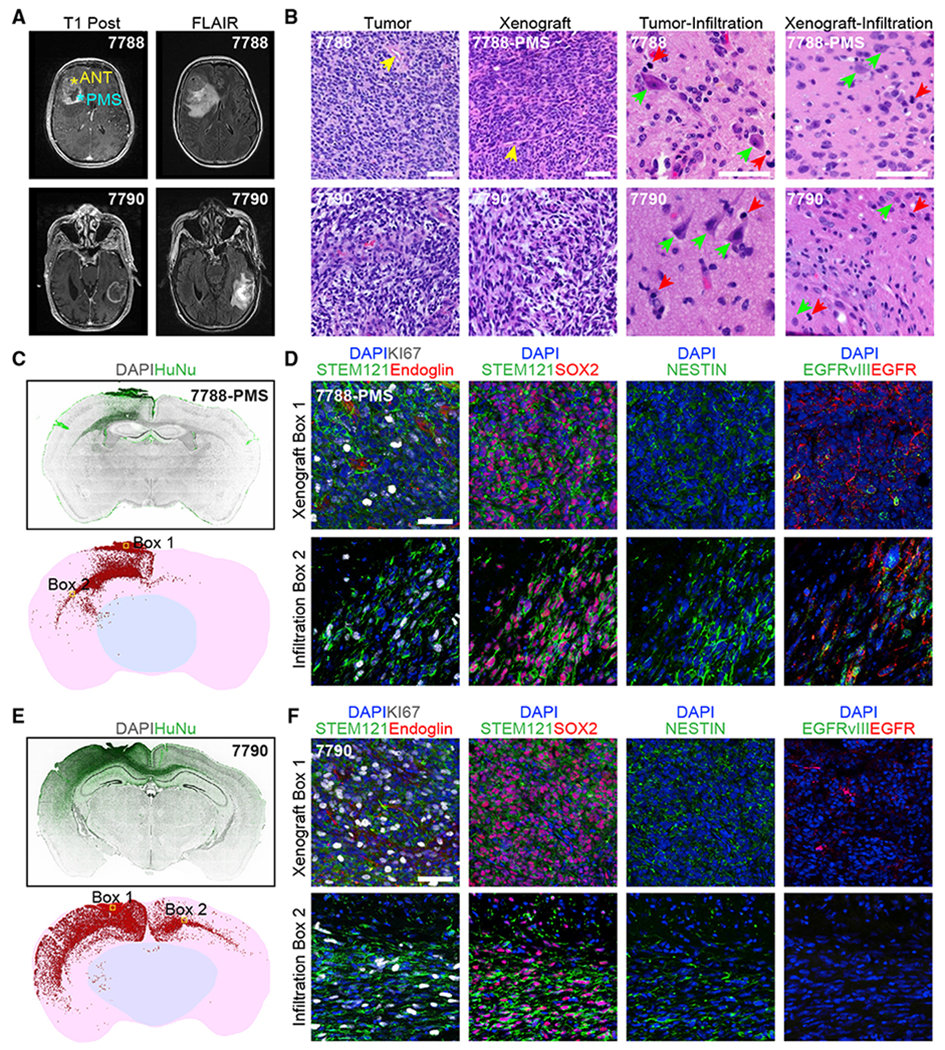
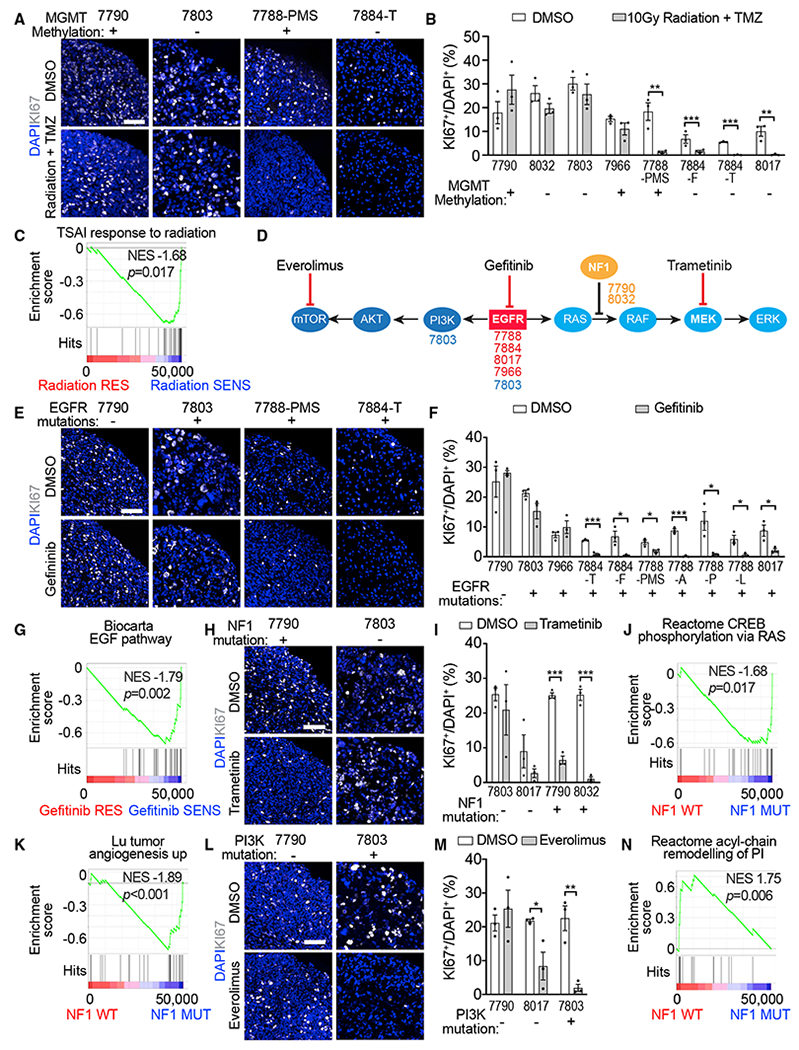
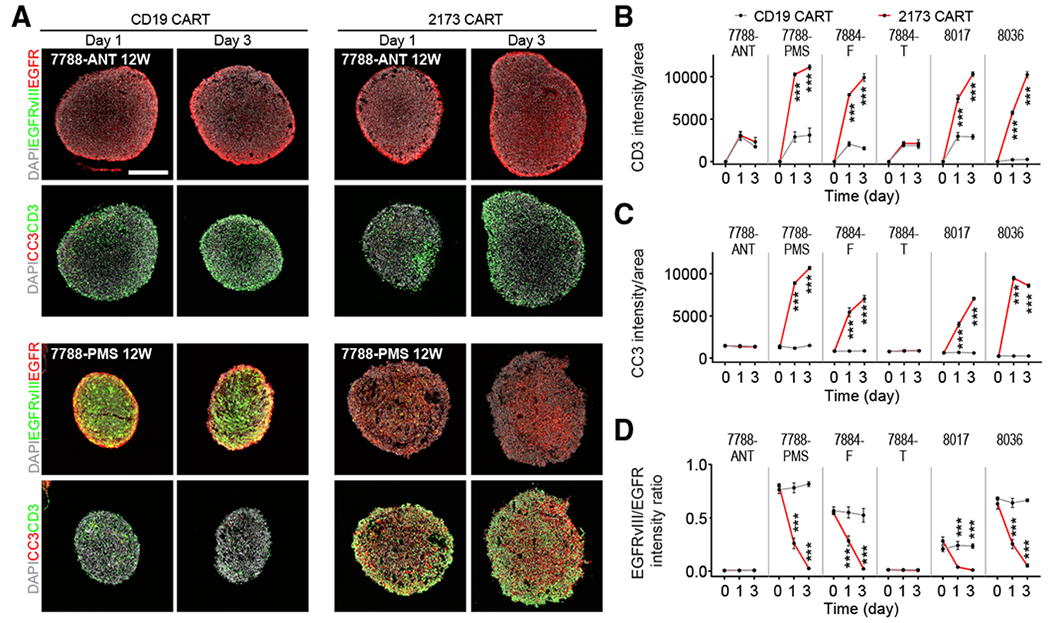
Glioblastomas exhibit vast inter- and intra-tumoral heterogeneity, complicating the development of effective therapeutic strategies. Current in vitro models are limited in preserving the cellular and mutational diversity of parental tumors and require a prolonged generation time. Here, we report methods for generating and biobanking patient-derived glioblastoma organoids (GBOs) that recapitulate the histological features, cellular diversity, gene expression, and mutational profiles of their corresponding parental tumors. GBOs can be generated quickly with high reliability and exhibit rapid, aggressive infiltration when transplanted into adult rodent brains. We further demonstrate the utility of GBOs to test personalized therapies by correlating GBO mutational profiles with responses to specific drugs and by modeling chimeric antigen receptor T cell immunotherapy. Our studies show that GBOs maintain many key features of glioblastomas and can be rapidly deployed to investigate patient-specific treatment strategies. Additionally, our live biobank establishes a rich resource for basic and translational glioblastoma research.

Keywords: CAR-T cells; Organoid; biobank; cancer modeling; drug testing; glioblastoma; personalized therapies; translational; tumor heterogeneity; xenograft.


Conflict of interest statement

DECLARATION OF INTERESTS

J.F.D. has ownership interest (including equity, patents, etc.) in Liquid Biotech USA, Inc., and PolyAurum, LLC. The University of Pennsylvania has submitted a patent application based on the EGFRvIII digital PCR assay utilized. Other authors declare no competing interests.

Figures

Figure 1.
Figure 1.. Generation of GBOs that Retain Histologic Features of Parental Tumors
(A) A schematic of the procedure with sample bright-field images. Scale bar, 1 mm. (B) Sample H&E staining images of parental tumors and corresponding GBOs. Age of GBOs in weeks (W) is listed. Scale bars, 20 μm. (C) Sample confocal image of micro-vasculature retained in GBO with immunostaining for CD31. Scale bar, 100 μm. (D) Sample confocal images showing the hypoxia gradient present in a large GBO with immunostaining for HypoxyProbe and KI67. Insets highlight KI67+ proliferating cells at the periphery (box 2), but not in the hypoxic core (box 1). Scale bars, 100 μm. See also Figure S2 and Tables S1 and S2.
Figure 2.
Figure 2.. GBOs Retain and Continuously Generate Heterogeneous Cell Populations
(A) Sample confocal images of immunostaining for different markers showing the maintenance of parental tumor cell populations in cultured GBOs and GBOs recovered from the biobank for two patients. See Figure S1A for additional samples. Scale bar, 50 μm. (B) Quantifications of SOX2+, OLIG2+, and KI67+ cells in 8 parental tumors, corresponding GBOs for different culture periods, and those recovered from the biobank (4W+2W). Values represent mean ± SEM (n = 5). (C and D) EdU pulse-chase experiments. GBOs were incubated with 1 μM EdU for 1 h and immunohistology for different markers was performed 1 h and 2 weeks later. Shown are sample confocal images (C; scale bar, 50 μm) and quantifications of EdU+Marker+ cells among EdU+ cells after 1-h EdU pulse and 2-week EdU chase (D). Dots represent data from individual GBOs and bar values represent mean ± SEM (n = 5). (E and F) Growth of biobanked GBOs after recovery. Shown are sample bright-field images of individual GBOs recovered from the biobank (E; scale bar, 500 μm) and quantification of the ratio of the measured 2D area at each time point to the 2D area at time point 0 for the same GBOs recovered from the biobank (F). Values represent mean ± SEM (n = 10 GBOs per sample). See also Figures S1 and S2 and Tables S1 and S2.
Figure 3.
Figure 3.. GBOs Maintain Inter- and Intra-tumoral Heterogeneity of Gene Expression and Mutational Profiles of Corresponding Parental Tumors
(A) Heatmap of transcriptome-wide gene expression Pearson correlations between parental tumors and corresponding GBOs as determined by RNA-seq. *Unsampled time points. (B) Gene expression heatmap of the top 10,000 most variably expressed genes in parental tumors. (C) Somatic variants in glioblastoma-associated genes (top panels) and copy number variations in autosomal chromosomal arms (bottom panels) identified by whole-exome sequencing of parental tumors, derived GBOs at 2 weeks and corresponding blood samples. The types of variants and allele frequencies are listed (see Table S3). The EGFRvIII mutation was determined by RNA-seq. (D) RNA-seq gene expression PCA plots of subregional samples for parental tumors and corresponding GBOs for different culture periods for two patients with 90% confidence ellipses. (E) EGFRvIII transcript abundance relative to EGFR as determined by RNA-seq in parental tumors and corresponding GBOs with 95% credible intervals. (F) EGFRvIII transcript abundance relative to EGFR as determined by digital PCR in parental tumors and corresponding GBOs at 2 weeks. (G) Confocal images of EGFRvIII and EGFR immunostaining and DAPI for parental tumors and corresponding GBOs. Scale bar, 50 μm. See also Figure S3 and Tables S1, S2, and S3.
Figure 4.
Figure 4.. Single-Cell RNA-Seq Analyses of Parental Tumors and Corresponding GBOs
(A) UMAP plot of single-cell RNA expression from UP-8036, UP-8165-C, UP-8165-PV, and UP-8167 parental tumors and corresponding GBOs. Neoplastic cells are identified and colored by the presence of CNAs (see Figure S4A). Non-neoplastic cell clusters shared by cells from different patients and corresponding GBOs are colored and marked: 1 (microphage/microglia cluster), 2 (T cell cluster), 3 (stromal cell cluster), and 4 (mature oligodendrocyte cluster). (B) UMAP plot of single-cell RNA expression from four parental tumors and corresponding GBOs. Cells are colored by patients and subregions. (C) Heatmap of gene expression of selected macrophage/microglia marker genes and cytokines in the macrophage/microglia cell cluster (1 in A). (D) Histogram of microglia versus macrophage gene signature expression in cells from the macrophage/microglia cell population from all parental tumors and all GBOs at 2 weeks. (E) Confocal images of immunostaining for microphage/microglia marker IBA1 and T cell marker CD3 in the parental tumor and corresponding GBO at 2 weeks. Scale bar, 50 μm. (F) UMAP plot of UP-8036 parental tumor and GBOs at 2 and 8 weeks colored by samples. (G) UMAP plots of UP-8036 parental tumor and GBOs at 2 weeks colored by cluster. The same cluster number is listed in (H) and (J). (H) Heatmap of gene expression Pearson correlation of clusters identified in the UP-8036 parental tumor (rows) and GBOs at 2 weeks (columns) with hierarchical clustering by Euclidian distance. (I) Heatmap of gene expression of cluster-specific markers in UP-8036-GBOs with columns corresponding to (H). See Table S4 for the detailed gene list. (J) Comparison of cell clusters in UP-8036 GBOs at 2 weeks (corresponding to that in H) with normal adult brain cells identified by single-nuclei RNA-seq of human adult brains in Lake et al. (2018) (L, top panel) and Habib et al. (2017) (H, bottom panel) with marker gene enrichment analysis. OPC, oligodendrocyte precursor cell. See also Figure S4 and Tables S1, S2, and S4.
Figure 5.
Figure 5.. Orthotopic Transplantation of GBOs into Adult Immunodeficient Mice Displays Efficient Engraftment and Extensive Infiltration into the Brain Parenchyma
(A) MRI T1 post-contrast (left) and FLAIR (right) patient brain images. (B) Sample H&E staining images of the tumor bulk versus infiltrated areas of parental patient tissues and the original xenograft sites and infiltrated areas for corresponding GBOs at 2 months post-transplantation. Prominent blood vessels (yellow arrow heads) are observed in both the tumor bulk in patients and original GBO xenograft sites in mice. Infiltrated areas are shown with human neurons and mouse neurons (green arrow heads) and tumor cells (red arrow heads), respectively. Scale bar, 100 μm. (C and D) Xenograft of UP-7788-PMS-GBO at 2 months post-transplantation. (C) Coronal section views of human nuclear antigen (HuNu) immunostaining (top) and reconstruction for quantification of infiltrated cells (bottom). Each red dot represents a HuNu+ cell. (D) Sample confocal images of areas in box 1 and 2 in (C, bottom panel) for immunostaining of human-specific cytoplasmic antigen (STEM121) showing the extensive vascularization from the host (endoglin immunostaining) in the original xenograft site, and proliferation (KI67 immunostaining), progenitor (SOX2, NESTIN immunostaining), and EGFR/mutant EGFRvIII expression status of tumor cells in the original xenograft site (box 1) and the infiltrated area (box 2). Scale bar, 50 μm. (E and F) Xenograft of UP-7790-GBO at 2 months post-transplantation. Cornal section image and reconstruction (E) and sample confocal images in box 1 and 2 (F) are similar as in (C) and (D). See also Figure S5, Tables S1, S2, and S5, and Video S1.
Figure 6.
Figure 6.. Therapeutic Testing of GBOs In Vitro
(A–C) Treatment of GBOs with 10 Gy radiation and temozolomide (TMZ; 50 μM). (A) Sample confocal images of KI67 immunostaining and DAPI staining. Scale bar, 100 μm. The MGMT methylation status identified in each parental tumor is listed. (B) Quantification of percentages of KI67+ cells among DAPI+ cells. See Table S6 for the age of GBOs used in the analysis. Dots represent individual data points and bar values represent mean ± SEM (n = 3; *p < 0.05; **p < 0.01; ***p < 0.001; Student’s t test). (C) Gene set enrichment in GBOs with significant reduction of KI67+ cells following radiation and temozolomide treatment. (D) Schematic of targeted treatment strategy showing genetic pathways, location of tumor-specific mutations, and mechanism of action of targeted treatments. The mutations were based on identifications in patient tumor samples via clinical sequencing (see Table S1). (E–G) Treatment of GBOs with gefitinib (5 μM). Sample images (E) and quantification (F) are similar as in (A) and (B). Shown in (G) is gene set enrichment in samples with significant reduction of KI67+ cells following gefitinib treatment. (H–K) Treatment of GBOs with trametinib (1 μM). Sample image (H) and quantification (J) are similar as in (A) and (B). Also shown are gene set enrichment in samples with NF1 mutations (J and K). (L–N) Treatment of GBOs with everolimus (1 μM). Sample images (L) and quantification (M) are similar as in (A) and (B). Shown in (N) is gene set enrichment in samples without NF1 mutations. See also Figure S6 and Tables S1, S2, and S6.
Figure 7.
Figure 7.. Modeling Immunotherapy with Co-cultures of CAR-T Cells and GBOs
(A) Sample confocal images of immunostaining of EGFR, EGFRvIII, cleaved-caspase-3 (CC3), and CD3 after 1 and 3 days of co-culture with either CD19 or 2173BBz CAR-T cells. Scale bar, 200 μm. (B–D) Summary of quantifications of averaged signal intensity of CD3 (B), CC3 (C), and averaged EGFRvIII/EGFR signal intensity ratio (D) in GBOs after co-culture with either CD19 or 2173BBz CAR-T cells. Values represent mean ± SEM (n = 3; ***p < 0.001; two-way ANOVA with uncorrected Fisher LSD test). See also Figure S7 and Tables S1 and S2.

Comment in

References

    1. Arif SH, Pandith AA, Tabasum R, Ramzan AU, Singh S, Siddiqi MA, and Bhat AR (2018). Significant Effect of Anti-tyrosine Kinase Inhibitor (Gefitinib) on Overall Survival of the Glioblastoma Multiforme Patients in the Backdrop of Mutational Status of Epidermal Growth Factor Receptor and PTEN Genes. Asian J. Neurosurg 13, 46–52. - PMC - PubMed
    1. Backos DS, Franklin CC, and Reigan P (2012). The role of glutathione in brain tumor drug resistance. Biochem. Pharmacol 83, 1005–1012. - PubMed
    1. Bagley SJ, Schwab RD, Nelson E,Viaene AN, Binder ZA, Lustig RA, O’Rourke DM, Brem S, Desai AS, and Nasrallah MP (2019). Histopathologic quantification of viable tumor versus treatment effect in surgically resected recurrent glioblastoma. J. Neurooncol 141, 421–429. - PubMed
    1. Berg DA, Su Y, Jimenez-Cyrus D, Patel A, Huang N, Morizet D, Lee S, Shah R, Ringeling FR, Jain R, et al. (2019). A Common Embryonic Origin of Stem Cells Drives Developmental and Adult Neurogenesis. Cell 177, 654–668. - PMC - PubMed
    1. Bian S, Repic M, Guo Z, Kavirayani A, Burkard T, Bagley JA, Krauditsch C, and Knoblich JA (2018). Genetically engineered cerebral organoids model brain tumor formation. Nat. Methods 15, 631–639. - PMC - PubMed

Publication types