. 2020 Jan 14;52(1):167-182.e7.
doi: 10.1016/j.immuni.2019.12.004. Epub 2019 Dec 26.

Targeted Complement Inhibition at Synapses Prevents Microglial Synaptic Engulfment and Synapse Loss in Demyelinating Disease

Affiliations

Targeted Complement Inhibition at Synapses Prevents Microglial Synaptic Engulfment and Synapse Loss in Demyelinating Disease

Sebastian Werneburg et al. Immunity. .

Abstract

Multiple sclerosis (MS) is a demyelinating, autoimmune disease of the central nervous system. While work has focused on myelin and axon loss in MS, less is known about mechanisms underlying synaptic changes. Using postmortem human MS tissue, a preclinical nonhuman primate model of MS, and two rodent models of demyelinating disease, we investigated synapse changes in the visual system. Similar to other neurodegenerative diseases, microglial synaptic engulfment and profound synapse loss were observed. In mice, synapse loss occurred independently of local demyelination and neuronal degeneration but coincided with gliosis and increased complement component C3, but not C1q, at synapses. Viral overexpression of the complement inhibitor Crry at C3-bound synapses decreased microglial engulfment of synapses and protected visual function. These results indicate that microglia eliminate synapses through the alternative complement cascade in demyelinating disease and identify a strategy to prevent synapse loss that may be broadly applicable to other neurodegenerative diseases. VIDEO ABSTRACT.

Keywords: complement; demyelination; engulfment; gene therapy; microglia; multiple sclerosis; neural-immune; neurodegeneration; neuroinflammation; synapse.


Conflict of interest statement

Declaration of Interests

The authors declare no conflict of interest.

Figures

Figure 1:
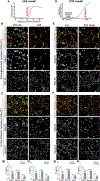
Figure 1:. Synapse loss and engulfment of presynaptic terminals occurs in the LGN of MS patients and in a preclinical marmoset EAE model.
(A,B) Coronal sections of the LGN from human controls (ctrl.) without neurological disease and from MS cases are shown. (A,Ai) Quantification of VGluT2+-retinogeniculate presynaptic input density (red) and (B,Bi) engulfment of VGluT2+-presynaptic inputs within (arrows) Iba1+-microglia/macrophages (green). (Ai) n=5 human subjects per condition. (Bi) n=3 ctrl./5 MS subjects. Scale bars, 10 μm. (C-F) Representative images of the LGN from non-EAE or EAE animals with no detectable lesions (control, no lesions) and marmosets that developed EAE with demyelinating lesions in the optic nerve and tract (EAE with ON/OT lesions). (Ci) Quantification of VGluT2+-input density (red) and (Di) engulfment of VGluT2+-presynaptic RGC inputs (Di) within Iba1+-cells (green) in the LGN from marmosets that developed ON/OT lesions following EAE compared to controls. (D) Inset shows phagocytic cups within Iba1+-cell (green), containing VGluT2+-retinogeniculate synaptic material (red). (E,F) Immunostaining and quantification of VGluT1+-corticothalamic presynaptic inputs (E) density and (F) engulfment within Iba1+-cells (arrows denote engulfed VGluT1+-corticothalamic inputs). (C-F) n=6 marmosets per condition from two experiments. Scale bars, 10 μm. Data represent mean ± SEM, significant differences with ***P< 0.001, ****P <0.0001, t-test. See also Fig. S1 & Table S1+2.
Figure 2:
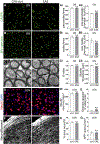
Figure 2:. Synapse loss is a common feature in the retinogeniculate circuit of multiple MS-relevant mouse models.
(A) Schematic of the course of clinical symptoms in EAE of C57Bl6/J WT mice. Mice were analyzed at the onset of moderate clinical symptoms, typically observed between day 10–12 post-immunization. (B,C) Representative images of the LGN from CFA-control and EAE-induced mice immunostained against (B) presynaptic VGluT2 (green) and postsynaptic PSD-95 (red) or (C) presynaptic VGluT1 (green) and postsynaptic Homer1 (red). (Bi-Ci) Quantification of synaptic staining in B,C. n=4 mice per condition from one experiment. (D) Schematic for tamoxifen-induced genetic depletion of mature oligodendrocytes in Plp1-CreERT;ROSA26-EGFP-DTA (DTA) mice. Tamoxifen-injected ROSA26-EGFP-DTA mice were used as controls (ctrl.). The LGN of mice was analyzed at 35 days post induction. (E,F) Representative confocal images of the LGN from control and DTA mice immunostained against (E) presynaptic VGluT2 (green) and postsynaptic PSD-95 (red) or (F) presynaptic VGluT1 (green) and postsynaptic Homer1 (red). (Ei-Fi) Quantification of synaptic staining in E,F. (E,F) n=5 ctrl./4 DTA mice from two experiments. (B-F) Scale bars, 5 μm. Data represent mean ± SEM, significant differences with **P < 0.01, ****P < 0.0001, t-test. See also Figs. S2,3,5.
Figure 3:
Figure 3:. Synapse loss in the LGN can occur in the absence of significant demyelination, cell death, or axon degeneration at early stages of mouse EAE.
(A,B) Analysis of the optic nerve (ON) and (D-G) adjacent LGN sections of the same CFA-control and EAE-treated mice shown in Fig. 2. Representative images of (A) anti-CASPR-labeled paranodes and (B) anti-βIV-spectrin-labeled nodes of Ranvier and quantification of nodal and paranodal (Ai,Bi) density and (Aii,Bii) size (normalized to controls). (A,B) Scale bars, 10 μm. (C) Ultrastructural analysis of the ON of an additional cohort of EAE mice at the onset of EAE (average: 12.2±1.6dpi) that displayed comparable average clinical score (1.2 ±0.25) to the mice analyzed in Fig. 2 and Fig. 3A,B,D-F. Representative EM images of the optic nerve from EAE and CFA-ctrl. mice at 15,000x magnification. Scale bars, 0.5 μm. (Ci) G-ratio (ratio between the axon and fiber diameters) and (Cii) myelin thickness were quantified from EM images. (D) Representative images of immunostaining in the LGN for the neuronal maker NeuN (red), with DAPI counterstain labeling all nuclei (blue) and quantification of the density of (Di) NeuN+-neurons and (E) cleaved caspase 3+-cells, a marker of cell death. (F) Representative images of neurofilament (neurofil.)-labeled axons and quantification of (Fi) neurofilament+-axon density and (G) amyloid precursor protein (APP), a marker of axonal degeneration, induction. (D,F) Scale bars, 20 μm. (A,B,D-G) n=4 mice from one experiment, (C) n=5 mice per condition from one experiment. Data represent mean ± SEM, no significant differences (n.s.), t-test. See also Figs. 2, and S2,3.
Figure 4:
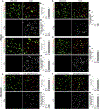
Figure 4:. Microglia, but not astrocytes, engulf presynaptic inputs in multiple models of demyelinating disease.
Synapse engulfment was analyzed in the LGN from the same mouse EAE tissue (A-C,F, see also Figs. 2,3, and S2,3) and the same mouse DTA tissue (D,E,G, see also Figs. 2, and S5) where synapse loss was observed. (A-C) Representative immunofluorescence images and 3D-surface rendering of P2RY12+-microglia (green) containing engulfed (A) VGluT2+-retinogeniculate inputs (red, inserts), (B) VGluT1+corticothalamic inputs (red, inserts), or PSD-95+-postsynaptic compartments (red, inserts) within CD68-labeled microglial lysosomes (blue) in the EAE model. (Ai-Ci) Quantification of presynaptic inputs within microglial lysosomes in EAE vs. CFA control mice. (D,E) Representative confocal images and 3D rendering of P2RY12 (green), CD68 (blue) and (D) VGluT2 (red) or (E) VGluT1 (red) in the DTA model. (Di-Ei) Quantification of presynaptic inputs within microglial lysosomes in the DTA model. (F) Representative images and 3D-surface rendering of ALDH1L1+-astrocytes (green) and VGluT2+-retinogeniculate inputs (red, inserts) within LAMP2-labeled lysosomes (blue) in the LGN of EAE and CFA control mice. (Fi) Quantification of VGluT2 engulfment within lysosomes of reactive astrocytes in the EAE model. (G,H) Quantification of VGluT2+-retinogeniculate inputs within LAMP2+-lysosomes of ALDH1L1-labeled astrocytes in the (G) mouse DTA model and (H) in the marmoset EAE model. (A-C,F) n=4 mice per condition from one experiment, (D,E,G) n= 6 ctrls./5 DTA mice per condition from two experiments, (H) n=6 marmosets per condition from two experiments. (A-F) Scale bars, 10 μm. Data represent mean ± SEM, significant differences with ****P< 0.0001, t-test. See also Figs. S2,3, and S2,3,5.
Figure 5:
Figure 5:. Complement component C3, but not C1q, localizes to synapses in mouse and marmoset EAE models.
(A-D) Representative confocal images of the same control and EAE mouse LGN shown in Figs. 2–4 immunostained against presynaptic (A,C) VGluT2 (green) or (B,D) VGluT1 (green) and complement component (A,B) C1q (red) or (C,D) C3 (red). Quantification of total (Ai) C1q and (Ci) C3 fluorescence area, and colocalization of (Aii,Bi) C1q or (Cii,Di) C3 with presynaptic compartments in the LGN of CFA-ctrl. and EAE mice. (A-D) n=3 mice per condition from one experiment. Scale bars, 5 μm. (E,F) Representative coronal sections of the LGN from the same control marmosets and animals that developed EAE with demyelinating lesions in the optic nerve and tract (ON/OT lesions) shown in Fig. 1 stained against presynaptic VGluT2 (green) and (E) complement component C1q or (F) complement factor C3 (red). (Ei-F) Quantification of total (Ei) C1q and (Fi) C3 area, and colocalization (Eii,Fii) to VGluT2+-presynaptic compartments in marmoset LGN. (E,F) n=4 marmosets per condition from two experiments. Scale bars, 5 μm. Data represent mean ± SEM, significant differences with **P < 0.01, ***P < 0.001, ****P < 0.0001, t-test. See also Figs. 1–4, and S1-3.
Figure 6:
Figure 6:. AAV9 delivery of the C3 inhibitor Crry decreases deposition of synaptic C3.
(A) Linear map of the AAV-Crry construct. ITR, inverted terminal repeat. CMV, human cytomegalovirus promotor. P2A, autocleavage site. An, polyadenylation signal. (B) Representative immunoblots of Crry, EGFP, and GAPDH of homogenates from AAV-EGFP and AAV-Crry-EGFP (AAV-Crry) transduced neuro-2A cells. (C) Timeline of in vivo AAV-rescue experiments. (D) Representative confocal images of the LGN of AAV-EGFP or AAV-Crry-EGFP (AAV-Crry) injected mice stained against EGFP (green) and presynaptic VGluT2 (red). DAPI, nuclei counterstain (blue). Scale bars, 10 μm. Inset shows magnified details. (Di) Colocalization (Coloc., yellow) analysis of EGFP with VGluT2+-retinogeniculate terminals in AAV-EGFP and AAV-Crry treated mice. (E) Representative confocal images of the LGN of CFA-ctrl. and EAE-induced mice that received intravitreal injections with AAV-EGFPs or AAV-Crry immunostained for Crry and EGFP. (Ei) Quantification of Crry fluorescence intensity (data normalized to CFA-ctrls.) in the LGN. (F) Representative images of Crry and VGluT2 immunostaining in the LGN and (Fi,Fii) quantification of Crry intensities at presynaptic terminals (Fi, VGluT2+-area, and Fii, VGluT1+-area) vs. non-synaptic areas (Fi, VGluT2--area, Fii, VGluT1--area). (G,H) Representative confocal images of the LGN of AAV-EGFP or AAV-Crry-treated EAE mice immunostained against presynaptic (G) VGluT2 or (Gi) VGluT1 (green) and complement factor C3 (red) and (H) presynaptic VGluT2 or (Hi) VGluT1 (green) and complement factor C1q (red). (Gii,Hii) Quantification of total and synapse-associated (Gii) C3 and (Hii) C1q in the LGN of AAV-EGFP- and AAV-Crry-treated EAE mice. (G,H) Scale bars, 5 μm. (D-H) n=5 mice from one experiment. Data represent mean ± SEM, significant differences with *P < 0.05, **P < 0.01, ***P < 0.001, ****P < 0.0001, (D,F) t-test, (E,G,H) ANOVA with Tukey’s post hoc test. See also Fig. S7.
Figure 7:
Figure 7:. Synapse-localized Crry blocks microglial synapse engulfment and synapse loss in the LGN and restores visual function.
(A) Timeline of in vivo AAV-rescue experiments. (B-N) Analyses of adjacent LGN sections of onset EAE mice shown in Fig. 6. (B-D) Quantification of (B) MOG, MAG and MBP, (C) NeuN+-neuron, and (D) neurofilament+-axon density following intraocular AAV injection in the EAE model. (E-G) Quantification of (E) microglia soma size, (F) density of P2RY12+-microglia and (G) Clec7a intensity AAV-treated mice in the EAE model. Further quantification of (H) GFAP+-astrocytes, (I) CD3+-T cells and (J) CD45+-leukocytes in AAV-treated mice in the EAE model. (K) Representative images and 3D-surface rendering of P2RY12+-microglia (green) and engulfed VGluT2+-retinogeniculate inputs (red) within CD68-labeled microglial lysosomes (blue). (Ki) Quantification of engulfed VGluT2+-presynaptic inputs (red, inserts) and (L) VGluT1+-presynaptic inputs within microglial lysosomes. (M,N) Representative confocal images of the LGN of AAV-EGFP and AAV-Crry treated EAE mice immunostained against presynaptic (M) VGluT2, or (N) VGluT1 and (Mi,Ni) respective quantification. (O) Visual acuity measured as spatial frequency threshold (cycles/degree) in the optomotor test before the induction of EAE (three left columns) and at the onset of clinical symptoms (three right columns) of the same control and AAV-EGFP or AAV-Crry transduced mice as shown in B-N. (B-J) n=4, (K-N) n=5, (O) n=5–8 mice from one experiment. Scale bars, (K) 10 μm, (M,N) 5 μm. Data represent mean ± SEM, significant differences with *P<0.05, **P<0.01, ***P <0.001, ****P < 0.0001, ANOVA with Tukey’s post hoc test. See also Figs. 6, and S7.

Comment in

References

    1. 2019. Global, regional, and national burden of multiple sclerosis 1990–2016: a systematic analysis for the Global Burden of Disease Study 2016. Lancet Neurol, 18, 269–285. - PMC - PubMed
    1. ABSINTA M, SATI P & REICH DS 2016. Advanced MRI and staging of multiple sclerosis lesions. Nat Rev Neurol, 12, 358–68. - PMC - PubMed
    1. AEINEHBAND S, LINDBLOM RP, AL NIMER F, VIJAYARAGHAVAN S, SANDHOLM K, KHADEMI M, OLSSON T, NILSSON B, EKDAHL KN, DARREH-SHORI T & PIEHL F 2015. Complement component C3 and butyrylcholinesterase activity are associated with neurodegeneration and clinical disability in multiple sclerosis. PLoS One, 10, e0122048. - PMC - PubMed
    1. ALAWIEH A, ELVINGTON A, ZHU H, YU J, KINDY MS, ATKINSON C & TOMLINSON S 2015. Modulation of post-stroke degenerative and regenerative processes and subacute protection by site-targeted inhibition of the alternative pathway of complement. J Neuroinflammation, 12, 247. - PMC - PubMed
    1. ALAWIEH A & TOMLINSON S 2016. Injury site-specific targeting of complement inhibitors for treating stroke. Immunol Rev, 274, 270–280. - PMC - PubMed

Publication types

MeSH terms