. 2020 Feb 4;31(2):422-437.e5.
doi: 10.1016/j.cmet.2019.11.021. Epub 2019 Dec 26.

Mitochondrial Integrity Regulated by Lipid Metabolism Is a Cell-Intrinsic Checkpoint for Treg Suppressive Function

Affiliations

Mitochondrial Integrity Regulated by Lipid Metabolism Is a Cell-Intrinsic Checkpoint for Treg Suppressive Function

Cameron S Field et al. Cell Metab. .

Abstract

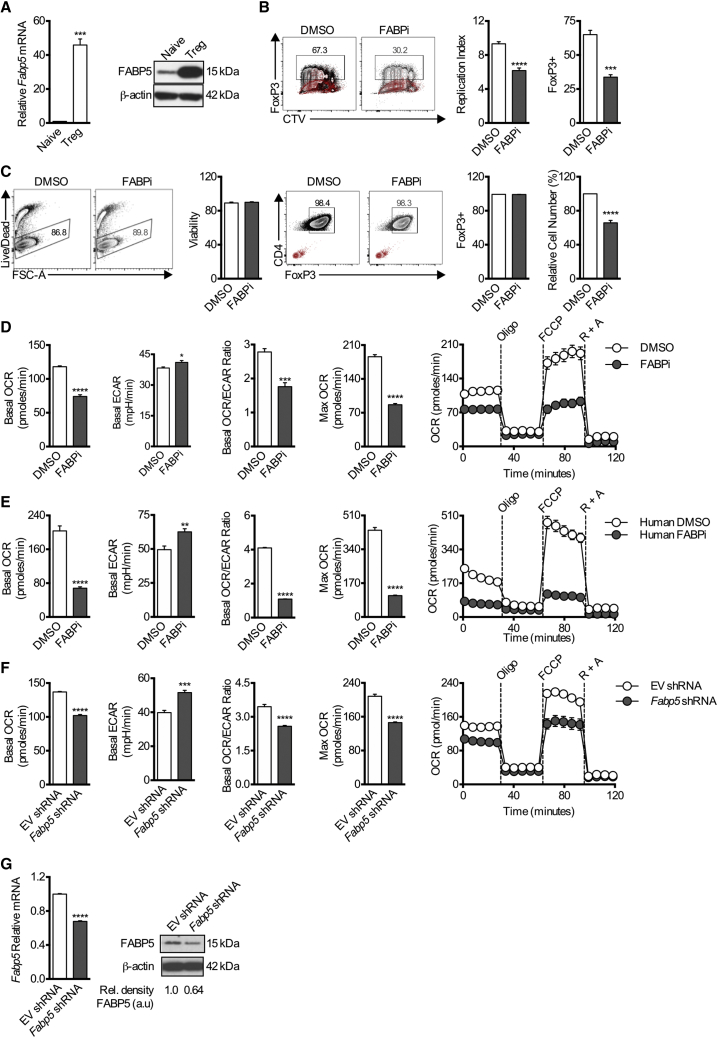
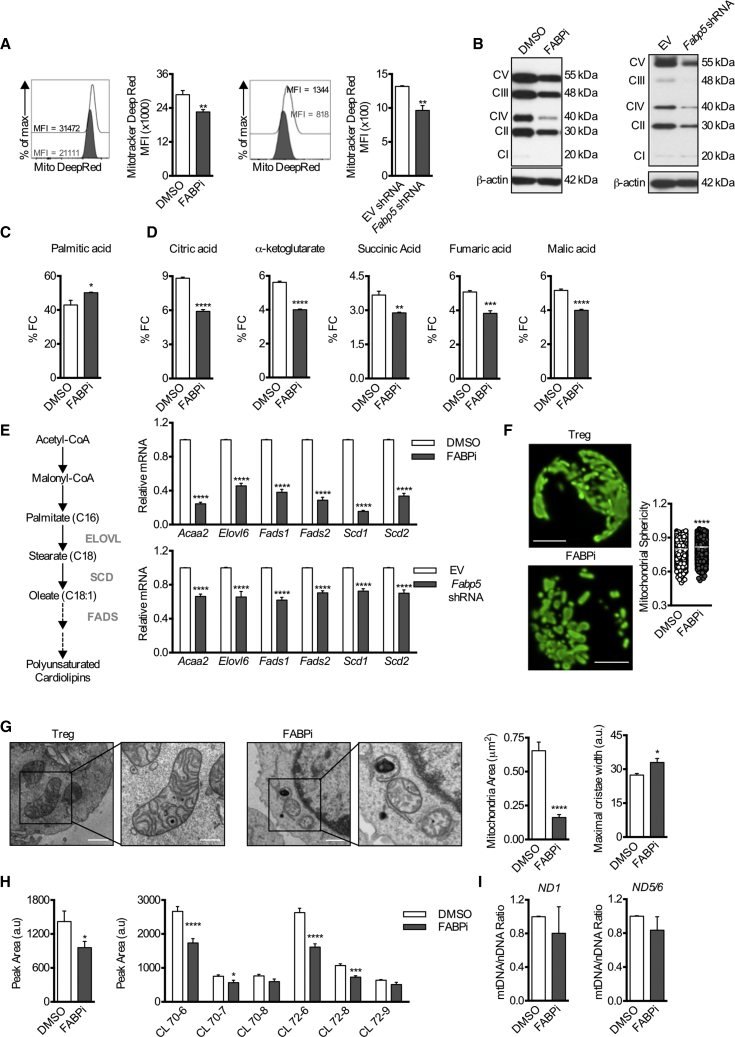
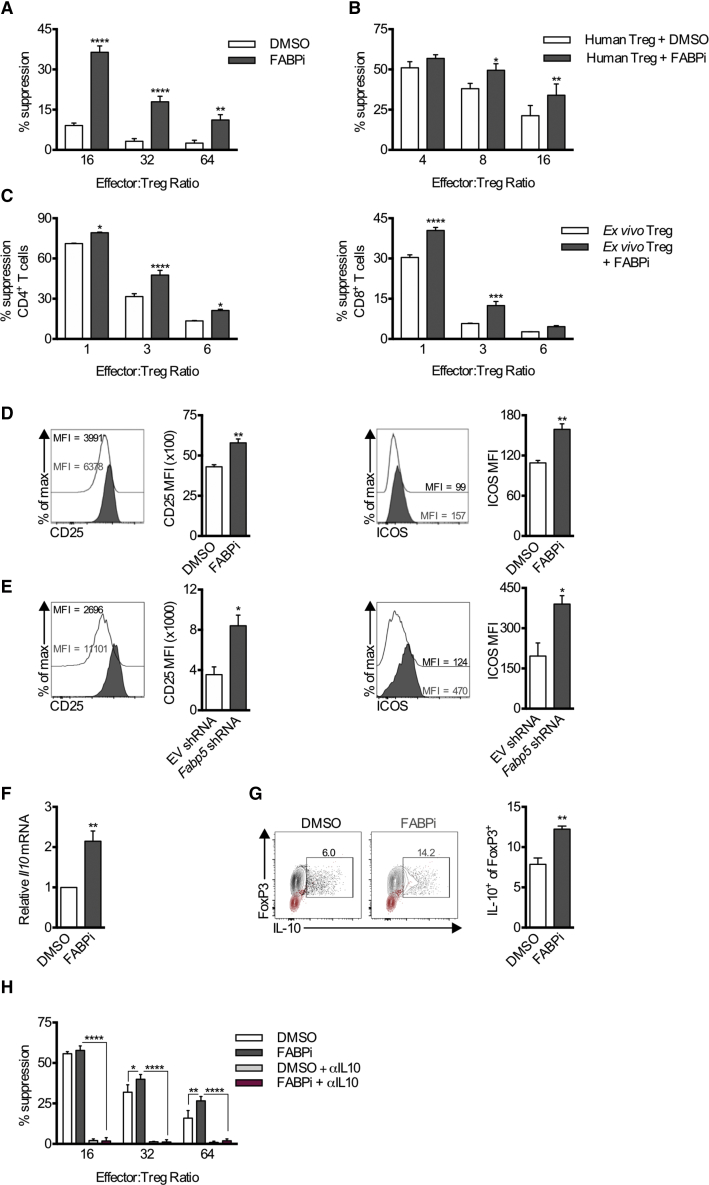
Regulatory T cells (Tregs) subdue immune responses. Central to Treg activation are changes in lipid metabolism that support their survival and function. Fatty acid binding proteins (FABPs) are a family of lipid chaperones required to facilitate uptake and intracellular lipid trafficking. One family member, FABP5, is expressed in T cells, but its function remains unclear. We show that in Tregs, genetic or pharmacologic inhibition of FABP5 function causes mitochondrial changes underscored by decreased OXPHOS, impaired lipid metabolism, and loss of cristae structure. FABP5 inhibition in Tregs triggers mtDNA release and consequent cGAS-STING-dependent type I IFN signaling, which induces heightened production of the regulatory cytokine IL-10 and promotes Treg suppressive activity. We find evidence of this pathway, along with correlative mitochondrial changes in tumor infiltrating Tregs, which may underlie enhanced immunosuppression in the tumor microenvironment. Together, our data reveal that FABP5 is a gatekeeper of mitochondrial integrity that modulates Treg function.

Keywords: FABP5; IL-10; Treg; cGAS-STING; immunometabolism; lipids; mtDNA; suppression; tumor; type I IFN.


Conflict of interest statement

Declaration of Interests E.L.P. is a SAB member of Immunomet, and E.L.P. and E.J.P. are founders of Rheos Medicines. B.R.B. receives remuneration as an advisor to Kamon Pharmaceuticals, Inc., Five Prime Therapeutics Inc., Regeneron Pharmaceuticals, Magenta Therapeutics, and BlueRock Therapeutics; research support from Fate Therapeutics, RXi Pharmaceuticals, Alpine Immune Sciences, Inc., Abbvie Inc., BlueRock Therapeutics Leukemia and Lymphoma Society, Childrens’ Cancer Research Fund, and KidsFirst Fund and is a co-founder of Tmunity.

Figures

None
Graphical abstract
Figure 1
Figure 1
Tregs Express FABP5 during In Vitro Differentiation, and Blockade Affects Differentiation and Metabolism Naive CD4+ T cells were cultured for 4 days under Treg cell-differentiation conditions. (A) Mean relative expression (±SEM) of Fabp5 mRNA in in vitro-differentiated Tregs compared to naive CD4+ T cells (n = 3). FABP5 protein expression was assessed on D4. Results represent two independent experiments. (B) Representative flow plots and quantification of Foxp3 expression and CTV dilution (±SEM) in Tregs cultured in the presence or absence of the FABP5 inhibitor BMS309403 (n = 4). Results represent three independent experiments. Gating controls are depicted in red. (C) Naive CD4+ T cells were cultured for 3 days under Treg differentiation conditions before overnight BMS309403 treatment, and mean viability, relative cell number, and Foxp3 expression (±SEM) were measured (n = 4). Results represent >6 independent experiments. Gating controls are depicted in red. (D–F) Mean (±SEM) basal OCR, basal ECAR, OCR/ECAR ratio and maximal respiration (after FCCP) of in vitro-differentiated mouse Tregs (n = 5). Results represent >6 independent experiments. (D) In vitro-differentiated human Tregs (n = 6). Results represent three independent experiments (E) or in vitro-differentiated mouse Tregs expressing Fabp5 shRNA (n = 5). Results represent two independent experiments. (F) cultured in the presence or absence of BMS309403 overnight at baseline, and in response to oligomycin (Oligo), FCCP, and rotenone and antimycin A (R + A). (G) qPCR and protein expression of FABP5 following shRNA knockdown. Results represent two independent experiments. p < 0.05, ∗∗∗p < 0.005, ∗∗∗∗p < 0.001. P values were calculated using a two-tailed, unpaired t test.
Figure 2
Figure 2
Impaired OXPHOS, Lipid Metabolism, and Loss of Cristae Structure Underlie Mitochondrial Alterations in Tregs Following FABP5 Inhibition Naive CD4+ T cells were cultured for 3 days under Treg cell differentiation conditions before overnight BMS309403 treatment or were transduced with lentivirus expressing Fabp5 shRNA. (A) Representative histogram and mean (±SEM) quantification of MitoTracker deep red dye (n = 4). (B) Protein expression of the electron transport chain (ETC) complexes. Results represent three independent experiments. (C) Fractional contribution of 13C-Palmitate-derived carbons to the intracellular palmitate pool in Tregs following acute FABP5 inhibition (n = 4). (D) Fractional contribution of 13C-Palmitate-derived carbons to intermediates of the TCA cycle in Tregs following acute FABP5 inhibition (n = 4). Results represent two independent experiments. (E) Schematic of the generation of monounsaturated cardiolipins from acetyl-CoA by the lipid elongation and saturation pathway. Mean (±SEM) expression of genes involved in the lipid metabolism, elongation, and desaturation pathway was assessed by qPCR (n = 4). Results represent two independent experiments. (F) Tregs were differentiated in vitro from naive CD4+ T cells isolated from PhAM mice for 3 days before overnight BMS309403 treatment. Scale bar, 2 μm. Representative images and quantification of mitochondrial sphericity (n = 4) are shown. Results represent two independent experiments. (G) Electron micrographs of mitochondria and quantification of mitochondrial area and mitochondrial cristae width from Tregs following acute FABP5 blockade (n = 4). Scale bar, 2 μm in the left panels and 500 nm in the right panels. Results represent two independent experiments. (H) Left: mean (±SEM) quantification of total cardiolipin content. Right: cardiolipin species in Tregs following overnight treatment with DMSO or BMS309403 (n = 4). (I) PCR analysis of mitochondrial DNA content (mtDNA/nDNA) in Tregs following overnight treatment with DMSO or BMS309403. Mitochondrial ND1 or ND5/6 were normalized to nuclear gene expression of 18 s. Results represent two independent experiments. p < 0.05, ∗∗p < 0.01, ∗∗∗p < 0.005, ∗∗∗∗p < 0.001. P values were calculated using a two-tailed, unpaired t test (A, C, D, F, left panel, and I) or a two-way ANOVA with Bonferroni correction (E and H, right panel).
Figure 3
Figure 3
FABP5 Inhibition of Fully Differentiated Tregs Increases Suppression and Expression of the Regulatory Cytokine IL-10 Treg suppression assays were performed following acute FABP5 blockade. (A) Quantification of the mean suppression (±SEM) of responder effector cells from in vitro-differentiated Tregs following overnight BMS309403 treatment (n = 4). Results represent five independent experiments. (B) Quantification of mean suppression (±SEM) from human Tregs following BMS309403 treatment (n = 4). Results represent the combined results from 4 independent donors. (C) Quantification of mean suppression (±SEM) from ex vivo Tregs following 30 min BMS309403 treatment (n = 4). Results represent two independent experiments. (D) Representative histograms and mean (±SEM) quantification of CD25 and ICOS expression on Tregs following acute FABP5 blockade (n = 4). Results represent six independent experiments. (E) Representative histograms and mean (±SEM) quantification of CD25 and ICOS expression on Tregs following lentiviral knockdown of Fabp5. Results represent two independent experiments. (F) Mean (±SEM) expression of Il10 gene expression measured by qPCR (n = 4). (G) Mean (±SEM) protein expression of IL-10 in Tregs after overnight BMS309403 treatment (n = 5). Results represent two independent experiments. Gating controls are depicted in red. (H) Mean quantification (±SEM) of suppression from in vitro-generated Tregs following overnight BMS309403 treatment in the presence or absence of anti-IL-10 antibody (αIL10) (n = 4). Results represent four independent experiments. p < 0.05, ∗∗p < 0.01, ∗∗∗p < 0.005, ∗∗∗∗p < 0.001. P values were calculated using a two-way ANOVA with Bonferroni correction (A, B, C, and H) or a two-tailed, unpaired t test (D, E, F, and G).
Figure 4
Figure 4
Disrupting FABP5 in Tregs Triggers mtDNA Release and Consequent cGAS-STING-Dependent Type I IFN Signaling, Which Induces Heightened IL-10 Expression Naive CD4+ T cells were cultured for 3 days under Treg cell-differentiation conditions before overnight BMS309403 treatment. (A) Heatmap of the top 40 differentially regulated genes identified by RNA-seq. (B) Ingenuity pathway analysis of the top regulated pathways in Tregs after acute BMS309403 treatment. (C) Protein expression of pSTAT1Tyr701 in Tregs after FABP5 inhibition or Fabp5 shRNA. Results represent two independent experiments. (D) Representative confocal photomicrograph of mitochondrial staining and DNA in Tregs after overnight BMS309403 treatment. Scale bar, 2 μm. (E) Mean quantification (±SEM) of extra-nuclear and extra-mitochondrial nucleoid structures (n = 4). Results represent two independent experiments. (F) Quantification of cytosolic mtDNA content of Tregs after BMS309403 treatment (n = 3). Results represent two independent experiments. (G) Mean (±SEM) expression of type I IFN-related genes in Tregs after BMS309403 treatment with siRNA-mediated silencing of cGAS or STING measured by qPCR (n = 4). Results represent two independent experiments. (H) Mean (±SEM) expression of Il10 gene expression measured by qPCR (n = 4) in Tregs following overnight IFNα exposure (n = 4). Results represent two independent experiments. (I) Mean (±SEM) expression of Il10 gene expression measured by qPCR (n = 4) in IFNAR KO Tregs after overnight BMS309403 treatment (n = 4). Results represent two independent experiments. (J) Quantification of mean suppression (±SEM) from in vitro-differentiated IFNAR KO Tregs following overnight BMS309403 treatment (n = 4). Results represent three independent experiments. p < 0.05, ∗∗p < 0.01, ∗∗∗p < 0.005, ∗∗∗∗p < 0.001. P values were calculated using a two-tailed, unpaired t test (E and H) or two-way ANOVA with Bonferroni correction (F, G, I, and J). Statistics shown in (G) are relative to the FABPi group.
Figure 5
Figure 5
Tregs in the Tumor Microenvironment Exhibit a Suppressive Phenotype with Mitochondrial Alterations and Type I IFN Signaling (A) Gene expression levels in Tregs isolated from human breast cancer relative to Tregs from healthy donor PBMC generated from previously published data (Plitas et al., 2016). (B) Mice were injected with E.G7-OVA, and Tregs were isolated from the tumor or spleen on D14. Mean (±SEM) gene expression of type I IFN-related genes from intratumoral Tregs, normalized to Tregs isolated from the spleen (n = 5), is shown. Results represent two independent experiments. (C) Representative histograms and mean (±SEM) quantification of Treg lipid uptake in vivo following labeled C16 administration. Results are representative of 5 mice from one experiment. (D) Representative histograms and mean (±SEM) quantification of Mitotracker deep red staining. Results represent two independent experiments. (E) Representative histograms and mean (±SEM) quantification of CD25 and ICOS from Tregs isolated from the spleen or tumor. Results represent two independent experiments. (F) Representative flow plots and mean (±SEM) quantification of IL-10 expression from Tregs isolated from the spleen or tumor. Results represent two independent experiments. Gating controls are depicted in red. (G) Representative confocal photomicrographs of mitochondria and DNA of Tregs isolated from the tumor or spleen and quantification of mitochondrial sphericity. Scale bar, 2 μm. Results represent one experiment. (H) Mice were injected with E.G7-OVA, and serum, spleens, and tumors were excised on D14. The total lipid content of serum or interstitial fluid of the spleen or tumor was quantified by MS. Results are representative of 8 mice from one experiment. (I) Mean (±SEM) quantification of Fabp5 gene expression and protein expression in Tregs following overnight culture in lipid or glucose depleted media (n = 4). (J) Mean (±SEM) quantification of labeled C16 uptake in vitro in Tregs following overnight lipid starvation (n = 4) or from nTregs ex vivo from the spleen or tumor of mice (n = 5) as per (F). Results represent two independent experiments. p < 0.05, ∗∗p < 0.01, ∗∗∗p < 0.005, ∗∗∗∗p < 0.001. P values were calculated using a two-way ANOVA with Bonferroni correction (A and B) or two-tailed, unpaired t test (C, D, E, G, H, I, and J).

References

    1. Abe Y., Sakairi T., Beeson C., Kopp J.B. TGF-β1 stimulates mitochondrial oxidative phosphorylation and generation of reactive oxygen species in cultured mouse podocytes, mediated in part by the mTOR pathway. Am. J. Physiol. Renal Physiol. 2013;305:F1477–F1490. - PMC - PubMed
    1. Afgan E., Baker D., van den Beek M., Blankenberg D., Bouvier D., Čech M., Chilton J., Clements D., Coraor N., Eberhard C. The Galaxy platform for accessible, reproducible and collaborative biomedical analyses: 2016 update. Nucleic Acids Res. 2016;44(W1):W3–W10. - PMC - PubMed
    1. Baguley B.C. Antivascular therapy of cancer: DMXAA. Lancet Oncol. 2003;4:141–148. - PubMed
    1. Balendiran G.K., Schnutgen F., Scapin G., Borchers T., Xhong N., Lim K., Godbout R., Spener F., Sacchettini J.C. Crystal structure and thermodynamic analysis of human brain fatty acid-binding protein. J. Biol. Chem. 2000;275:27045–27054. - PubMed
    1. Battaglia M., Stabilini A., Tresoldi E. Expanding human T regulatory cells with the mTOR-inhibitor rapamycin. Methods Mol. Biol. 2012;821:279–293. - PubMed

Publication types