. 2020 Feb 20;77(4):840-856.e5.
doi: 10.1016/j.molcel.2019.11.021. Epub 2019 Dec 26.

Histone H2AK119 Mono-Ubiquitination Is Essential for Polycomb-Mediated Transcriptional Repression

Affiliations

Histone H2AK119 Mono-Ubiquitination Is Essential for Polycomb-Mediated Transcriptional Repression

Simone Tamburri et al. Mol Cell. .

Abstract

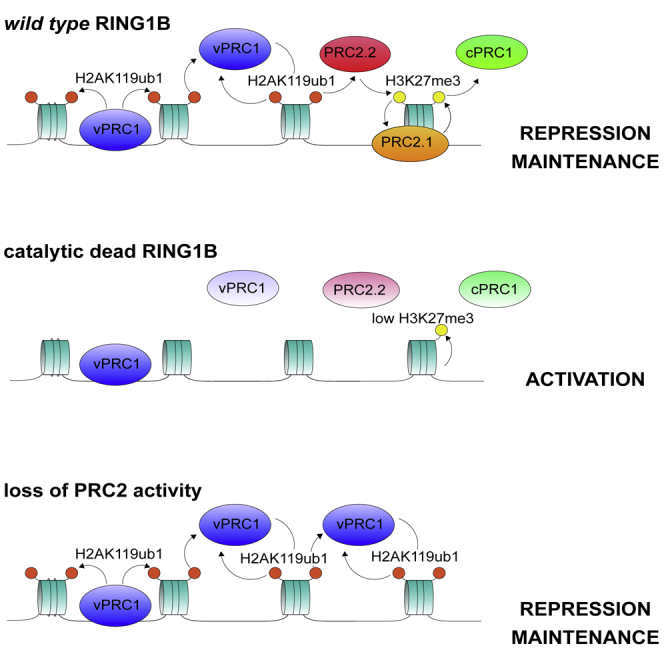
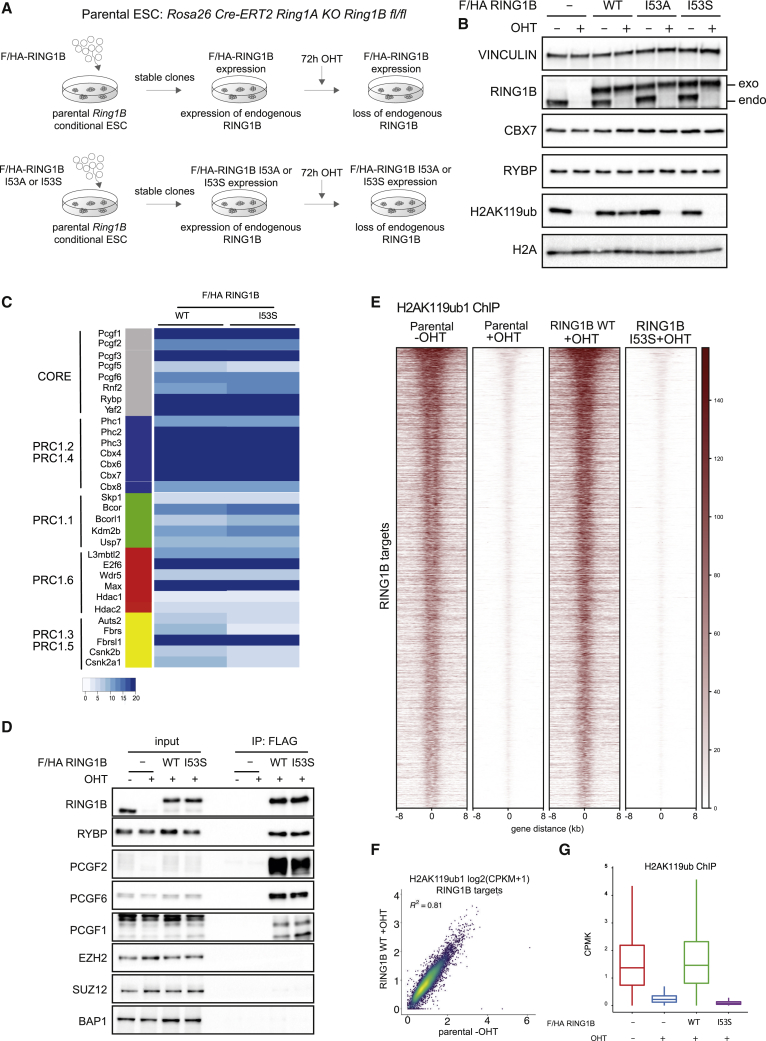
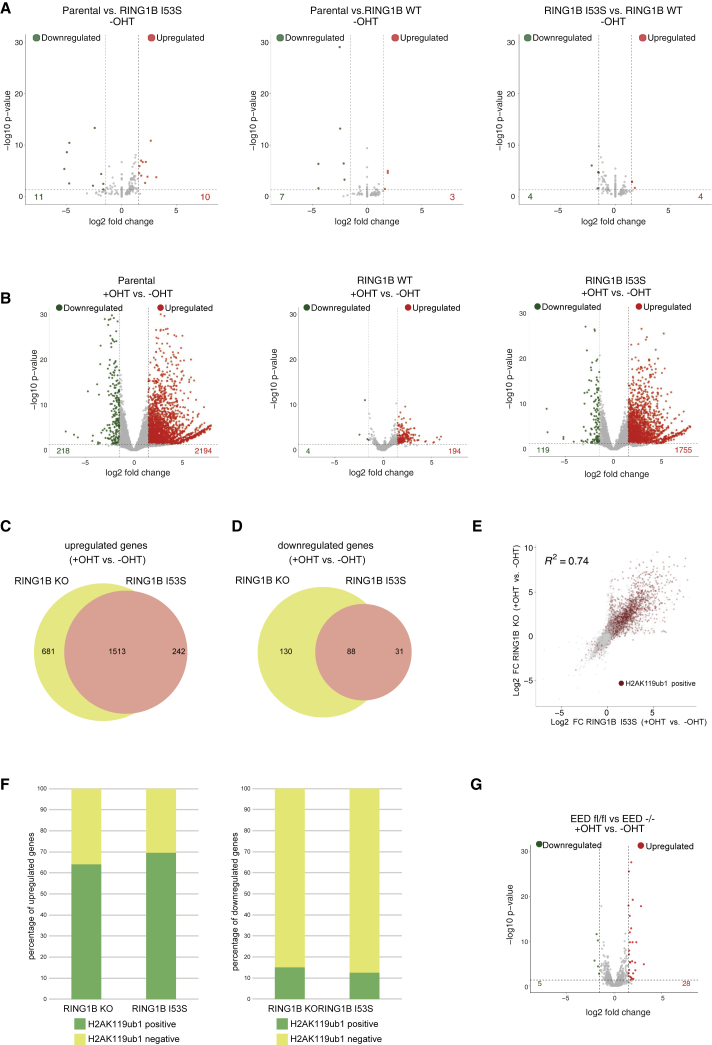
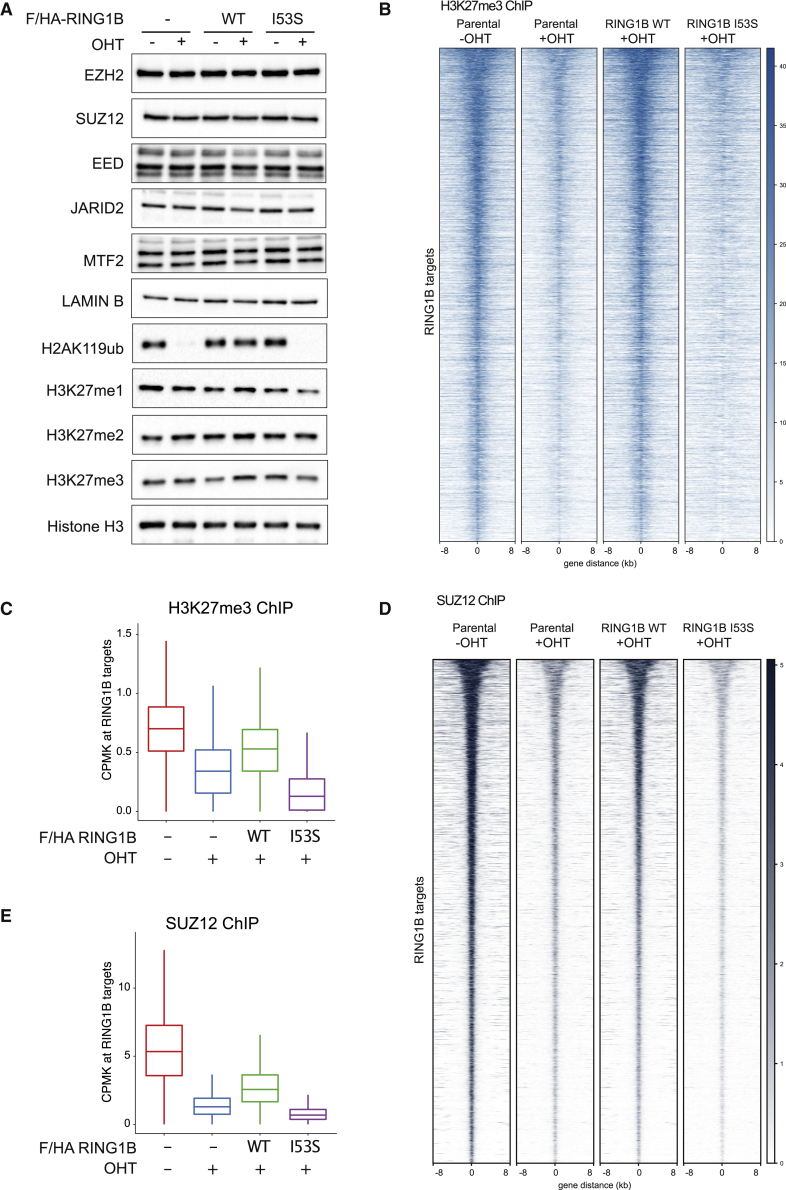
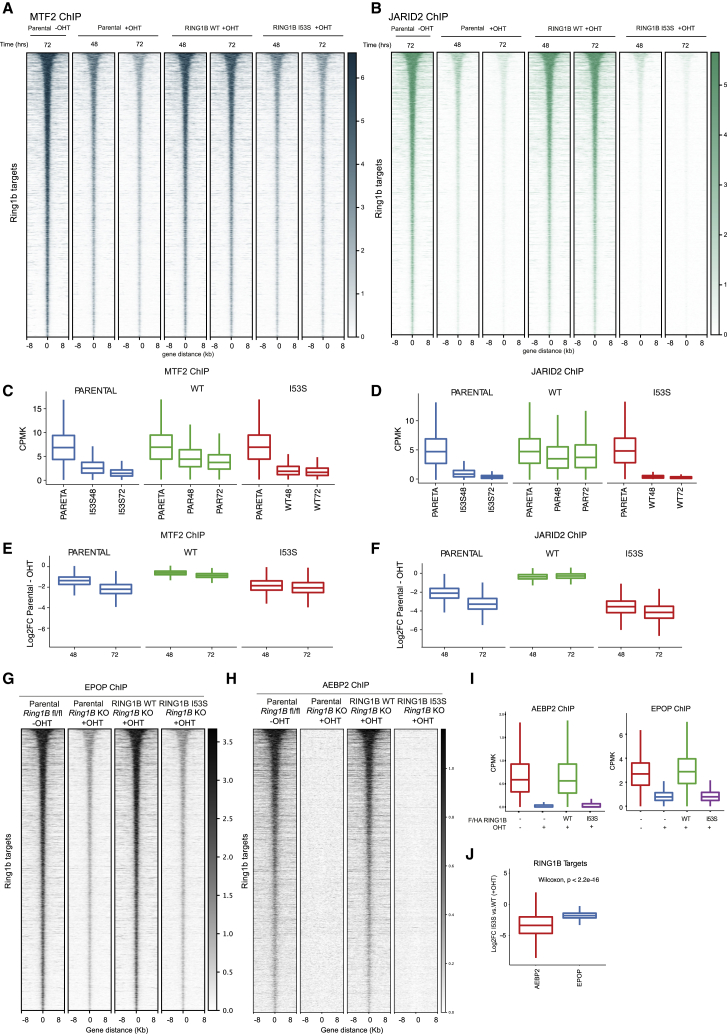
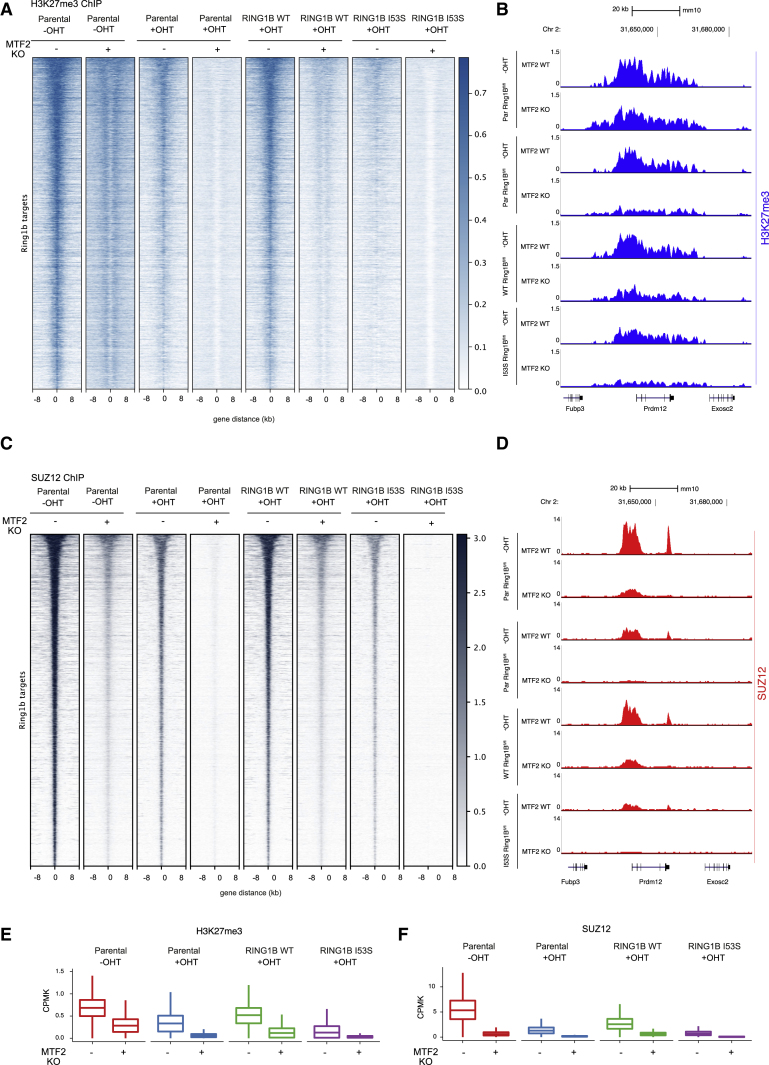
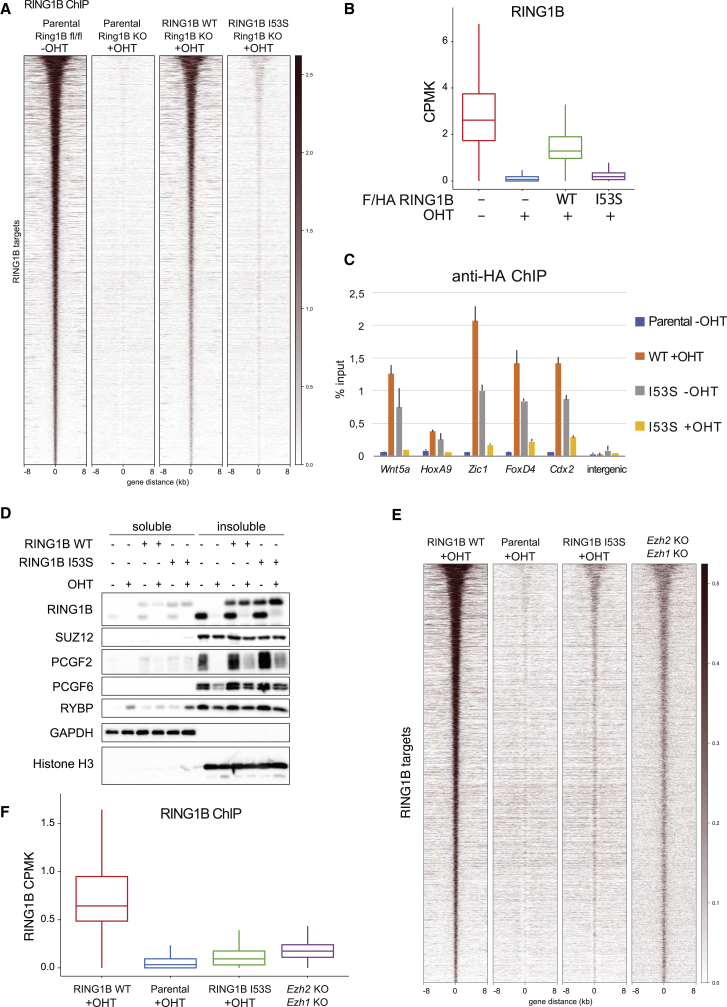
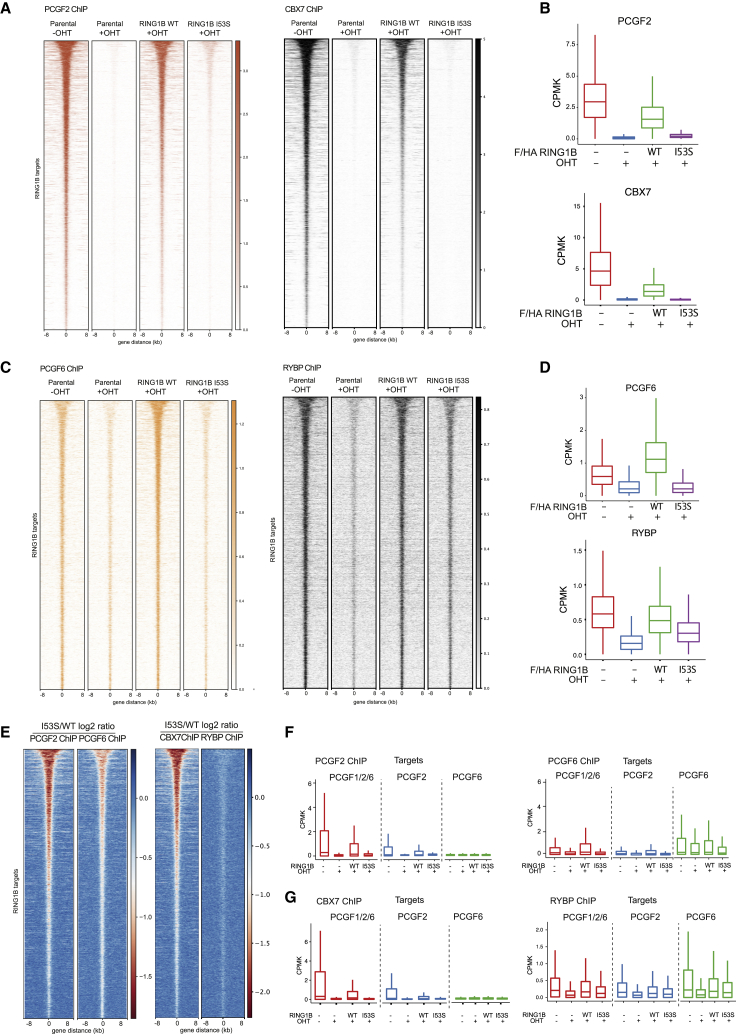
Polycomb group proteins (PcGs) maintain transcriptional repression to preserve cellular identity in two distinct repressive complexes, PRC1 and PRC2, that modify histones by depositing H2AK119ub1 and H3K27me3, respectively. PRC1 and PRC2 exist in different variants and show a complex regulatory cross-talk. However, the contribution that H2AK119ub1 plays in mediating PcG repressive functions remains largely controversial. Using a fully catalytic inactive RING1B mutant, we demonstrated that H2AK119ub1 deposition is essential to maintain PcG-target gene repression in embryonic stem cells (ESCs). Loss of H2AK119ub1 induced a rapid displacement of PRC2 activity and a loss of H3K27me3 deposition. This preferentially affected PRC2.2 variant with respect to PRC2.1, destabilizing canonical PRC1 activity. Finally, we found that variant PRC1 forms can sense H2AK119ub1 deposition, which contributes to their stabilization specifically at sites where this modification is highly enriched. Overall, our data place H2AK119ub1 deposition as a central hub that mounts PcG repressive machineries to preserve cell transcriptional identity.

Keywords: Chromatin modifications; H2AK119ub1; H3K27me3; JARID2; MTF2; PRC1; PRC2; Polycomb; RING1B; transcriptional repression.


Conflict of interest statement

Declarations of Interests The authors declare no competing interests.

Figures

None
Graphical abstract
Figure 1
Figure 1
RING1B I53S Is Fully Catalytically Dead In Vivo (A) Schematic representation of the strategy used for the generation of ROSA26::creERT2 RING1A−/−;RING1Bfl/fl conditional mESCs stably expressing FLAG-HA (F/HA)-tagged RING1B WT or I53A/S. (B) Western blot analysis with the indicated antibodies of total protein extracts obtained from the specified cell lines upon 72 h of treatment with OHT (+OHT) or EtOH (−OHT). Vinculin and histone H2A were used as loading controls. (C) Values of the LFQ ratios of the RING1B WT and I53S obtained by tandem mass spectrometry (MS/MS) analyses in the RING1B immuno-purifications (anti-FLAG) from ROSA26::creERT2 RING1A−/−;RING1Bfl/fl conditional mESCs stably expressing FLAG-HA (F/HA)-tagged RING1B WT or I53S upon 72 h of treatment with OHT (+OHT). (D) Co-immunoprecipitation analysis of nuclear extracts derived from FLAG-HA (F/HA)-tagged RING1B WT or I53S expressing cells upon 72 h of treatment with OHT (+OHT) or EtOH (−OHT) using M2 affinity gel beads. FLAG-IPs in parental cells served as a negative control. (E) Heatmaps representing normalized H2AK119ub1 ChIP-seq intensities ±8 kb around the center of RING1B target loci in the indicated cell lines. (F) Scatterplot showing the relationship between H2AK119ub1 CPMK levels (counts per million per kilobase) between parental EtOH treated (−OHT) and RING1B WT OHT-treated (+OHT) cells in RING1B target loci. R2 represents the coefficient of determination of linear regression. (G) Boxplots representing H2AK119ub1 ChIP-seq CPMK levels in the indicated cell lines at RING1B target loci. See also Figure S1A.
Figure 2
Figure 2
H2AK119ub1 Is Essential for PRCs-Mediated Transcriptional Repression (A) Volcano plots of –log10 (p value) against log2 fold change representing the differences in gene expression, related to RNA-seq analysis, in the indicated cell lines upon EtOH treatment (−OHT). Upregulated (red) and downregulated (green) genes are highlighted. (B) As in (A) upon OHT treatment (+OHT). (C) Venn diagrams showing the overlap of upregulated genes between the indicated cell lines. (D) As in (C) for downregulated genes. (E) Scatterplot showing the relationship between log2 fold changes (FC) between the indicated cell lines at RING1B target loci. R2 represents the coefficient of determination of linear regression. Genes with promoters (±2.5 kb around transcription start site [TSS]) containing H2AK119ub1 peaks are highlighted in red. (F) Barplots showing the percentage of upregulated (left) or downregulated (right) genes with promoters (±2.5 kb around TSS) containing H2AK119ub1 peaks in the indicated cell lines. (G) Volcano plots of –log10 (p value) against log2 fold change representing the differences in gene expression, related to RNA-seq analysis, in EEDfl/fl versus EED−/− ESCs. Upregulated (red) and downregulated (green) genes are highlighted. See also Figure S1B.
Figure 3
Figure 3
H2AK119ub1 Deposition Is Required for PRC2 Recruitment and Activity (A) Western blot analysis with the indicated antibodies of protein extracts obtained from the specified cell lines upon 72 h of treatment with OHT (+OHT) or EtOH (−OHT). LAMIN B and histone H3 were used as loading controls. (B) Heatmaps representing normalized H3K27me3 ChIP-seq intensities ±8 kb around the center of RING1B target loci in the indicated cell lines. (C) Boxplots representing H3K27me3 ChIP-seq CPMK levels in the indicated cell lines at RING1B target loci. (D) Heatmaps representing normalized SUZ12 ChIP-seq intensities ±8 kb around the center of RING1B target loci in the indicated cell lines. (E) Boxplots representing SUZ12 ChIP-seq CPMK levels in the indicated cell lines at RING1B target loci. See also Figure S1C.
Figure 4
Figure 4
H2AK119ub1 Loss Preferentially Abolishes PRC2.2 while Reducing PRC2.1 Chromatin Occupancy (A) Heatmaps representing normalized MTF2 ChIP-seq intensities ±8 kb around the center of RING1B target loci in the indicated cell lines at the indicated time point post OHT induction. (B) Heatmaps representing normalized JARID2 ChIP-seq intensities ±8 kb around the center of RING1B target loci in the indicated cell lines at the indicated time point post OHT induction. (C) Boxplot representing MTF2 ChIP-seq CPMK levels in the indicated cell lines at RING1B target loci at the indicated time point post OHT induction. (D) Boxplot representing JARID2 ChIP-seq CPMK levels in the indicated cell lines at RING1B target loci at the indicated time point post OHT induction. (E) Boxplot representing the log2 ratio of MTF2 CPMK levels at RING1B target loci between RING1B WT- and I53S-expressing cells at the indicated time point post OHT induction. (F) Boxplot representing the log2 ratio of JARID2 CPMK levels at RING1B target loci between RING1B WT- and I53S-expressing cells at the indicated time point post OHT induction. (G) Heatmaps representing normalized EPOP ChIP-seq intensities ±8 kb around the center of RING1B target loci in the indicated cell lines. (H) Heatmaps representing normalized AEBP2 ChIP-seq intensities ±8 kb around the center of RING1B target loci in the indicated cell lines. (I) Boxplot representing AEBP2 (left) or EPOP (right) ChIP-seq CPMK levels in the indicated cell lines at RING1B target loci. (J) Boxplot representing the log2 ratio of AEBP2 or EPOP CPMK levels at RING1B target loci between RING1B WT- and I53S-expressing cells. See also Figures S1D and S1E.
Figure 5
Figure 5
MTF2 Is Responsible for Residual PRC2 Binding upon H2AK119ub1 Loss (A) Heatmaps representing normalized H3K27me3 ChIP-seq intensities ±8 kb around the center of RING1B target loci in the indicated cell lines. (B) Representative genomic snapshots of H3K27me3 ChIP tracks at the PRDM12 gene locus. (C) Heatmaps representing normalized SUZ12 ChIP-seq intensities ±8 kb around the center of RING1B target loci in the indicated cell lines. (D) Representative genomic snapshots of SUZ12 ChIP tracks at the PRDM12 gene locus. (E) Boxplot representing H327me3 ChIP-seq CPMK levels in the indicated cell lines at RING1B target loci. (F) Boxplot representing SUZ12 ChIP-seq CPMK levels in the indicated cell lines at RING1B target loci. See also Figure S1F.
Figure 6
Figure 6
H2AK119ub1 Affects RIN1GB Chromatin Stability (A) Heatmaps representing normalized RING1B ChIP-seq intensities ±8 kb around the center of RING1B target loci in the indicated cell lines. (B) Boxplots representing RING1B ChIP-seq CPMK levels in the indicated cell lines at RING1B target loci. (C) ChIP-qPCR analysis of HA in the indicated cell lines at five specific polycomb targets and one intergenic region. Parental cells served as a negative control. (D) Western blot analysis with the indicated antibodies of soluble and insoluble protein fractions obtained from the specified cell lines upon 72 h of treatment with OHT (+OHT) or EtOH (−OHT). GAPDH and histone H3 were used as positive controls for the soluble and insoluble fractions, respectively. (E) Heatmaps representing normalized RING1B ChIP-seq intensities ±8 kb around the center of RING1B target loci in the indicated cell lines. (F) Boxplots representing RING1B ChIP-seq CPMK levels in the indicated cell lines at RING1B target loci.
Figure 7
Figure 7
RING1B Inactivation Preferentially Affects cPRC1 (A) Heatmaps representing normalized PCGF2 and CBX7 ChIP-seq intensities ±8 kb around the center of RING1B target loci in the indicated cell lines. (B) Boxplots representing PCGF2 ChIP-seq CPMK levels (top panel) and CBX7 (bottom panel) in the indicated cell lines at RING1B target loci. (C) Heatmaps representing normalized PCGF6 and RYBP ChIP-seq intensities ±8 kb around the center of RING1B target loci in the indicated cell lines. (D) Boxplots representing PCGF6 ChIP-seq CPMK levels (top panel) and RYBP (bottom panel) in the indicated cell lines at RING1B target loci. (E) Heatmap representing the log2 ratio of PCGF2 and PCGF6 (left) and CBX7 and RYBP (right) normalized ChIP-seq intensities at RING1B target loci between RING1B WT- and I53S-expressing cells. (F) Boxplots representing PCGF2 (upper panel) and PCGF6 (bottom panel) ChIP-seq CPMK levels ±250 bp around TSS of PCGF target genes in the indicated cell lines. (G) Boxplots representing CBX7 (left panel) and RYBP (right panel) ChIP-seq CPMK levels ±250 bp around TSS of PCGF target genes in the indicated cell lines. See also Figures S2A–S2C.

Comment in

References

    1. Anders S., Pyl P.T., Huber W. HTSeq--a Python framework to work with high-throughput sequencing data. Bioinformatics. 2015;31:166–169. - PMC - PubMed
    1. Ben-Saadon R., Zaaroor D., Ziv T., Ciechanover A. The polycomb protein Ring1B generates self atypical mixed ubiquitin chains required for its in vitro histone H2A ligase activity. Mol. Cell. 2006;24:701–711. - PubMed
    1. Beringer M., Pisano P., Di Carlo V., Blanco E., Chammas P., Vizán P., Gutiérrez A., Aranda S., Payer B., Wierer M., Di Croce L. EPOP Functionally Links Elongin and Polycomb in Pluripotent Stem Cells. Mol. Cell. 2016;64:645–658. - PubMed
    1. Bernstein E., Duncan E.M., Masui O., Gil J., Heard E., Allis C.D. Mouse polycomb proteins bind differentially to methylated histone H3 and RNA and are enriched in facultative heterochromatin. Mol. Cell. Biol. 2006;26:2560–2569. - PMC - PubMed
    1. Blackledge N.P., Farcas A.M., Kondo T., King H.W., McGouran J.F., Hanssen L.L., Ito S., Cooper S., Kondo K., Koseki Y. Variant PRC1 complex-dependent H2A ubiquitylation drives PRC2 recruitment and polycomb domain formation. Cell. 2014;157:1445–1459. - PMC - PubMed

Publication types

MeSH terms