. 2020 Jan 16;27(1):105-121.e14.
doi: 10.1016/j.chembiol.2019.12.005. Epub 2019 Dec 26.

RUVBL1/RUVBL2 ATPase Activity Drives PAQosome Maturation, DNA Replication and Radioresistance in Lung Cancer

Affiliations

RUVBL1/RUVBL2 ATPase Activity Drives PAQosome Maturation, DNA Replication and Radioresistance in Lung Cancer

Paul Yenerall et al. Cell Chem Biol. .

Abstract

RUVBL1 and RUVBL2 (collectively RUVBL1/2) are essential AAA+ ATPases that function as co-chaperones and have been implicated in cancer. Here we investigated the molecular and phenotypic role of RUVBL1/2 ATPase activity in non-small cell lung cancer (NSCLC). We find that RUVBL1/2 are overexpressed in NSCLC patient tumors, with high expression associated with poor survival. Utilizing a specific inhibitor of RUVBL1/2 ATPase activity, we show that RUVBL1/2 ATPase activity is necessary for the maturation or dissociation of the PAQosome, a large RUVBL1/2-dependent multiprotein complex. We also show that RUVBL1/2 have roles in DNA replication, as inhibition of its ATPase activity can cause S-phase arrest, which culminates in cancer cell death via replication catastrophe. While in vivo pharmacological inhibition of RUVBL1/2 results in modest antitumor activity, it synergizes with radiation in NSCLC, but not normal cells, an attractive property for future preclinical development.

Keywords: DNA replication; RUVBL1; RUVBL2; non-small cell lung cancer; radiation therapy.


Conflict of interest statement

DECLARATION OF INTERESTS

M.H., R.M., T.T., and K. I. are employees of Daiichi-Sankyo. Compound B and Compound C are patented under patent WO2015125785 by Daiichi-Sankyo. J.D.M. receives licensing royalties from the NCI and UT Southwestern for cell lines. All other authors report no conflicts of interest.

Figures

Figure 1.
Figure 1.. RUVBL1/2 ATPase Activity Is Required for NSCLC Viability
(A) Effect of RUVBL1/2 knockdown on the growth of NSCLC lines. Values for RNAI-RUVBL1 or RNAI-RUVBL2 represent the average relative number of cells remaining 5 days after knockdown of RUVBL1 or RUVBL2, respectively, between an siRNA and an esiRNA, in comparison with control oligonucleotides. Knockdowns performed with ≥2 biological replicates, and error bars represent the SD between siRNAs and esiRNAs (B) Expression of wild-type doxycycline-inducible siRNA-resistant RUVBL1/2 cDNA can rescue growth following 5 days of RUVBL1/2 knockdown (left) but ATPase-dead cannot (right) in NSCLC lines. Dox = 2 μg/mL doxycycline. Values are averages ±SD of ≥2 biological replicates.
Figure 2.
Figure 2.. Development and Validation of Compound B, an Orally Bioavailable RUVBL1/2 Inhibitor
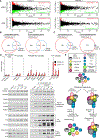
(A) Structure of compound B (active RUVBL1/2 inhibitor, top) and compound C (inactive control compound, bottom). (B) Immunobloting of PIKK family members following 3 days of 100 nM Compound B (abbreviated Comp. B) or Compound C (abbreviated Comp. C) and 4 days of siRNA-mediated RUVBL1 or RUVBL2 knockdown in H2009. (C–E) Orally delivered compound B inhibits RUVBL1/2 in tumors in vivo. (C and D) Immunoblot of tumor protein extracts from mice bearing H2009 (C) or H596 (D) xenografted subcutaneously into NOD/SCID mice and treated with vehicle or 175 mg/kg/day Compound B by oral gavage for 3 days. Each number is an independent mouse. (E) Part of the H2009 tumors from Figure 2C were analyzed for tumor-cell specific levels of ATM by IHC. Values are averages ±SD of the percent of ATM-positive tumor cells in 2 mice. Scale bars, 200 μm. (F) PCR-mutagenesis identifies amino acid substitutions in RUVBL1 or RUVBL2 that confer resistance to compound B. Lollipop diagrams generated using cBioPortal (https://www.cbioportal.org/mutation_mapper) and RUVBL1/2 domains were overlaid. Enrichment refers to the frequency a residue was mutated in cells surviving compound B relative to the parental population. Substitutions >10-fold enriched are shown. See also Table S1. (G) Compound B resistance-conferring mutations cluster at RUVBL1/2 interfaces. RUVBL1/RUVBL2 from Chaetomium thermophilum (PDB: 4WVY). Domains are depicted in cartoon and colored as in Figure 2F. ATP, black stick; resistance-conferring mutations, colored spheres. The RUVBL2/RUVBL1 interaction surface (RUVBL1, salmon) includes nine resistance-conferring mutations (red spheres), while RUVBL1/RUVBL2 interaction surface (RUVBL2, pink) includes three resistance-conferring mutations (red spheres). Remaining resistance-conferring mutations are white. (H) Superposition of the ATP/apo (PDB: 4WVY) and ADP/ADP (PDB: 4WW4) bound states of the RUVBL1/RUVBL2 interface highlights nucleotide-dependent switch loop conformations in RUVBL1 (magenta/pink thick loops for ATP/ADP states, respectively) and RUVBL2 (red/salmon thick loops for apo/ADP states, respectively) that span both interfaces. Compound B resistance mutations are spheres. (I) A flexible RUVBL2 N-terminal gatekeeper (yellow thick loop) from human RUVBL1/RUVBL2 bound to R2TP (PDB: 6QI8) is revealed by superposition of RUVBL1/RUVBL2 heterodimers from the nucleotide bound (ordered switch and gatekeeper loops) and apo (ordered elements in transparent surface with disordered loops) states. The ordered N terminus completes the RUVBL1/RUVBL2 interaction surface and compound B resistance mutations are spheres. (J) Identified mutations in RUVBL1 rescue the ability of compound B to inhibit RUVBL1/2 in vitro. Values are averages ±SD of three biological replicates. (K and L) Doxycycline-inducible expression of compound B resistance-conferring mutations in RUVBL1/2 confers resistance to compound B in viability-based assays. (K) RUVBL1 and (L) RUVBL2. See also Figures S2H and S2I for an additional cell line.
Figure 3.
Figure 3.. Molecular Consequences of Acute RUVBL1/2 ATPase Inhibition
(A) MA plots of RNA-seq data from H2009 and H596 (top and bottom panels, respectively) treated with compound B for 24 h (left two panels) or siRUVBL1 for 3 days (right two panels). Colored dots, differentially expressed (DE) genes (RPKM >1, p < 0.01, false discovery rate [FDR] < 0.05, and fold change >2). Upregulated DE genes, red; downregulated DE genes, green. Values are averages of two biological replicates. (B and C) Venn diagrams of DE genes (upregulated left, downregulated right) from (A) after compound B and siRUVBL1 treatment in (B) H2009 and (C) H596. Significance assessed by hypergeometric test. (D) Inhibition of RUVBL1/2 ATPase increases PAQosome association with RUVBL1/2. Top: RUVBL1-V5 was immunoprecipitated from H2009 cells after 12 h of 100 nM of compound C or compound B treatment, and coimmunoprecipitated proteins were quantified by mass spectrometry. Values represent average relative abundance between compound B and compound C treatment ±SD of three biological replicates. Bottom: validation by independent immunoprecipitation-immunoblotting. See also Table S3. (E) Proposed model of how RUVBL1/2 ATPase activity affects maturation and/or disassembly of the PAQosome complex.
Figure 4.
Figure 4.. RUVBL1/2 Have Roles in DNA Replication
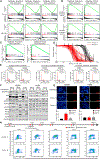
(A) GSEA of RNA-seq data following compound B treatment (top) or RUVBL1 knockdown (bottom) in H2009. NES, normalized enrichment score; FDR, false discovery rate. (B) RUVBL1/2 are coexpressed with DNA replication genes in NSCLC patient tumors. GSEA of the Pearson correlation between RUVBL1 (top) or RUVBL2 (bottom) expression and the expression of every gene in the TCGA NSCLC RNA-seq dataset. (C) Sensitivity to knockdown of RUVBL1/2 correlates with sensitivity to knockdown of DNA replication factors. GSEA of the Pearson correlation between the average RSA score of RUVBL1 and RUVBL2 and the RSA score of 7,726 genes in 63 lung cancer cell lines from Project DRIVE. (D) Fitted viability-based dose-response curves for cancer cell lines treated with compound B (67 cell lines) or compound C (32 cell lines) for 4 days. All data represent the average ±SD and most assays have ≥2 biological replicates. See Table S4 for more information. (E) NSCLC lines that are more sensitive to compound B tend to arrest in S phase. Cell-cycle analysis by DNA content following 48 h of exposure to 100 nM compound B. Representative of at least two biological replicates. See Figure S4B for additional NSCLC lines. (F) Time course of the effects of 100 nM compound B on various proteins by immunoblot in H2009 (left) and H596 (right). See Figure S4G for immunoblot of same proteins following RUVBL1/2 knockdown. (G) Top: representative images from immunofluorescent microscopy of H2009 (left) and H596 (right) after 100 nM compound B or compound C for 48 h. DAPI, blue; γH2AX, red. Bottom: quantification of pan-γH2AX-positive cells, defined as nuclei covered in γH2AX staining. Values represent averages ±SD from three biological replicates. Scale bars, 20 μm. See also Figure S4F for γH2AX and 53BP1 foci data. (H) Compound B slows progression through S phase. Top: schematic of experiment outline. Bottom: flow cytometric analysis of BrdU incorporation and DNA content (PI, propidium iodide) in H2009 cells following release into S phase from a double thymidine block. Representative of three biological replicates. See Figure S5A for analysis of BrdU only.
Figure 5.
Figure 5.. RUVBL1/2 Inhibition Decreases the Number of Active Replication Forks and Causes Replication Catastrophe
(A) Compound B treatment lowers, then increases, the amount of ssDNA. H2009 cells were analyzed for ssDNA and total DNA (PI) by flow cytometry after 100 nM of compound B or compound C treatment for indicated times. Top graphs: numbers in upper gate represent the percentage of cells with high levels of ssDNA and bottom gates capture cells in S/G2/M. Bottom graphs: amount of ssDNA in cells in S/G2/M phase (from top graph). MFI, median fluorescent intensity; HU + ATRi, 2 mM hydroxyurea (HU) for 4 h followed by 500 nM VE-822 (ATR inhibitor) for 2 h. Numbers are average ±SD of three biological replicates. (B) RPA loading onto chromatin parallels ssDNA. H2009 cells were pre-extracted and analyzed for chromatin-bound RPA2 and DNA content (PI) by flow cytometry after 100 nM compound B or compound C treatment for indicated times. Top graphs: numbers in upper gate represent the percentage of cells with hyperloaded RPA and bottom gates capture cells in S/G2/M. Bottom graphs: amount of chromatin-bound RPA2 in cells in S/G2/M phase (from top graph). Hydroxyurea, 2 mM for 2 h. Numbers are average ±SD of three biological replicates. (C) Complete loss of ATR causes replication catastrophe after RUVBL1/2 inhibition. H2009 cells were pre-extracted and analyzed for chromatin-bound RPA2 and DNA content (PI) by flow cytometry after being treated with 100 nM compound B or compound C ± 80 nM VE-822. Numbers are average ±SD of three biological replicates. See Figure S5B for the same experiment with a CHEK1 inhibitor. (D) Compound B treatment increases the speed of individual replication forks. H2009 cells were treated with 100 nM compound C or compound B, labeled with IdU and CldU, and the length of IdU and CldU tracks were measured. Only the total length of dual IdU/CldU-positive tracks were measured. Data from two biological replicates in which >100 tracks were quantified for each condition. Statistical significance from one-way ANOVA with a post-hoc Sidak’s multiple comparisons test. (E) The abundance of core replication factors at replisomes does not change after compound B treatment. H2009 was treated with 100 nM compound C or compound B for 12 h, active replisomes were purified by iPOND, and eluted proteins were analyzed by mass spectrometry. Values are averages ± SEM from three biological replicates. See also Table S5 for the complete list of identified proteins. (F) POLE abundance increases, whereas histone abundance decreases, at active replisomes after compound B treatment. Data are from same experiment as in. (E). Values are averages ± SEM from three biological replicates. See also Table S5. (G) iPOND immunoblot confirms that compound B increases the abundance of POLE2 but decreases the abundance of histones at active replisomes. No click samples lack the biotin conjugation step. Chase samples contain only chromatin-bound proteins. Asterisk, nonspecific protein; arrow, specific protein.
Figure 6.
Figure 6.. Inhibition of RUVBL1/2 Therapeutically Synergizes with Ionizing Radiation
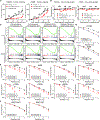
(A) Orally delivered compound B can inhibit NSCLC tumor growth in vivo. NSCLC lines that were relatively sensitive (H2009, left) or relatively resistant (H596, right) in vitro to compound B were implanted subcutaneously into NOD/SCID mice and randomized to receive 175 mg/kg/day compound B or vehicle once tumor volumes reached ~150 mm3. Arrows, treatment days; values are averages ± SEM. Statistical significance assessed with two-way repeated measures ANOVA. n represents the number of mice. See Figure S6B for tumor pictures, weights, and H&Es. (B) Body weight of NOD/SCID mice from (A). Values are averages ± SEM. See Figure S6C for histology of mice organs. (C) GSEA analysis of the RNA-seq data following compound B (top) or siRUVBL1 (bottom) treatment in H2009 (from Figure 4A) shows downregulation of gene sets important to the response to IR. (D) Doxycycline-inducible shRNAs against RUVBL1 or RUVBL2 radiosensitize NSCLC. Cells were treated for 3 days with 62.5 ng/mL doxycycline, plated as single cells, irradiated at various doses, and left in the presence of doxycycline until colonies were formed, stained, and counted. Values are average ± SD of two biological replicates. (E) Compound B radiosensitizes NSCLC. Cells were treated for 3 days with compound B or compound C, plated as single cells, irradiated at various doses, and left in the presence of drug until colonies were formed, stained, and counted. Values are average ± SD of two biological replicates. (F) Compound B does not radiosensitize normal human bronchial epithelial cells (HBECs). Assay performed as in (E).
Figure 7.
Figure 7.. RUVBL1/2 Inhibition Impedes DNA Repair In Vitro and In Vivo, Potentially by Destabilizing ATM Preferentially in Tumor Cells
(A) Compound B treatment blunts activation of ATM and DNA-PKCS following IR In H2009. Cells were treated for 3 days with 12.5 nM compound B or compound C, Irradiated with 10 Gy, and harvested at indicated times post-radiation for immunoblot. (B) Compound B treatment does not affect ATM or DNA-PKCS activation following IR in HBEC3KT, a normal lung epithelial cell line. Cells were treated as in (A). (C) PIKK-family proteins are destabilized at lower concentrations of compound B in H2009 than HBEC3KT. Cells were treated for 3 days with the indicated concentrations. (D and E) Inhibition of RUVBL1/2 delays DSB resolution in NSCLC but not in HBECs. Cell lines were treated with drug for 3 days, irradiated with 2 Gy, grown in the presence of drug until indicated time points, then fixed and prepared for immunofluorescent microscopy. (D) Representative images before or after 2 Gy radiation in H2009 and HBEC3KT treated with 25 nM compound B or 50 nM compound C. Blue, DNA; green, 53BP1; red, γH2AX. Scale bars, 20 μm. (E) Left: quantification of the percentage of remaining μH2AX foci after 2 Gy radiation. Right: percentage of remaining 53BP1 foci after 2 Gy radiation. Values normalized to the number of foci 15 min after 2 Gy radiation and are average ±SD of two biological replicates. (F) Inhibition of RUVBL1/2 potentiates radiation in vivo without toxicity. Top: experiment outline. Bottom: H1299 was xenografted subcutaneously into female Nude mice and once tumor volumes reached ~150 mm3 mice were randomized to receive indicated treatments. Bottom left: tumor volumes. Statistical significance between vehicle and compound B, and between vehicle + IR and compound B + IR assessed using two-way repeated measures ANOVA. Bottom right: body weight of mice. Values are average ± SEM, and n indicates the number of mice. (G) NSCLC patient-derived explants (PDExs) are radiosensitized by compound B. Left: experiment outline. NSCLC patient tumors were diced into small pieces, grown on a gelatin sponge, treated for 3 days with 150 nM compound C or compound B, irradiated with 2 Gy, and after 8 h prepared for IHC. Middle: representative γH2AX staining. Blue, DAPI; red, γH2AX. Scale bars, 20 μm. Right: quantification of γH2AX staining in tumor cells from five patient explants. Mean fluorescent intensity in samples that received radiation was normalized to their respective drug treated, no radiation control sample, and lines connect samples from the same patient.

References

    1. Assimon VA, Tang Y, Vargas JD, Lee GJ, Wu ZY, Lou K, Yao B, Menon MK, Pios A, Perez KC, et al. (2019). CB-6644 is a selective inhibitor of the RUVBL1/2 complex with anticancer activity. ACS Chem. Biol. 14, 236–244. - PubMed
    1. Bizarro J, Dodre M, Huttin A, Charpentier B, Schlotter F, Branlant C, Verheggen C, Massenet S, and Bertrand E (2015). NUFIP and the HSP90/R2TP chaperone bind the SMN complex and facilitate assembly of U4-specific proteins. Nucleic Acids Res. 43, 8973–8989. - PMC - PubMed
    1. Breig O, Bras S, Martinez Soria N, Osman D, Heidenreich O, Haenlin M, and Waltzer L (2014). Pontin is a critical regulator for AML1-ETO-induced leukemia. Leukemia 28, 1271–1279. - PubMed
    1. Centenera MM, Raj GV, Knudsen KE, Tilley WD, and Butler LM (2013). Ex vivo culture of human prostate tissue and drug development. Nat. Rev. Urol. 10, 483–487. - PubMed
    1. Chaudhry MA (2007). Base excision repair of ionizing radiation-induced DNA damage in G1 and G2 cell cycle phases. Cancer Cell Int. 7, 15. - PMC - PubMed

Publication types

MeSH terms