. 2020 Jan 13;37(1):37-54.e9.
doi: 10.1016/j.ccell.2019.11.003. Epub 2019 Dec 26.

CDK7 Inhibition Potentiates Genome Instability Triggering Anti-tumor Immunity in Small Cell Lung Cancer

Affiliations

CDK7 Inhibition Potentiates Genome Instability Triggering Anti-tumor Immunity in Small Cell Lung Cancer

Hua Zhang et al. Cancer Cell. .

Abstract

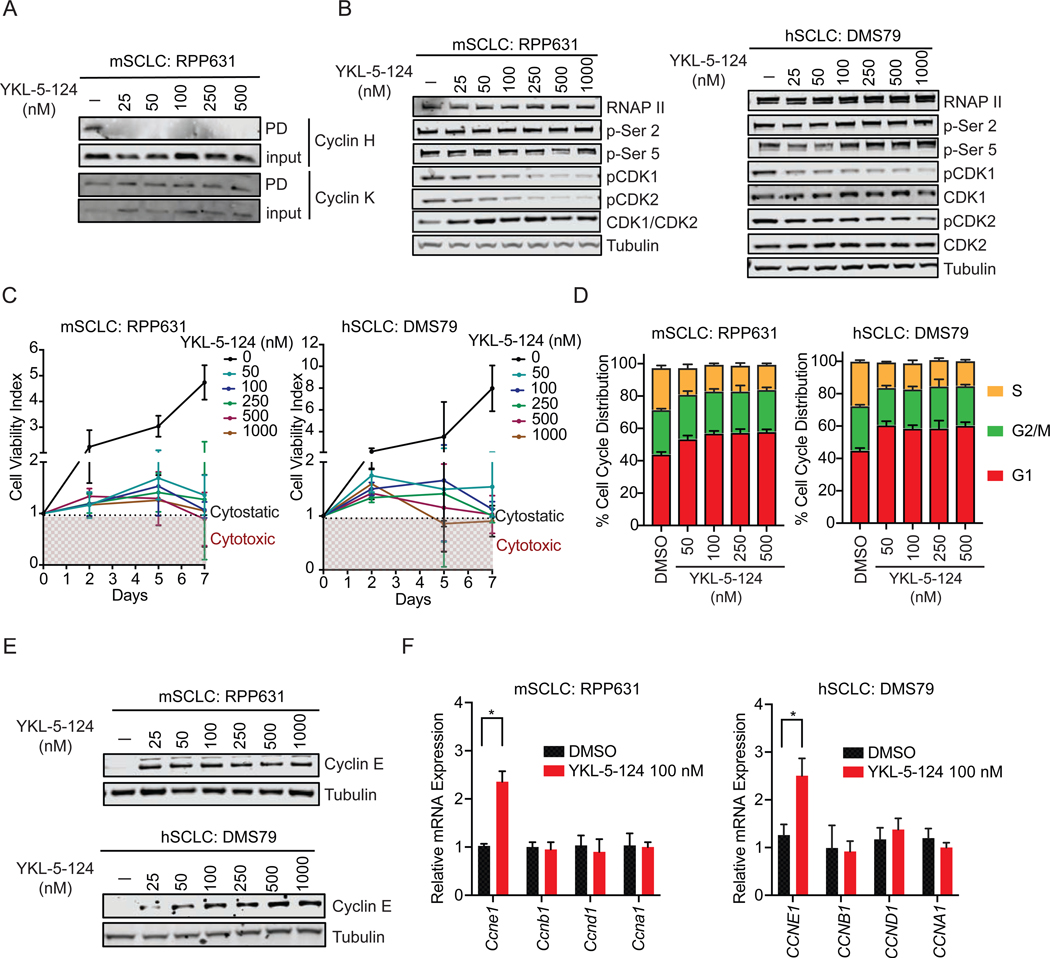
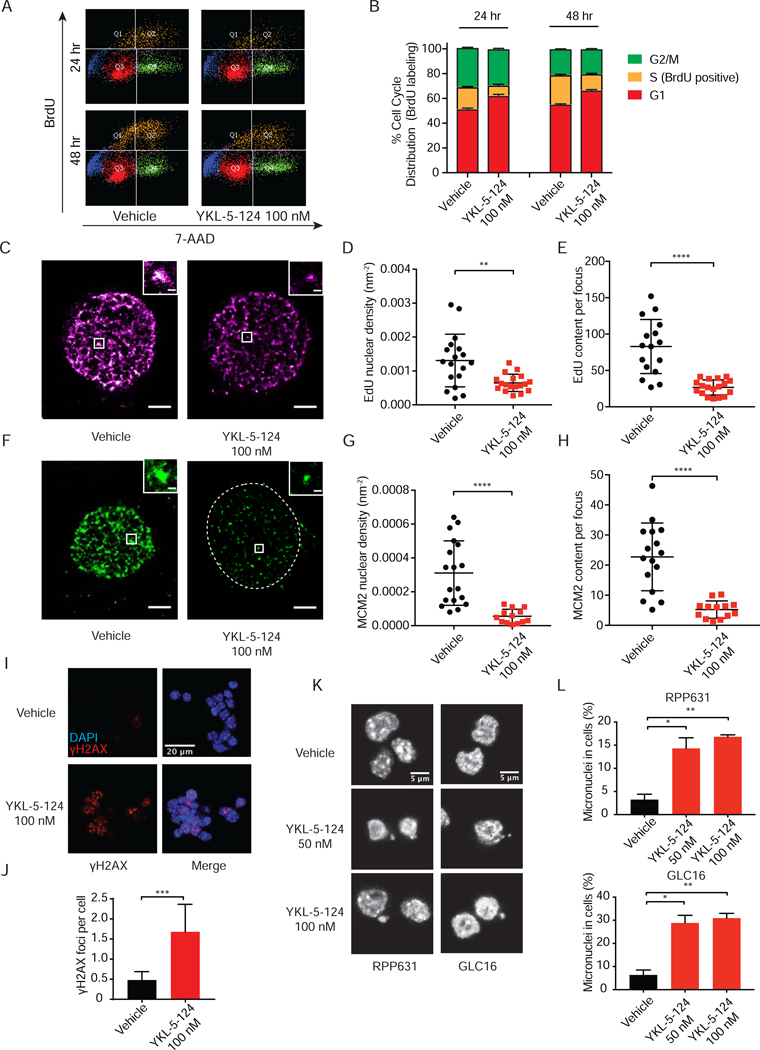
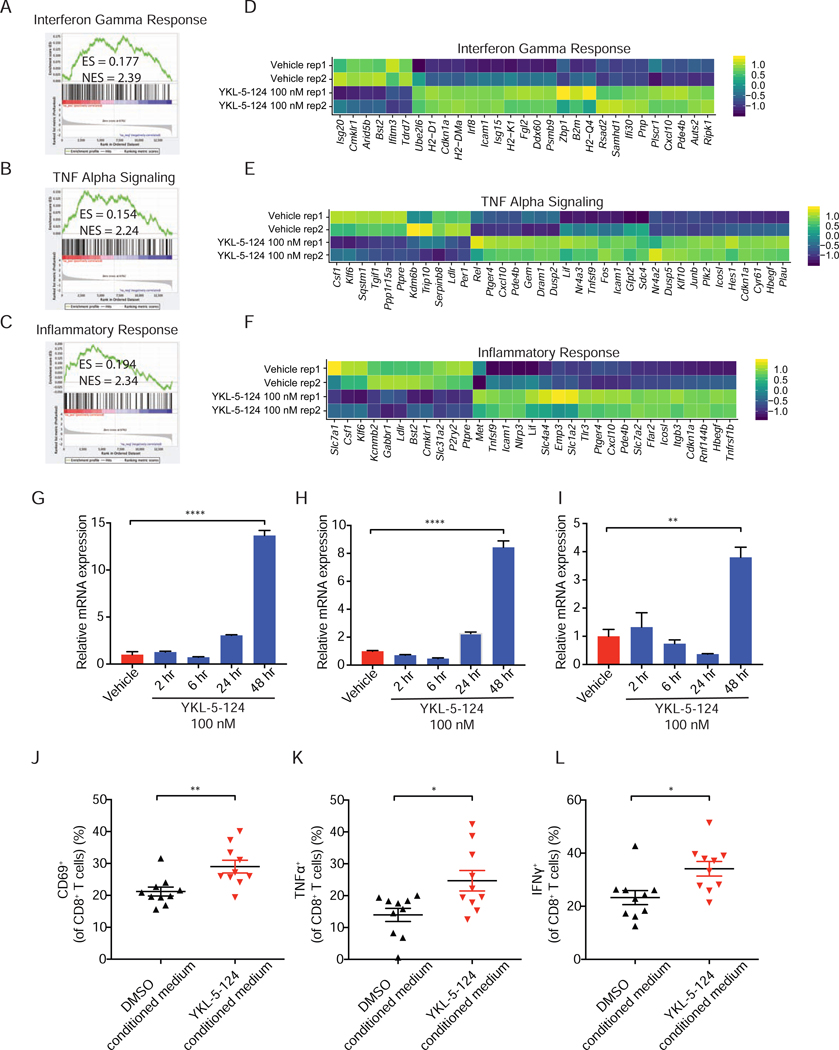
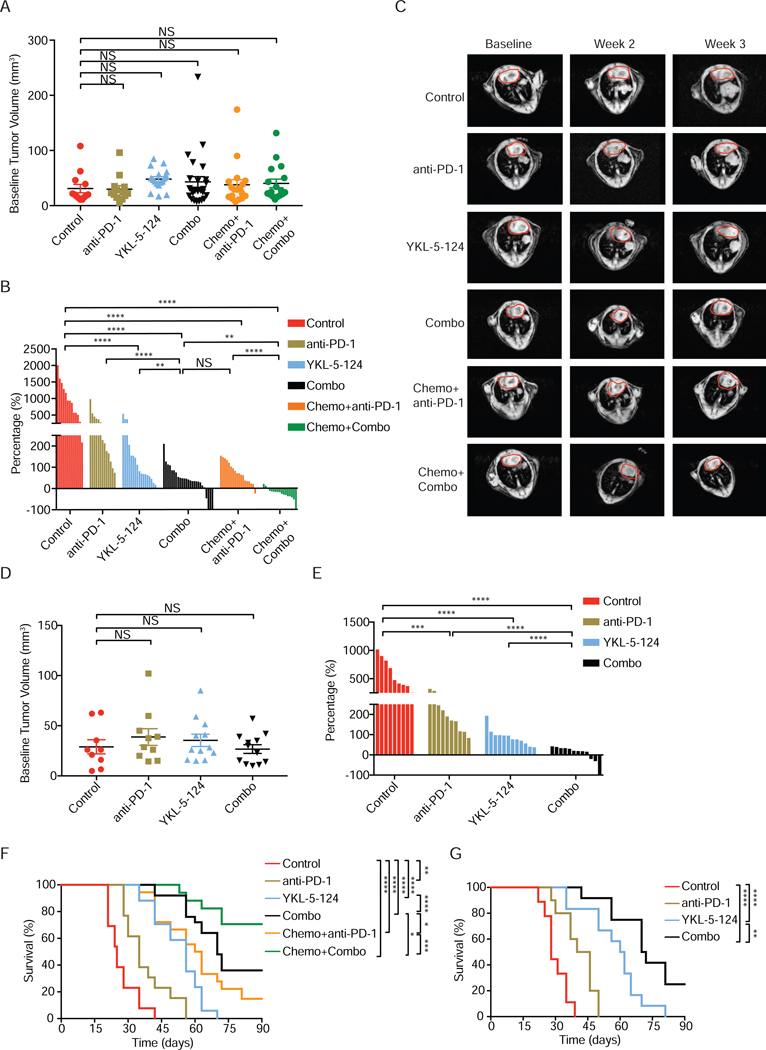
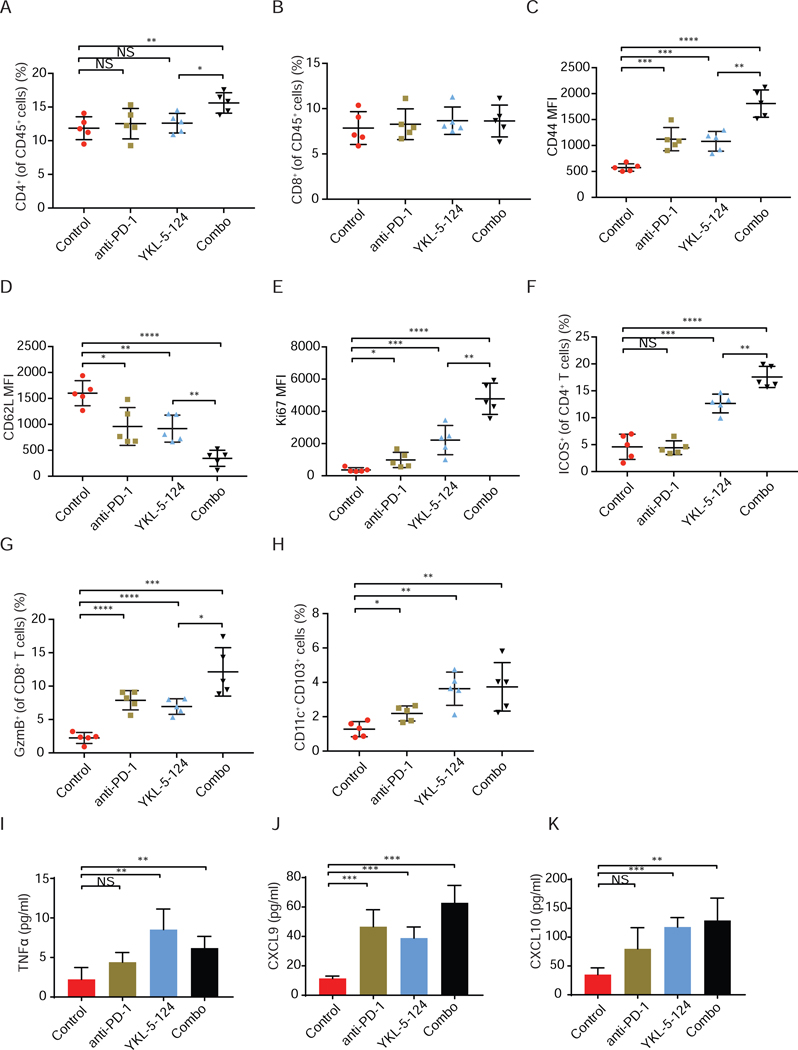
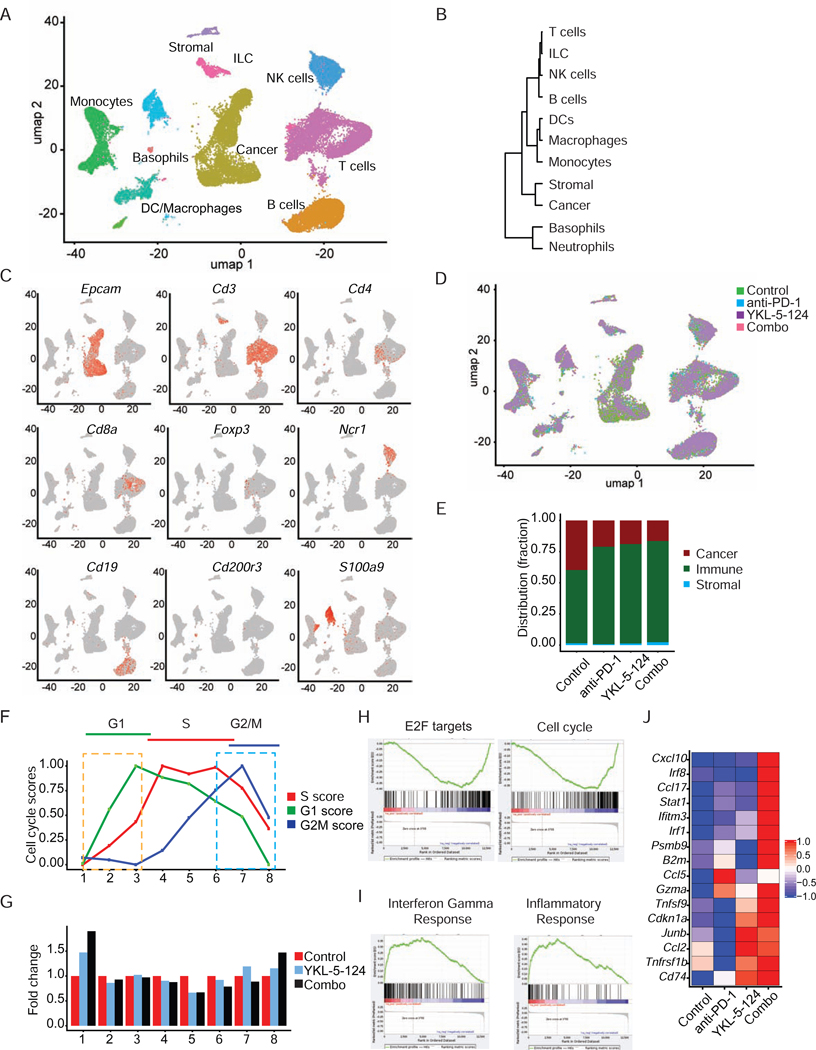
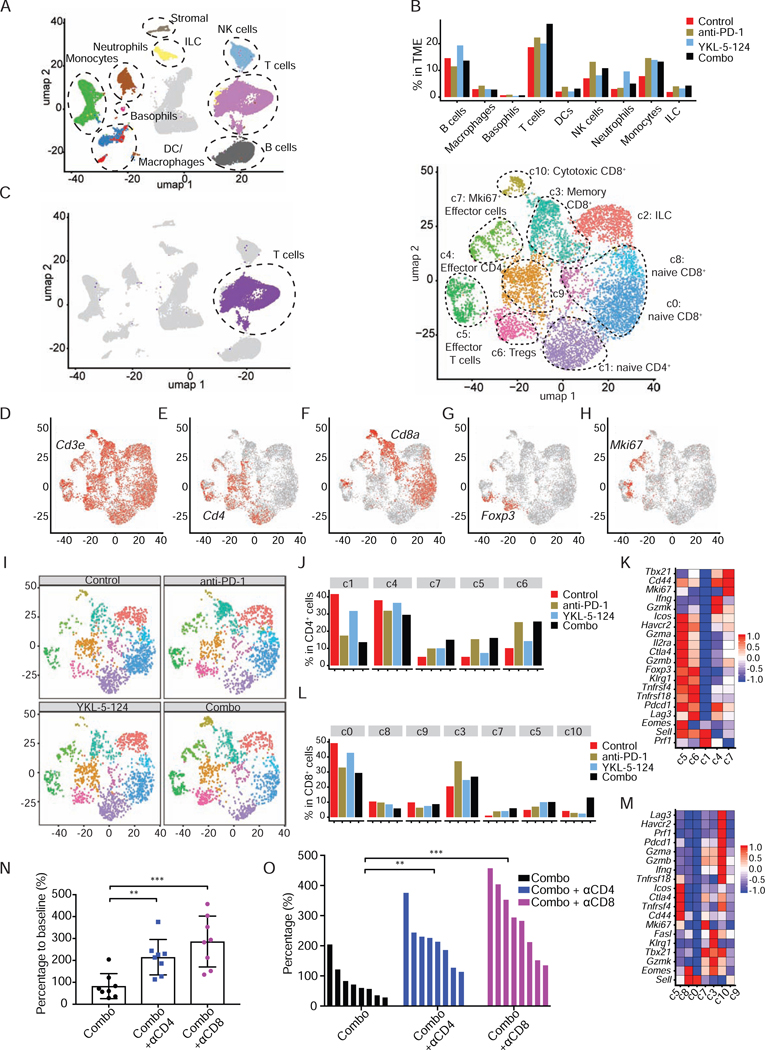
Cyclin-dependent kinase 7 (CDK7) is a central regulator of the cell cycle and gene transcription. However, little is known about its impact on genomic instability and cancer immunity. Using a selective CDK7 inhibitor, YKL-5-124, we demonstrated that CDK7 inhibition predominately disrupts cell-cycle progression and induces DNA replication stress and genome instability in small cell lung cancer (SCLC) while simultaneously triggering immune-response signaling. These tumor-intrinsic events provoke a robust immune surveillance program elicited by T cells, which is further enhanced by the addition of immune-checkpoint blockade. Combining YKL-5-124 with anti-PD-1 offers significant survival benefit in multiple highly aggressive murine models of SCLC, providing a rationale for new combination regimens consisting of CDK7 inhibitors and immunotherapies.

Keywords: CDK7; YKL-5-124; anti-tumor immunity; cell cycle; genome instability; immune checkpoint blockade; immunotherapy; replication stress; single-cell analysis; small cell lung cancer.


Figures

Figure 1.
Figure 1.. YKL-5–124 specifically targets CDK7 and disrupts cell cycle progression through inhibition of CDK7 CAK activity
(A) Competitive pulldown assay in mouse SCLC (mSCLC) RPP631 cells treated with YKL-5–124 at indicated concentrations for 6 hr. Western blotting showing the pulldown (PD) or input of Cyclin H and Cyclin K. (B) Western blotting of RNA Pol II total (RNAP II), RNA Pol II p-Ser 2 and 5, CDK1, CDK2, pCDK1 (Thr161), pCDK2 (Thr160), Tubulin in RPP631 and human SCLC (hSCLC) DMS79 cells after treatment with YKL-5–124 at indicated concentrations for 24 hr. (C) Cell viability was measured at indicated time points (normalized to day 0) upon treatment with DMSO or increasing concentrations of YKL-5–124 in RPP631 and DMS79. (D) Bar graph showing the cell distribution in G1, S and G2/M phase quantified by flow cytometry analysis of Propidium Iodide (PI)-staining in RPP631 and DMS79 after YKL-5–124 treatment for 72 hr. (E) Western blotting analysis of Cyclin E and Tubulin levels in RPP631 and DMS79 after treatment with YKL-5–124 at indicated concentrations for 24 hr. (F) RT-qPCR analysis of CCNE1, CCNB1, CCND1 and CCNA1 gene expression in RPP631 and DMS79 after treatment for 24 hr. The data were presented as fold changes compared to the vehicle (DMSO). (C, D, F) Data shown as means ± SD of three independent experiments run in triplicates. (F) Unpaired two-tailed t-test. *p < 0.05. See also Figure S1.
Figure 2.
Figure 2.. CDK7 inhibition impairs DNA synthesis and MCM2 complex and causes DNA damage and micronuclei formation
(A) Flow cytometry analysis of BrdU and 7-AAD co-staining in DMS79 after 24 and 48 hr treatment with DMSO or 100 nM YKL-5–124. (B) Bar graph showing the cell distribution in G1, S and G2/M phase. (C-E) Quantification of DNA synthesis indicated by EdU incorporation per nucleus as well as within each replication focus using STORM imaging of fluorescently labeled EdU in RPP631 cells treated with vehicle or 100 nM YKL-5–124 after 72 hr. (C) Representative images of nuclei with EdU signal are shown in vehicle or YKL-5–124. Scale bar = 2,000 nm. (D) Quantifications of EdU nuclear density (nm−2) per nucleus and (E) EdU content per focus are plotted. (F-H) Quantification of MCM2 complex per nucleus as well as within each replication focus in RPP631 cells. (F) Representative images of nuclei with MCM2 content are shown. Scale bar = 2,000 nm. Dash-line circle indicates nuclei. (G) Quantification of MCM2 nuclear density (nm−2) per nucleus and (H) MCM2 content per focus are plotted. (I and J) Quantification of γH2AX foci upon YKL-5–124 exposure by immunofluorescence (IF) microscopy in RPP631. (I) Representative images of DAPI-stained nuclei in blue and γH2AX foci in red. (J) The percentages of γH2AX foci in cells are plotted. At least 10 field images were counted (≥ 100 cell). (K and L) Quantification of micronuclei upon YKL-5–124 exposure in RPP631 and GLC16 by IF. (K) Representative images of DAPI-stained nuclei. (L) The percentages of micronuclei in cells are plotted. At least 10 field images were counted (≥ 100 cell). (B, D, E, G, H, J, L) Data shown as means ± SD of two to three independent experiments run in triplicates. (D, E, G, H, J, L) Unpaired two-tailed t-test. *p < 0.05, **p < 0.01, ***p < 0.001, ****p < 0.0001. See also Figure S1.
Figure 3.
Figure 3.. YKL-5–124 triggers immune response signaling and induces pro-inflammatory cytokines and chemokines production
(A-C) GSEA analysis of the differentially expressed genes induced by YKL-5–124 in RPP631. Here shown are three of the top five most positively regulated ‘Hallmarks’ signatures (A) Interferon Gamma Response, (B) TNF Alpha Signaling and (C) Inflammatory Response. Gene list was ranked with signed (from log2 fold change (FC)) likelihood ratio from YKL-5–124 versus vehicle comparison. (D-F) Heatmaps for differential expression of transcripts from three top positively regulated pathways (colors are log2FC). (G-I) RT-qPCR analysis of (G) Tnf, (H) Cxcl10 and (I) Cxcl9 levels in RPP631. The data were presented as fold changes compared to the vehicle. Data shown as means ± SD of three independent experiments run in triplicates. Unpaired two-tailed t-test. **p < 0.01, ****p < 0.0001. (J-L) Profiling of OT-I T cells activation markers (J) CD69, (K) TNFα and (L) IFN© by flow cytometry after treatment with DMSO- or YKL-5–124-conditioned medium. Data shown as means ± SEM of three independent experiments run in ten replicates. Unpaired two-tailed t-test. *p < 0.05, **p < 0.01. See also Figure S2
Figure 4.
Figure 4.. YKL-5–124 inhibits SCLC tumor growth in vivo and enhances tumor response to anti-PD-1 immunotherapy
(A) Quantification of baseline tumor volumes of RPP orthotopic model. Combined vehicle and isotype IgG (Control, n= 13), anti-PD-1 (n= 13), YKL-5–124 (n= 17), anti-PD-1 + YKL-5–124 (Combo, n= 25), Chemotherapy + anti-PD-1 (n= 18) and Chemotherapy + Combo (n= 17). Each dot represents one mouse. (B) Quantification of tumor volume changes of RPP orthotopic model after treatment. Waterfall plot shows tumor volumes response after week 3. Each column represents one mouse, comparing to baseline MRI measurement. (C) Representative MRI images show lung tumors of RPP orthotopic model before and after the treatment at indicated time points. Circled areas, heart. (D) Quantification of baseline tumor volumes of RP orthotopic model. Control (n= 9), anti-PD-1 (n= 10), YKL-5–124 (n= 12) and Combo (n= 12). Each dot represents one mouse. (E) Quantification of tumor volume changes of RP orthotopic model after treatment. Waterfall plot shows tumor volumes response after week 2. Each column represents one mouse, comparing to baseline MRI measurement. (F and G) Kaplan-Meier survival curve of (F) RPP or (G) RP orthotopic model after indicated treatment. Log-rank test. *p < 0.05, **p < 0.01, ***p < 0.001, ****p < 0.0001. (A, D) Data shown as means ± SEM. (A, B, D, E) Unpaired two-tailed t-test. **p < 0.01, ***p < 0.001, ****p < 0.0001. NS, not significant. See also Figures S3-S6.
Figure 5.
Figure 5.. YKL-5–124 provokes a robust anti-tumor immune program, which is further enhanced by anti-PD-1 immunotherapy
(A and B) Tumor infiltrating lymphocytes from RPP orthotopic model were analyzed at day 7 after treatment (n = 5). Frequencies of infiltrating (A) CD4+ T cells and (B) CD8+ T cells were presented. (C-F) The expression of (C) CD44, (D) CD62L and (E) Ki67 in CD4+ T cells, and (F) frequencies of ICOS+ CD4+ T cells were analyzed (n = 5). (G) Frequencies of GzmB+ CD8+ T cells was analyzed (n = 5). (H) Frequencies of CD11c+CD103+ dendritic cells were analyzed (n = 5). (I-K) Bronchoalveolar lavage fluid (BALF) was collected from mouse lung and secretion of (I) TNFα, (J) CXCL9 and (K) CXCL10 was measured by Luminex (pg/ml) (n = 4). Data shown as means ± SD. Unpaired two-tailed t-test. *p < 0.05, **p< 0.01, ***p < 0.001, ****p < 0.0001. NS, not significant. See also Figure S6.
Figure 6.
Figure 6.. Single-cell analysis identifies intratumoral cell populations and confirms connection of CDK7 inhibition in tumor intrinsic signaling to immunity
(A) umap plot showing identified cell populations within whole tumor from all groups merged. (B) Cluster dendrogram showing the lineage hierarchy of identified cell populations in (A). (C) umap plot of cancer and infiltrating cells displaying marker gene expression. (D) umap plot showing the cell distribution within identified cell populations upon treatment. (E) Distribution fraction of cancer, immune and stromal compartments in response to indicated treatment. (F) Inferred dynamic phases of cell-cycle progression from scRNAseq analysis. (G) Bar plot showing cellular distribution within the cell-cycle progression states indicated in (F). (H and I) GSEA analysis of the differentially expressed genes induced by YKL-5–124 in vivo. Here shown are two of the top most (H) negatively and (I) positively regulated ‘Hallmarks’ signatures. (J) Heatmap for most differentially expressed genes from top positively regulated pathways (colors are log2FC). See also Figure S7.
Figure 7.
Figure 7.. Combinatorial therapy reinvigorates anti-tumor immunity
(A) umap plot of the identified intratumoral infiltrating immune cells. (B) Percentage of different intratumoral infiltrating immune populations identified in (A). (C) umap plot highlighting the whole population of T cells identified in (A) in purple (left) and umap plot showing the subpopulations identified within the T cells (right). (D-H) umap plot of T cells displaying select marker gene expression. (I) umap density plots showing distribution of annotated clusters in (C) within intratumoral T cells upon treatment. (J) Percentage of cells in individual CD4+ T clusters annotated in (C) by treatment. (K) Heatmap displaying expression of select genes in CD4+ T cell clusters (colors are log2FC). (L) Percentage of cells in individual CD8+ T clusters annotated in (C) by treatment. (M) Heatmap displaying expression of select genes in CD8+ T cell clusters (colors are log2FC). (N) Percentages of tumor volume after 2-week treatment combining anti-PD-1 and YKL-5–124 (Combo) with or without αCD4 (400 μg/mouse) or αCD8 (400 μg/mouse) antibodies (n = 8). Unpaired two-tailed t-test. **p < 0.01, ***p < 0.001. (O) Waterfall plot shows tumor response after week 2. Each column represents one mouse, comparing to baseline measurements (n = 8). Unpaired two-tailed t-test. **p < 0.01, ***p < 0.001. See also Figure S7.

Comment in

References

    1. Alexandrov LB, Nik-Zainal S, Wedge DC, Aparicio SA, Behjati S, Biankin AV, Bignell GR, Bolli N, Borg A, Borresen-Dale AL, et al. (2013). Signatures of mutational processes in human cancer. Nature 500, 415–421. - PMC - PubMed
    1. Aran D, Looney AP, Liu L, Wu E, Fong V, Hsu A, Chak S, Naikawadi RP, Wolters PJ, Abate AR, et al. (2019). Reference-based analysis of lung single-cell sequencing reveals a transitional profibrotic macrophage. Nat Immunol 20, 163–172. - PMC - PubMed
    1. Asghar U, Witkiewicz AK, Turner NC, and Knudsen ES (2015). The history and future of targeting cyclin-dependent kinases in cancer therapy. Nat Rev Drug Discov 14, 130–146. - PMC - PubMed
    1. Bakhoum SF, and Cantley LC (2018). The Multifaceted Role of Chromosomal Instability in Cancer and Its Microenvironment. Cell 174, 1347–1360. - PMC - PubMed
    1. Barilla RM, Diskin B, Caso RC, Lee KB, Mohan N, Buttar C, Adam S, Sekendiz Z, Wang J, Salas RD, et al. (2019). Specialized dendritic cells induce tumor-promoting IL-10(+)IL-17(+) FoxP3(neg) regulatory CD4(+) T cells in pancreatic carcinoma. Nat Commun 10, 1424. - PMC - PubMed

Publication types

MeSH terms

LinkOut - more resources