. 2020 Feb:30:101411.
doi: 10.1016/j.redox.2019.101411. Epub 2019 Dec 20.

Salusin-β mediates tubular cell apoptosis in acute kidney injury: Involvement of the PKC/ROS signaling pathway

Affiliations

Salusin-β mediates tubular cell apoptosis in acute kidney injury: Involvement of the PKC/ROS signaling pathway

Qing-Bo Lu et al. Redox Biol. 2020 Feb.

Abstract

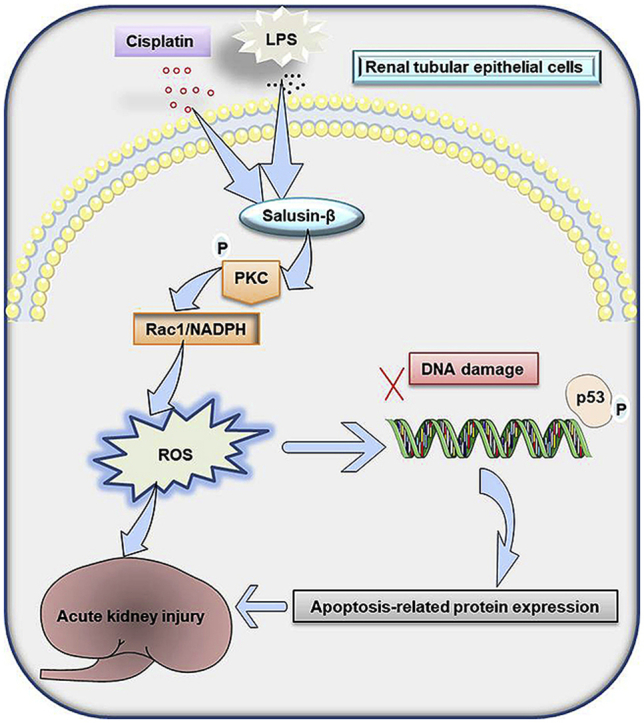
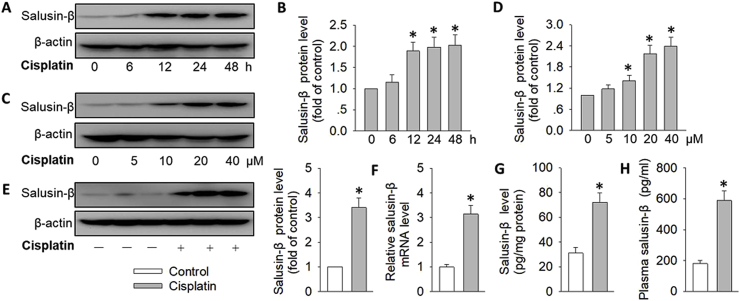
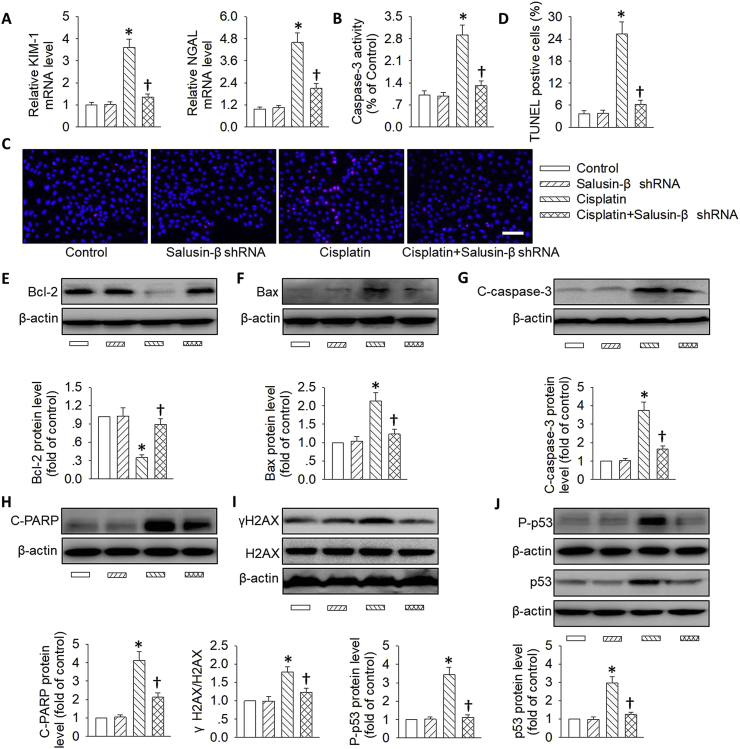
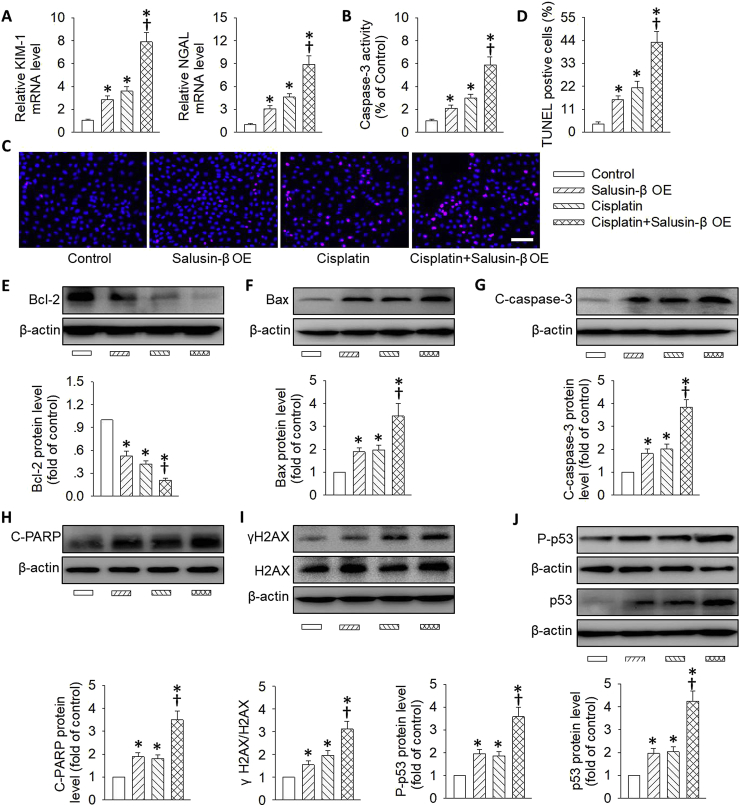
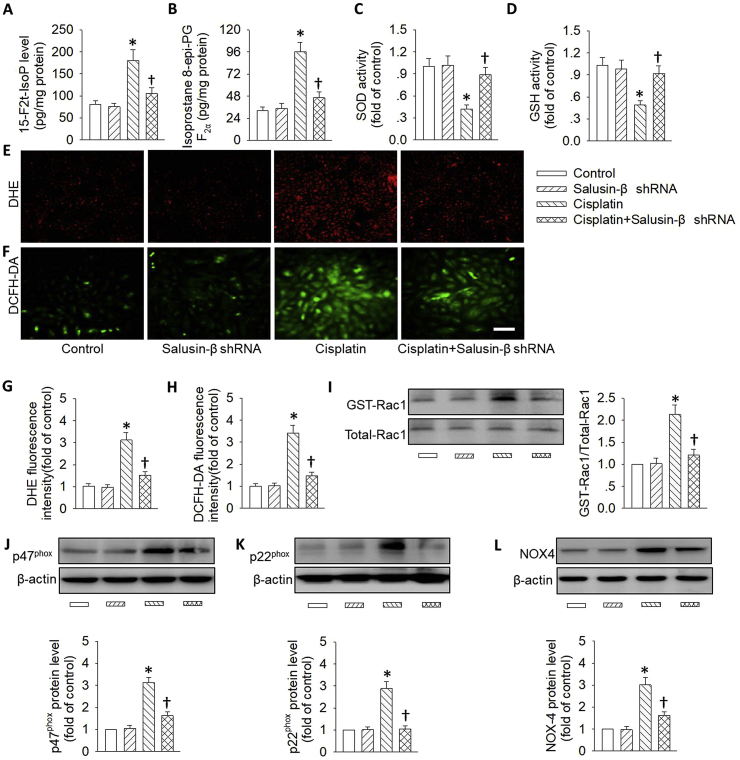
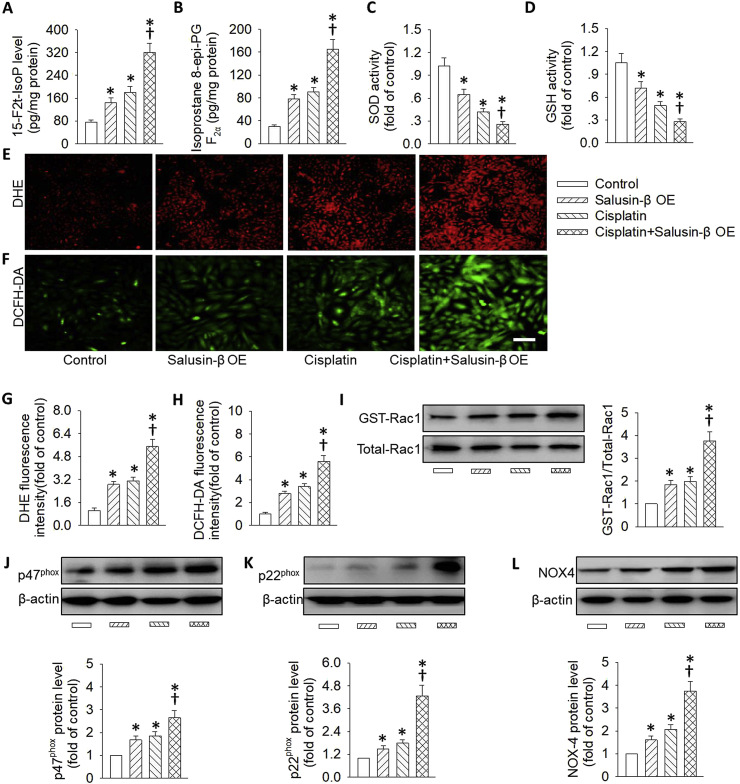
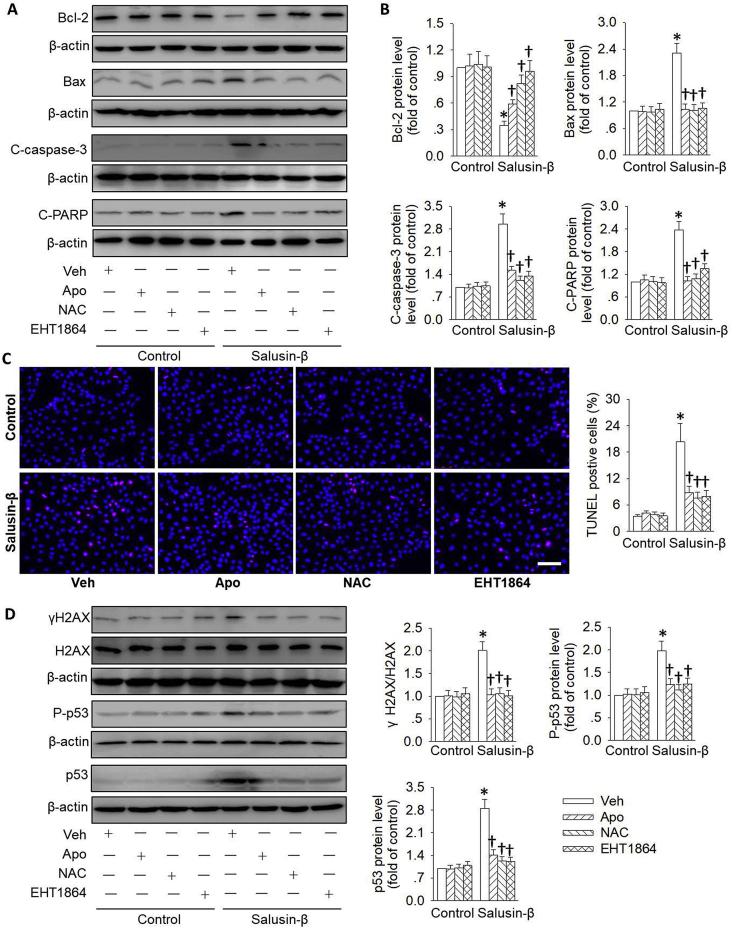
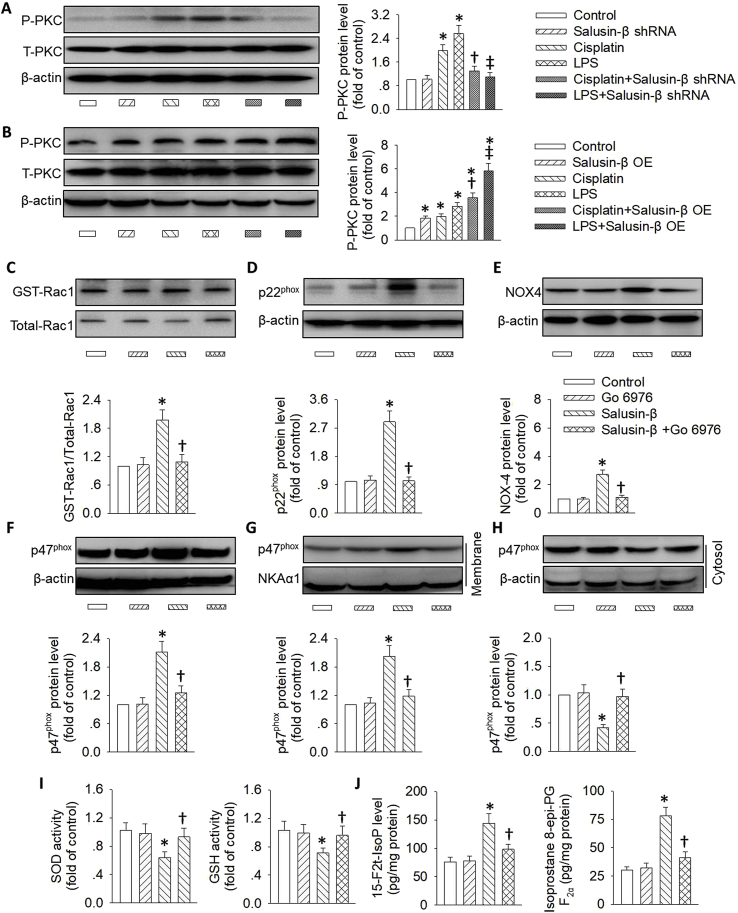
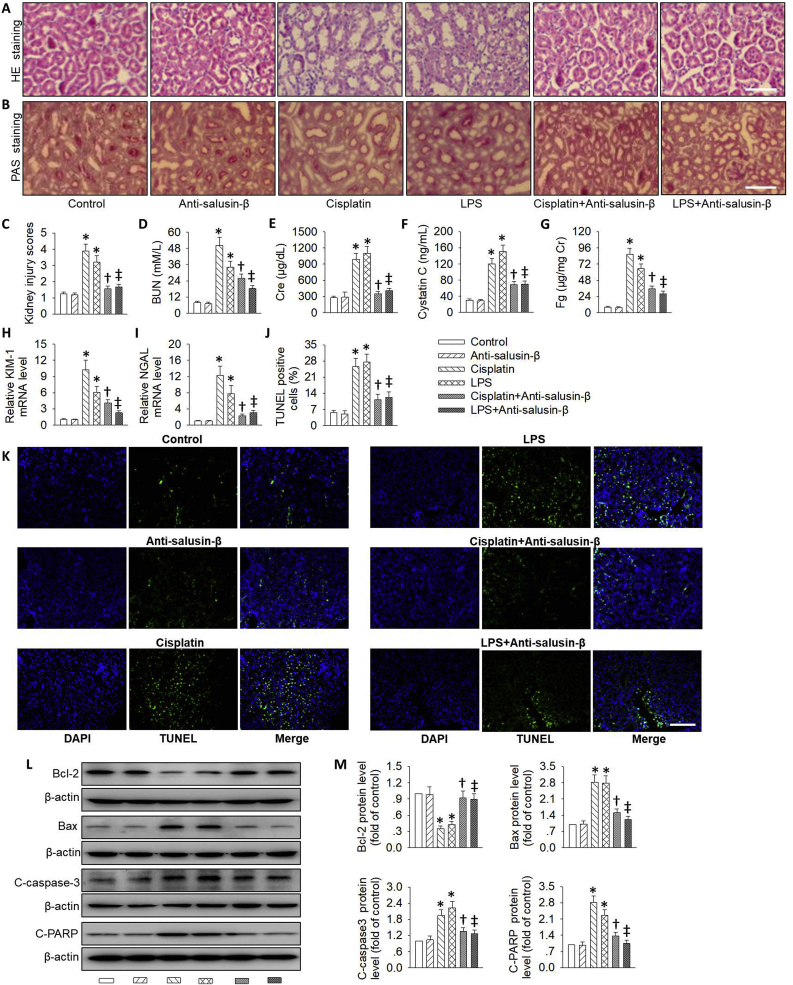
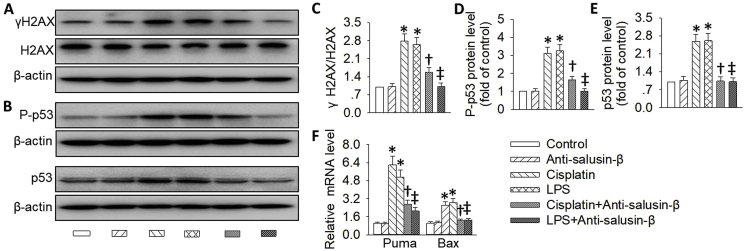
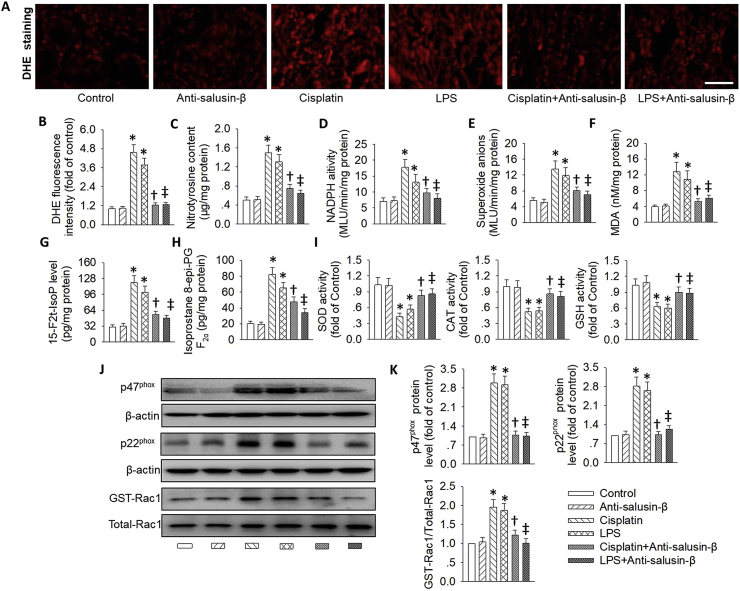
Salusin-β is abundantly expressed in many organs and tissues including heart, blood vessels, brain and kidneys. Recent studies have identified salusin-β as a bioactive peptide that contributes to various diseases, such as atherosclerosis, hypertension, diabetes and metabolic syndrome. However, the role of salusin-β in the pathogenesis of acute kidney injury (AKI) is largely unclear. In the present study, we investigated the roles of salusin-β in cisplatin or lipopolysaccharide (LPS)-induced renal injury. Herein, we found that salusin-β expression was upregulated in both renal tubular cells and kidney tissues induced by both cisplatin and LPS. In vitro, silencing of salusin-β diminished, whereas overexpression of salusin-β exaggerated the increased PKC phosphorylation, oxidative stress, histone γH2AX expression, p53 activation and apoptosis in either cisplatin or LPS-challenged renal tubular cells. More importantly, salusin-β overexpression-induced tubular cell apoptosis were abolished by using the PKC inhibitor Go 6976, reactive oxygen species (ROS) scavenger NAC, nicotinamide adenine dinucleotide phosphate (NADPH) oxidase inhibitor apocynin (Apo) or p53 inhibitor Pifithrin-α. In animals, blockade of salusin-β alleviated PKC phosphorylation, ROS accumulation, DNA damage, and p53 activation as well as renal dysfunction in mice after administration of cisplatin or LPS. Taken together, these results suggest that overexpressed salusin-β is deleterious in AKI by activation of the PKC/ROS signaling pathway, thereby priming renal tubular cells for apoptosis and death.

Keywords: Apoptosis; Cisplatin; DNA damage; LPS; Oxidative stress; Salusin.


Conflict of interest statement

Declaration of competing interest None.

Figures

Image 1
Graphical abstract
Fig. 1
Fig. 1
Expressions of salusin-β in cisplatin-treated renal tubular cells and mice. (A) Representative blots showing effect of cisplatin (20 μM) on the protein expression of salusin-β at 0, 6, 12, 24, 48 h. (B) Bar group showing the relative quantification of salusin-β. (C) Representative blots showing effect of cisplatin (0, 5, 10, 20, 40 μM) on the protein expression of salusin-β for 24 h. (D) Bar group showing the relative quantification of salusin-β. (E) Representative blots showing the protein expression of renal salusin-β in control mice or cisplatin-treated mice. (F) The mRNA expression of renal salusin-β in control mice or cisplatin-treated mice. (G) Renal protein levels of salusin-β in control mice or cisplatin-treated mice determined by ELISA. (H) Plasma salusin-β level. Values are mean ± SE. *P < 0.05 vs. 0 μM, 0 h or Control. n = 6 for each group.
Fig. 2
Fig. 2
Effects of salusin-β knockdown on cisplatin-induced renal tubular cell damage. HK-2 cells were transfected with adenovirus mediated shRNA against salusin-β (MOI = 100) for 48 h, and then used for cisplatin (20 μM) stimulation for 24 h. (A) Relative mRNA levels of KIM-1 and NGAL. (B) Caspase-3 activity. (C) Cell apoptosis determined with TUNEL assay. Blue fluorescence (Hoechst 33342) shows cell nuclei and green fluorescence (TUNEL) stands for apoptotic cells. (D) The ratio of TUNEL-positive cells to total cells. (E) Representative blots and quantitative analysis of Bcl-2. (F) Representative blots and quantitative analysis of Bax. (G) Representative blots and quantitative analysis of cleaved-caspase-3 (C-caspase-3). (H) Representative blots and quantitative analysis of cleaved-PARP (C-PARP). (I) Representative blots and quantitative analysis of γH2AX at 24 h after cisplatin (20 μM) stimulation. (J) Representative blots and quantitative analysis of total and phosphorylated p53. Scale bar = 50 μm. Values are mean ± SE. *P < 0.05 vs. Control, †P < 0.05 vs. Cisplatin. n = 6 for each group. (For interpretation of the references to color in this figure legend, the reader is referred to the Web version of this article.)
Fig. 3
Fig. 3
Effects of salusin-β overexpression on cisplatin-induced renal tubular cell damage. HK-2 cells were transfected with lentivirus expressing salusin-β (MOI = 100) for 48 h, and then used for cisplatin (20 μM) stimulation for 24 h. (A) Relative mRNA levels of KIM-1 and NGAL. (B) Caspase-3 activity. (C) Cell apoptosis determined with TUNEL assay. Blue fluorescence (Hoechst 33342) shows cell nuclei and green fluorescence (TUNEL) stands for apoptotic cells. (D) The ratio of TUNEL-positive cells to total cells. (E) Representative blots and quantitative analysis of Bcl-2. (F) Representative blots and quantitative analysis of Bax. (G) Representative blots and quantitative analysis of cleaved-caspase-3 (C-caspase-3). (H) Representative blots and quantitative analysis of cleaved-PARP (C-PARP). (I) Representative blots and quantitative analysis of γH2AX at 24 h after cisplatin (20 μM) stimulation. (J) Representative blots and quantitative analysis of total and phosphorylated p53. Scale bar = 50 μm. Values are mean ± SE. *P < 0.05 vs. Control, †P < 0.05 vs. Cisplatin. n = 6 for each group. (For interpretation of the references to color in this figure legend, the reader is referred to the Web version of this article.)
Fig. 4
Fig. 4
Effects of salusin-β knockdown on cisplatin-induced renal tubular cell oxidative stress. HK-2 cells were transfected with adenovirus mediated shRNA against salusin-β (MOI = 100) for 48 h, and then used for cisplatin (20 μM) stimulation for 24 h. (A) 15-F2t-isoprostane levels. (B) 8-iso-PGF-2α levels. (C) SOD activity. (D) GSH activity. (E&G) Represented images and quantitative analysis showing the levels of superoxide anions detected by DHE staining. (F&H) Represented images and quantitative analysis showing the levels of superoxide anions detected by DCFH-DA staining. (I) Representative blots and quantitative analysis of GTP-Rac1. (J) Representative blots and quantitative analysis of p47phox. (K) Representative blots and quantitative analysis of p22phox. (L) Representative blots and quantitative analysis of NOX-4. Scale bar = 50 μm. Values are mean ± SE. *P < 0.05 vs. Control, †P < 0.05 vs. Cisplatin. n = 6 for each group.
Fig. 5
Fig. 5
Effects of salusin-β overexpression on cisplatin-induced renal tubular cell oxidative stress. HK-2 cells were transfected with lentivirus expressing salusin-β (MOI = 100) for 48 h, and then used for cisplatin (20 μM) stimulation for 24 h. (A) 15-F2t-isoprostane levels. (B) 8-iso-PGF-2α levels. (C) SOD activity. (D) GSH activity. (E&G) Represented images and quantitative analysis showing the levels of superoxide anions detected by DHE staining. (F&H) Represented images and quantitative analysis showing the levels of superoxide anions detected by DCFH-DA staining. (I) Representative blots and quantitative analysis of GTP-Rac1. (J) Representative blots and quantitative analysis of p47phox. (K) Representative blots and quantitative analysis of p22phox. (L) Representative blots and quantitative analysis of NOX-4. Scale bar = 50 μm. Values are mean ± SE. *P < 0.05 vs. Control, †P < 0.05 vs. Cisplatin. n = 6 for each group.
Fig. 6
Fig. 6
Role of the Rac 1/NADPH oxidase/ROS pathway in salusin-β-induced tubular cell injury. HK-2 cells were pretreated with ROS scavenger NAC (1 mM), NADPH oxidase inhibitor Apo (100 μM), and Rac-1 inhibitor EHT1864 (1 μM) for 30 min, and then transfected with lentivirus expressing salusin-β (MOI = 100) for 48 h. (A) Representative blots showing the protein level of Bcl-2, Bax, cleaved-caspase-3 (C-caspase-3), cleaved-PARP (C-PARP). (B) Quantitative analysis of the protein level of Bcl-2, Bax, cleaved-caspase-3 (C-caspase-3), cleaved-PARP (C-PARP). (C) Cell apoptosis determined with TUNEL assay. Blue fluorescence (Hoechst 33342) shows cell nuclei and green fluorescence (TUNEL) stands for apoptotic cells. (D) Representative blots and quantitative analysis of γH2AX, total and phosphorylated p53 at 48 h after salusin-β overexpression. Scale bar = 50 μm. Values are mean ± SE. *P < 0.05 vs. Control, †P < 0.05 vs. Vehicle (Veh). n = 6 for each group. (For interpretation of the references to color in this figure legend, the reader is referred to the Web version of this article.)
Fig. 7
Fig. 7
Role of the PKC pathway in salusin-β-induced oxidative stress in renal tubular cells. (A) Effect of salusin-β knockdown on the phosphorylated PKC in HK-2 cells treated either cisplatin or LPS. (B) Effect of salusin-β overexpression on the phosphorylated PKC in HK-2 cells treated either cisplatin or LPS. HK-2 cells were pretreated with PKC inhibitor Go 6976 (5 μM), and then transfected with lentivirus expressing salusin-β (MOI = 100) for 48 h. The protein expressions of GTP-Rac1 (C), p22phox (D), NOX-4 (E), and p47phox (F) were measured. (G&H) The membrane and cytosol level of p47phox were also detected. (I) Activities of SOD and GSH. (J) 15-F2t-isoprostane and 8-iso-PGF-2α levels. Values are mean ± SE. *P < 0.05 vs. Control, †P < 0.05 vs. Cisplatin or Salusin-β. ‡P < 0.05 vs. LPS. n = 6 for each group.
Fig. 8
Fig. 8
Effects of salusin-β inhibition on renal function after AKI. (A) HE staining of kidney sections after cisplatin or LPS-induced kidney injury. (B) Periodic acid-Schiff (PAS) staining of kidney sections after cisplatin or LPS-induced kidney injury. (C) Quantitative assessment of tubular injury. (D) BUN level. (E) Serum Cr level. (F) Serum cystatin C level. (G) Fg level. (H) Relative KIM-1 mRNA level. (I) Relative NGAL mRNA level. (J&K) TUNEL staining. (L) Representative blots showing the protein level of Bcl-2, Bax, cleaved-caspase-3 (C-caspase-3), cleaved-PARP (C-PARP). (M) Quantitative analysis of the protein level of Bcl-2, Bax, cleaved-caspase-3 (C-caspase-3), cleaved-PARP (C-PARP). Scale bar = 50 μm. Values are mean ± SE. *P < 0.05 vs. Control, †P < 0.05 vs. Cisplatin, ‡P < 0.05 vs. LPS. n = 6 for each group.
Fig. 9
Fig. 9
Effects of salusin-β inhibition on DNA damage/p53 signaling after AKI. (A,C) Representative blots and quantitative analysis of γH2AX. (B,D,E) Representative blots and quantitative analysis of total and phosphorylated p53. (F) Relative mRNA levels of p53 targeted proapoptotic genes, including Puma and Bax. Values are mean ± SE. *P < 0.05 vs. Control, †P < 0.05 vs. Cisplatin, ‡P < 0.05 vs. LPS. n = 6 for each group.
Fig. 10
Fig. 10
Effect of salusin-β inhibition on oxidative stress after AKI. (A&B) DHE staining. (C) Nitrotyrosine content. (D) NADPH oxidase activity. (E) Superoxide anions level. (F) MDA content. (G) 15-F2t-isoprostane level. (H) 8-iso-PGF-2α level. (I) Activities of SOD, CAT and GSH. (J&K) Representative blots and quantitative analysis of p47phox, p22phox, and GTP-Rac1. Scale bar = 50 μm. Values are mean ± SE. *P < 0.05 vs. Control, †P < 0.05 vs. Cisplatin, ‡P < 0.05 vs. LPS. n = 6 for each group.

References

    1. Hoste E.A.J., Kellum J.A., Selby N.M. Global epidemiology and outcomes of acute kidney injury. Nat. Rev. Nephrol. 2018;14:607–625. - PubMed
    1. Shum H.P., Yan W.W., Chan T.M. Recent knowledge on the pathophysiology of septic acute kidney injury: a narrative review. J. Crit. Care. 2016;31:82–89. - PubMed
    1. Bellomo R., Kellum J.A., Ronco C., Wald R., Martensson J., Maiden M., Bagshaw S.M., Glassford N.J., Lankadeva Y., Vaara S.T., Schneider A. Acute kidney injury in sepsis. Intensive Care Med. 2017;43:816–828. - PubMed
    1. Li Z.L., Lv L.L., Tang T.T., Wang B., Feng Y., Zhou L.T., Cao J.Y., Tang R.N., Wu M., Liu H., Crowley S.D., Liu B.C. HIF-1 alpha inducing exosomal microRNA-23a expression mediates the cross-talk between tubular epithelial cells and macrophages in tubulointerstitial inflammation. Kidney Int. 2019;95:388–404. - PubMed
    1. Bonventre J.V., Yang L. Cellular pathophysiology of ischemic acute kidney injury. J. Clin. Investig. 2011;121:4210–4221. - PMC - PubMed

Publication types

MeSH terms